Today's market has a lot of information. Two major pieces of news in the focus news directly affect the market. The first is that the closure of yen arbitrage trading impacts global risk assets, with the crisis of Japanese retail shorts worsening, and 23.5 billion dollars may continue to boost the yen, which suppresses global risk appetite and puts pressure on the cryptocurrency market. The second is that a vulnerability was exposed in the Liquid sidechain, resulting in the minting of 4000 fake BTC, with reserves plummeting to 197 coins, this striking a short-term emotional blow to the trust in the BTC ecosystem. The combination of these two events explains why Bitcoin appears to be struggling after rebounding above 79,000.
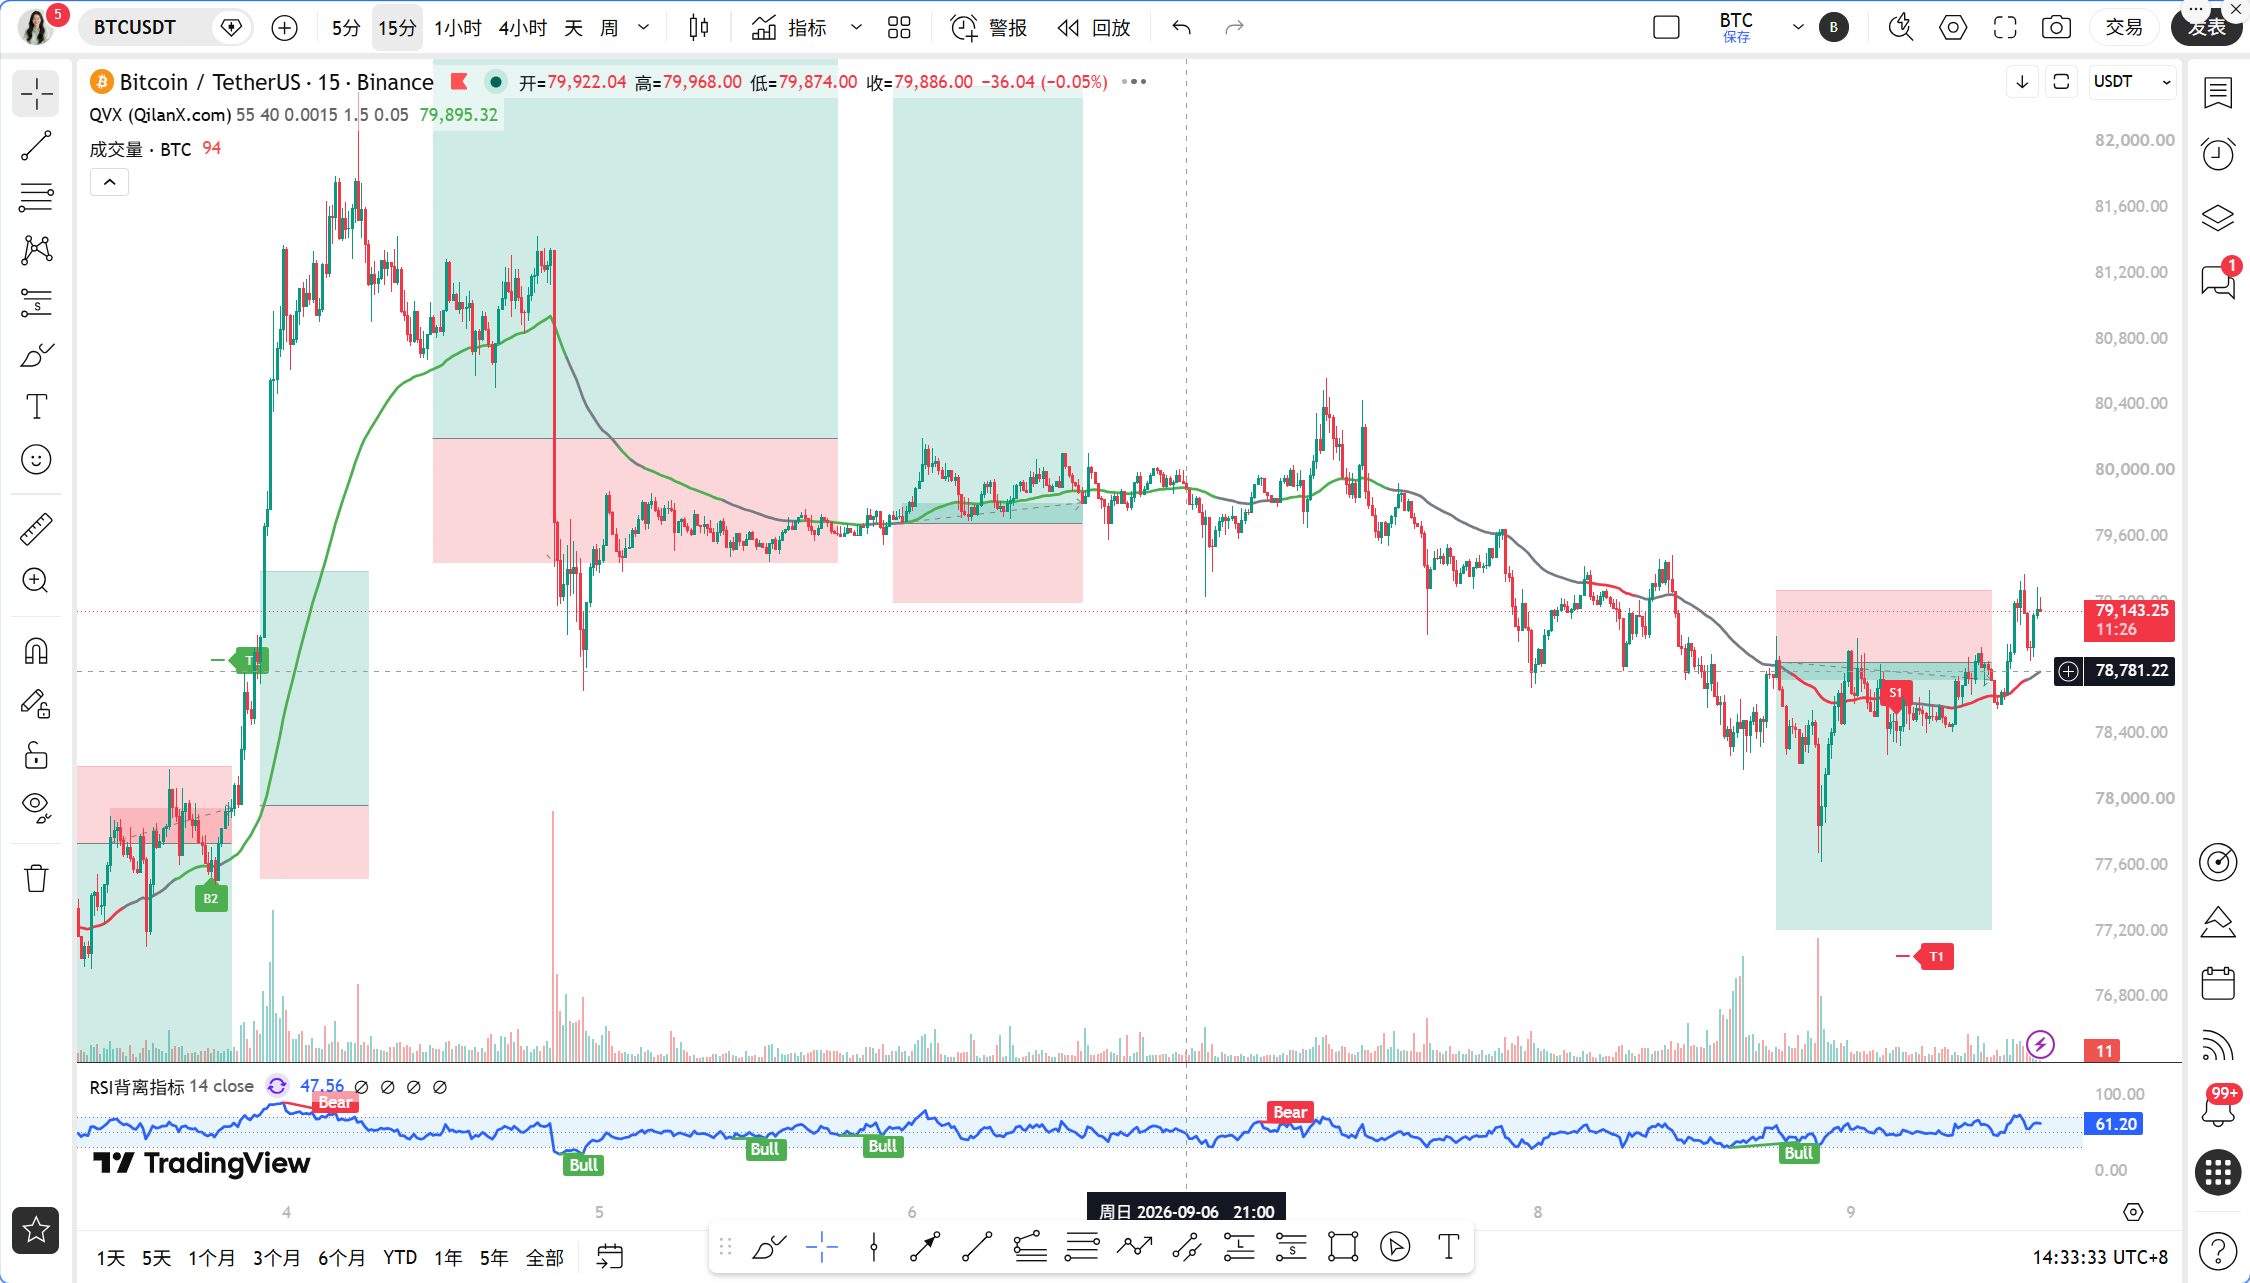
The current time is September 9th at 14:31, with a Bitcoin quote of 79,182 USDT, a 24-hour increase narrowing to 1.05%. This position is very delicate, just stuck around the 1-hour EMA55, which is a typical line-bouncing volatility area. Both bulls and bears are waiting for a direction choice, and the trading volume has not been significantly released, putting the short-term in a fragile balance.
First, let's look at the multi-cycle status. On the daily level, MA5 is at 79,384, MA10 at 79,121, and MA30 at 74,204, the moving average system is still in a bullish arrangement, but the MACD histogram is a negative value of 444.18, with the DIF and DEA forming a dead cross at a high position and continuing to diverge downwards, and the RSI has fallen to 50.51, indicating a correction phase in an upward trend on the daily line. The 4-hour level is somewhat weaker, with MA30 at 79,439 showing clear resistance, the MACD histogram at a negative value of 60.65, DIF at -201.26, DEA at -140.61, and RSI at only 37.69, indicating that bear momentum on the 4-hour has not been completely released. On the hourly level, MA5 is at 78,928, MA10 at 78,781, and MA30 at 78,660, with prices already above these short-term moving averages, EMA55 at 78,973, and the current price of 79,182 above EMA55, the MACD histogram is a positive value of 92.95, DIF at 34.03 crosses above DEA at -58.91, RSI at 59.85, indicating a slightly bullish short-term trend. On the 15-minute level, MA5 is at 79,061, MA10 at 79,097, MA30 at 78,827, with the MACD histogram being a positive value of 17.48, RSI at 71.18 entering overbought territory, indicating a need for a short-term pullback.
Using the Qinglan TPV system to verify the signals. The core rule is the 1-hour EMA55 as the boundary between bulls and bears, with the current price of 79,182 higher than EMA55 at 78,973, meeting the first condition for a bullish trend. However, note that in the past 8 1-hour candles, the closing prices above EMA55 occurred only 2 times, with the crossing occurring 3 times, and the absolute distance from EMA55 is 0.26%. Although this data does not meet the oscillation threshold, the line-bouncing volatility itself indicates insufficient trend strength, with an increasing probability of oscillation. The condition for going long requires two consecutive 1-hour candles to close above EMA55, and currently, the 1-hour candle indeed closed above EMA55, but too many crossings indicate poor stability. For support stabilization, a long lower shadow or bottom-type structure is needed; the current market does not have a particularly clear bottom shape. Regarding the exhaustion of downward momentum, the 1-hour MACD histogram is indeed expanding in positive value, and the RSI has rebounded from the low to 59.85, which satisfies this part. Overall, the TPV system concludes a slightly bullish stance but with insufficient signal strength, needing to wait for a clearer confirmation.
On-chain and funding data need to be taken seriously. The Fear and Greed Index is at 66, with the market in a greedy state, which often serves as a contrarian indicator in a heavily negative environment. Bitcoin’s market share is 58.42%, indicating that funds are still concentrated in BTC, and the performance of altcoins will be weaker. In the past 24 hours, the total network liquidation reached 246 million dollars, with bulls occupying 157 million, and leverage cleansing may not be over. The probability of a 25 basis point rate hike by the Federal Reserve in September has reached 60.4%, which continues to suppress risk assets. Germany plans to cancel the tax exemption policy for long-term Bitcoin holdings, which may trigger selling pressure from German investors. Gold has fallen below 4,350 dollars, with a daily drop of 1.3%, and the simultaneous decline of safe-haven assets indicates indiscriminate selling under expectations of tightening liquidity.
The key attack and defense positions are very clear. The first resistance level above is at the 4-hour MA30 at 79,439, which is also a dense transaction area from the previous decline, requiring significant volume to break through. The second resistance level is near the daily MA5 at 79,384, forming a resonating pressure zone with the 4-hour MA30, and 79,500 to 79,600 is the short-term dividing line between bulls and bears. The first support below is at the 1-hour EMA55 at 78,973. If two consecutive 1-hour candles close below this position, the TPV system will switch to a bearish signal. The second support is in the area of 78,600 to 78,700, corresponding to the support zone of the 1-hour MA30 and the 4-hour MA5. The third support is at the integer mark of 78,000, which is the low point of yesterday's sharp drop; once lost, it will open up downward space.
In terms of trading ideas, Qinglan provides a clear framework. The directional judgment is bearish with oscillation, although the price is above EMA55 on the 1-hour level, the bearish pressure on the 4-hour and daily levels is heavier, coupled with the dense negative news, raising doubts about the strength of the rebound. There are two entry conditions. The first is an aggressive short strategy; if the price rebounds to the 79,500 to 79,600 area and the 1-hour candle shows a long upper shadow or top-type structure, while the MACD histogram starts to shorten, a small position can be taken short, with stop-loss placed above 80,000, targeting 78,600, with a second target of 78,000. The second is a conservative long strategy, requiring the wait for the price to pull back to stabilize in the 78,600 to 78,700 area, showing a long lower shadow or bottom-type structure, while the 1-hour MACD histogram does not continue to expand in negative value, then it can be attempted to go long, with a stop-loss below 78,300, targeting 79,400, and looking for 80,000 after a breakout. If the price directly drops below 78,600 and two consecutive 1-hour candles close below EMA55, the long plan should be abandoned, and the trend should be followed short towards 78,000.
Regarding risk warnings, the current macro environment is complex, with yen arbitrage closures and geopolitical conflicts potentially triggering sudden market changes, so any trades must strictly control position sizes, and stop-losses must be executed accurately; do not hold onto positions.
Follow Qinglan Crypto Classroom to seize more trading opportunities! Welcome to visit the official website www.qinglan.org
📊 Qinglan TPV trading strategy backtesting reference
🕒 Last backtesting time 09-09 07:00:02
Total Analysis: 3897 Backtest: 3890 Accuracy: 79% (3074/3890)
免责声明:本文章仅代表作者个人观点,不代表本平台的立场和观点。本文章仅供信息分享,不构成对任何人的任何投资建议。用户与作者之间的任何争议,与本平台无关。如网页中刊载的文章或图片涉及侵权,请提供相关的权利证明和身份证明发送邮件到support@aicoin.com,本平台相关工作人员将会进行核查。