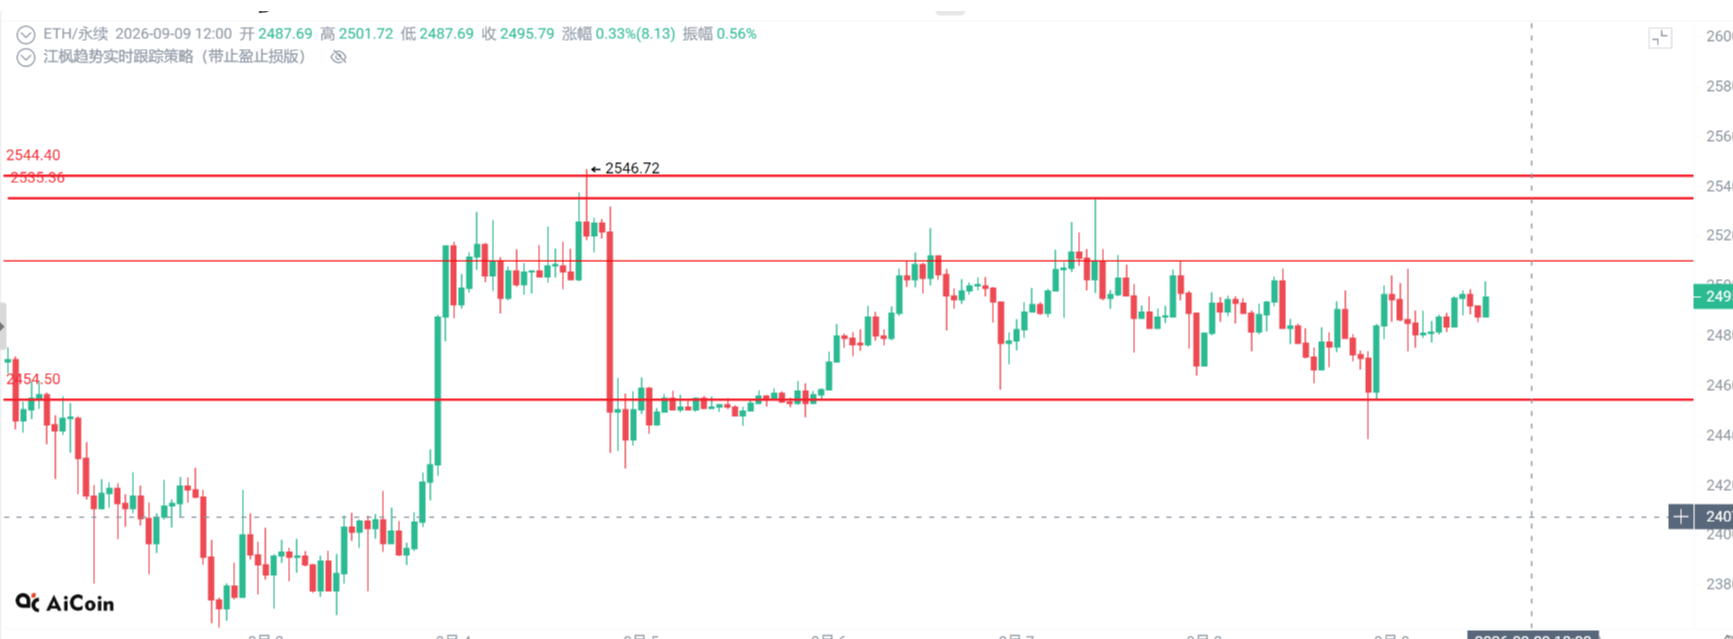
The current Bitcoin short-term trend is still in a phase of consolidation.
Last night, the price briefly dipped down to around $77,600, then quickly recovered above $78,100, and several consecutive candlesticks indicated a recovery upwards, reaching nearly $79,000 at one point.
This trend illustrates that there is currently some support near the $77,600 level.
From the hourly chart perspective, after the price broke below $78,000, it did not continue to expand the decline but instead quickly regained $78,100 and continued moving upwards.
Therefore, the short-term focus is still on observing $78,100.
As long as this level can be held, the current recovery structure has not been destroyed.
$78,500—$78,800, determining whether the rebound can continue
The hourly chart has started to show signs of recovery. If the price can further stabilize at $78,500, then the short-term rebound is expected to continue.
From the 4-hour perspective, the pressure around $78,800 is more apparent.
During yesterday's decline, a noticeable bullish engulfing pattern appeared on the 4-hour chart. The price first dipped down to $77,600, then quickly recovered and covered several preceding bearish candlesticks.
This indicates there is indeed buying support below.
However, it cannot be directly defined as a trend reversal here.
Because the 4-hour chart has still not completed a real structural breakout, the price remains within the previous consolidation range.
Therefore, if it can stabilize above $78,800 next, the rebound will be considered further upgraded. Daily sharing of real-time trading strategies, free provision of position diagnostics, recovery ideas, and market practical insights, scan to follow the public account“Bitcoin Spring”, join the community to get strategies!
Daily lines still weak, but the bottom structure has not been damaged for now
The daily line still shows a gradual downward movement of the peaks, so the medium-short-term direction remains weak for now.
However, the problem is that although the price continues to test below, it has not genuinely broken through the important bottom.
The low point on August 28 was approximately $76,800, and after the price further dipped to $76,300 on September 1, it quickly reclaimed above the previous low, then continued to repair upwards.
This process formed a relatively obvious 2B bottom structure.
So, even though the daily line looks to be in a pullback, it cannot be simply interpreted as a trend that has turned bearish.
The most critical level for the daily line remains $77,600.
If the daily line closes below $77,600, then this retest could potentially be escalated, and further attention would need to be paid to the $76,100 and $75,000 vicinity of the lower end of the consolidation range.
But if the price can stabilize again above $78,500, then the current daily line structure still does not have significant problems. Daily sharing of real-time trading strategies, free provision of position diagnostics, recovery ideas, and market practical insights, scan to follow the public account“Bitcoin Spring”, join the community to get strategies!
Weekly lines still strong, $82,800—$84,000 is the key pressure
Looking at a larger timeframe, the weekly line remains relatively strong structurally.
The previously formed bullish engulfing pattern has not been damaged, and the price is still undergoing consolidation within the range, without having formed a true high-level breakout or breakdown.
On the monthly line, $82,800—$84,000 is a very important pressure zone.
From our calculations based on the Fibonacci structure at around $15,000, the 0.618 position approximately corresponds to $84,000.
Moreover, there is previous horizontal pressure around $82,800.
Thus, $82,800—$84,000 effectively forms a consolidated pressure band.
Only by truly breaking through this zone can the subsequent upward space be opened further. Daily sharing of real-time trading strategies, free provision of position diagnostics, recovery ideas, and market practical insights, scan to follow the public account“Bitcoin Spring”, join the community to get strategies!
Indicators show: bearish, but downward momentum is not strong
From the MACD perspective, the hourly line has formed a golden cross below the zero axis, and there appears to be some volume accompanying, indicating short-term repair is underway.
The 4-hour MACD, while still in a dead cross state, has begun to see a reduction in downward momentum, suggesting the downward momentum is slowing.
The daily MACD remains above the zero axis, and currently resembles a pullback within an upward backdrop, rather than a complete weakening of the long-term trend.
In terms of moving averages, the MA20 is currently around $78,700, while the 5-day and 7-day moving averages still exert some pressure on the price.
Therefore, one shouldn't only look at whether the price has risen above the MA20 in the short term.
What truly needs to be focused on is whether it can reclaim the 5-day and 7-day moving averages.
Until this action is completed, the intraday structure remains bearish.
Overall, the hourly line has begun to repair, the 4-hour downward momentum is weakening, and the larger directional trend of the daily and weekly lines has not fundamentally changed for now. Daily sharing of real-time trading strategies, free provision of position diagnostics, recovery ideas, and market practical insights, scan to follow the public account“Bitcoin Spring”, join the community to get strategies!
Summary: Bearish but not strong, waiting for key positions to choose direction
Bearish, but not strong.
There is indeed a pullback pressure in the short term, but buying support has emerged around $77,600, and the 4-hour bullish engulfing pattern has somewhat limited the downward space.
At the same time, the larger upward background of the daily and weekly lines has not been destroyed for now.
Therefore, a more reasonable interpretation is still a phase of pullback and consolidation within the upward trend, rather than directly defining it as a reversal of the long-term trend.
Next, focus on two directions.
Upwards:
If the 4-hour line can stabilize back above $78,800, the short-term rebound is expected to escalate further.
Downwards:
If the daily line ultimately breaks below $77,600 and closes beneath it, the pullback could potentially expand, with the next focus on $76,100 and around $75,000.
As long as $77,600 has not been effectively broken, the long-term bullish structure remains temporarily intact.
The short-term bearishness is more of an auxiliary judgment, and shouldn't be interpreted as a trend reversal due to a few bearish candlesticks.
The biggest characteristic of the current market phase is—grind.
Therefore, rather than repeatedly guessing directions within the consolidation range, it is better to wait for a true breakout or breakdown at key positions before confirming the next stage of the market.

Daily sharing of real-time trading strategies, free provision of position diagnostics, recovery ideas, and market practical insights, scan to follow the public account“Bitcoin Spring”, join the community to get strategies!
免责声明:本文章仅代表作者个人观点,不代表本平台的立场和观点。本文章仅供信息分享,不构成对任何人的任何投资建议。用户与作者之间的任何争议,与本平台无关。如网页中刊载的文章或图片涉及侵权,请提供相关的权利证明和身份证明发送邮件到support@aicoin.com,本平台相关工作人员将会进行核查。