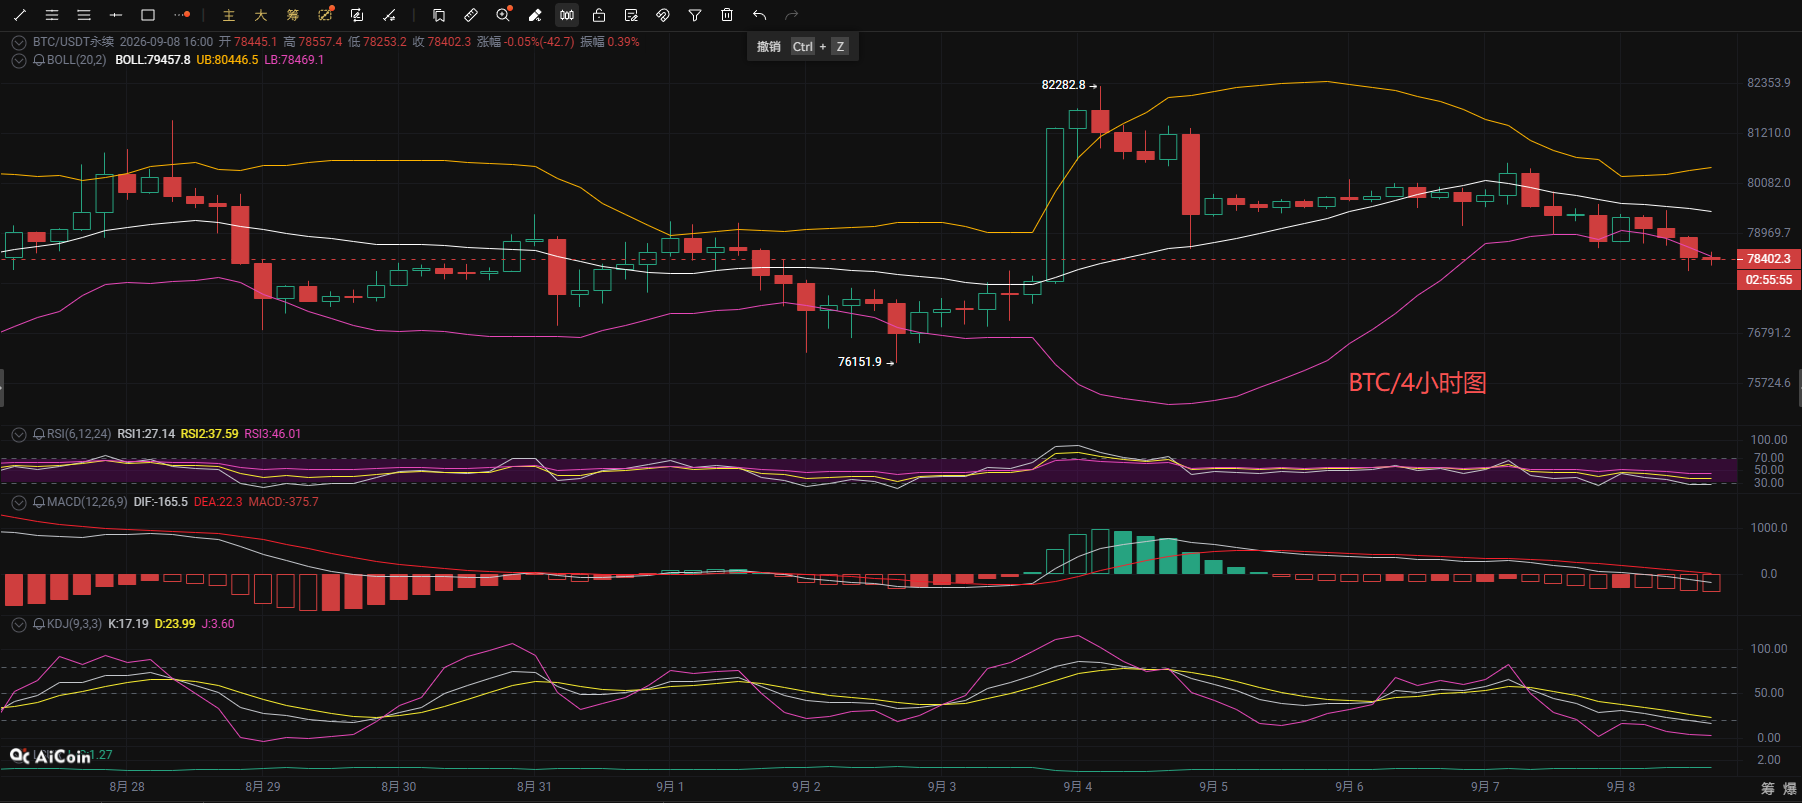
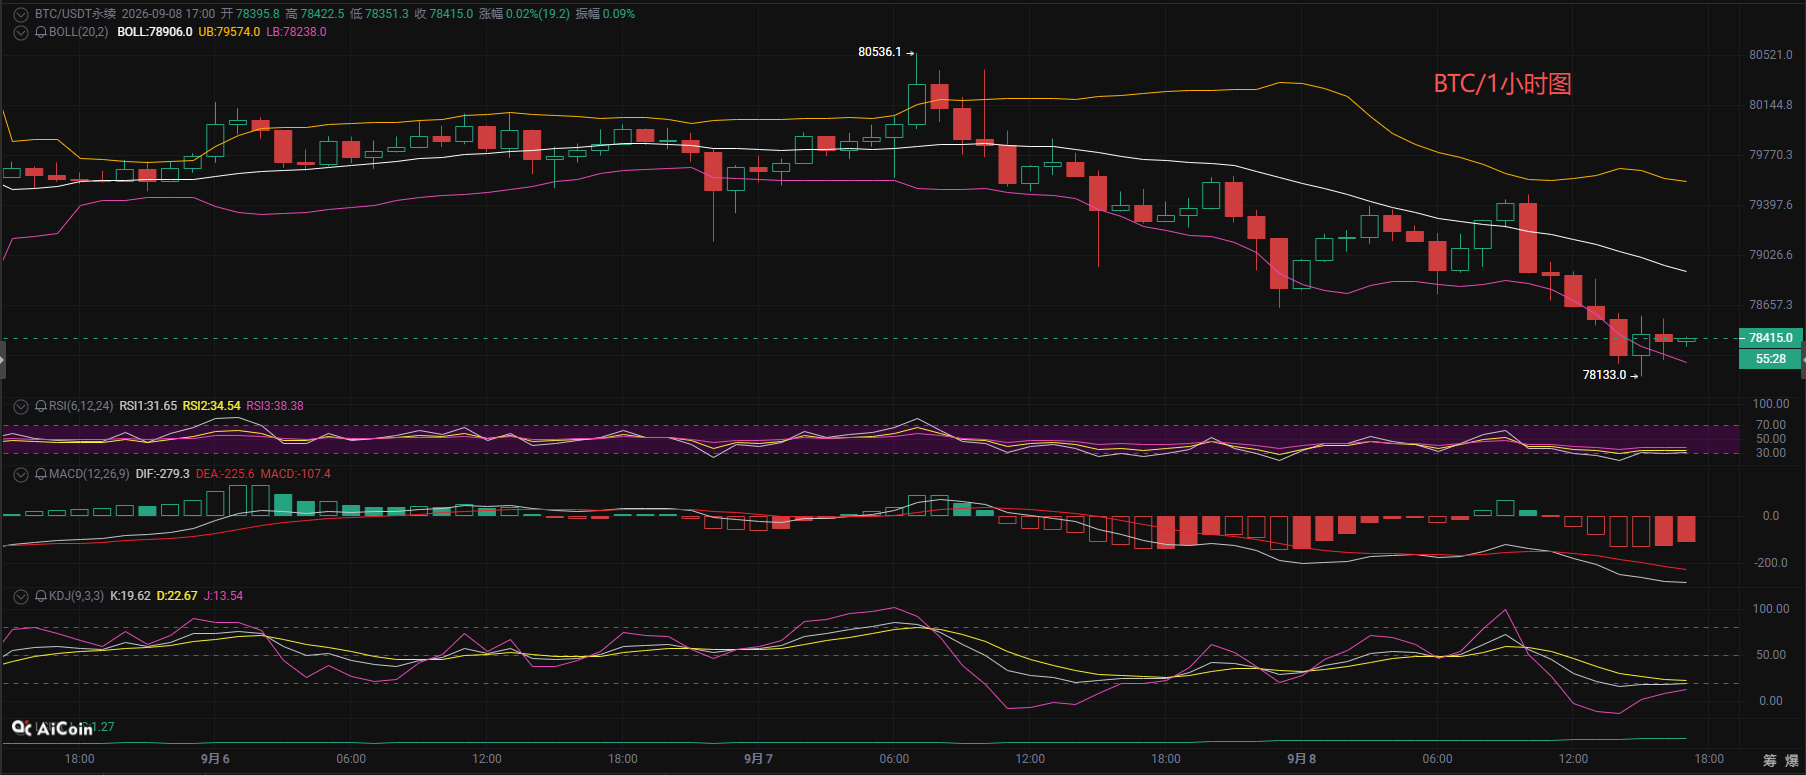
Currently, looking at the 4-hour chart of Bitcoin, the price has retreated to around 78300. The overall Bollinger Bands are opening downwards, and the price is running between the middle and lower Bollinger Bands. The MACD is maintaining bearish green columns, with the DIF continuously below the DEA, and the larger bearish pattern has not changed. Although the RSI has fallen to a low level and the KDJ indicator is turning upwards from a low position, there is a technical demand for a rebound due to overselling. However, this is merely a technical rebound after the decline and does not indicate that the trend has reversed. On the 1-hour level, the price has been continuously declining, the Bollinger Bands are moving downwards, and the price was once close to the lower band. The MACD green columns are still expanding, and the KDJ is dulling at a low level. The current rebound is just a weak repair during the decline, without a clear stabilization and reversal structure; do not blindly look bullish just because of a small bullish candlestick.
After the short-term price bottomed out at 78133, a slight rebound occurred, with the MACD showing red columns, and the KDJ completing a golden cross upwards, indicating momentum for a short-term rebound. However, it's difficult for a small cycle repair to directly reverse the larger bearish direction on the 4-hour chart; one must distinguish levels clearly and not regard a short-term rebound as a trend reversal. Key attention should be on two critical price levels: strong support is around 78000, which is also the recent low point and the daily Bollinger middle axis. If it effectively breaks down, the bearish strength will be further released, and the trend will continue to decline. The first resistance level above is 79000, and the second resistance is 79600; only with sustained stability above 79000 will the short-term bearish pressure be relieved. The above is merely a technical sharing of the market and does not constitute any investment advice.Follow Mr. Coin for real-time analysis of the market.
9.8 Bitcoin Short-term Reference:
Short sell in the 79000-80200 range, stop loss 500 points, target below 78500
Long buy in the 76500-75500 range, target above 77500, stop loss 500
The analysis is a forecast, based on actual market conditions; strategy suggestions are for reference only. Market conditions change rapidly, regardless of how well one estimates the market, always manage profit-taking and stop-loss effectively to secure gains.
For more real-time trading strategies, online technical learning, and liquidation guidance, you can follow the mentor's public account (Mr. Coin Talks About Coins) for ways to add: the first ten each day can receive free liquidation strategies.

免责声明:本文章仅代表作者个人观点,不代表本平台的立场和观点。本文章仅供信息分享,不构成对任何人的任何投资建议。用户与作者之间的任何争议,与本平台无关。如网页中刊载的文章或图片涉及侵权,请提供相关的权利证明和身份证明发送邮件到[email protected],本平台相关工作人员将会进行核查。