Brothers, the journey in the world is not afraid of distance, encountering like-minded ones along the way. Hello everyone, I am Jiang Ye.
⚠️ The following is only a technical logic deduction of the market, for communication reference only, and does not constitute any investment advice. The market is highly volatile, and contracts must strictly control positions and set stop-losses.
Today there is an interesting phenomenon in the market: strong non-farm payrolls, rising interest rate expectations, oil prices rushing to 96 dollars, but the strong non-farm data failed to break through the 80,000 level, and there is support beneath despite bearishness. The CPI is the real touchstone. Logically, all these are bearish, and BTC should continue to drop. However, the actual situation is that after the non-farm data fell to 78,649, the price stabilized around 80,000 dollars, without a continuous drop.
What does this indicate? It indicates that after the macro bearish news came out, the market still has support. The 80,000 dollar level is not just an integer mark but a real battleground between bulls and bears.
I will break down the current market situation for everyone from three dimensions: macro, technical, and time nodes, factually and realistically. For real-time changes during the session, feel free to communicate and follow up together. safew, three lines jyx9188
1. Macro Aspect: Is the bad news already priced in? No, CPI is the next card to play
First, let's clarify the macro logic.
The United States added 162,000 jobs in August non-farm payrolls, significantly above expectations, and the unemployment rate remains at 4.1%. After the data was released, the market pushed the probability of a September interest rate hike to nearly 60%. As interest rate expectations rise, the dollar and U.S. Treasury yields are supported, exerting pressure on risk assets — this logical chain is sound, so it's normal for BTC to fall below 80,000 and gold to retreat after the non-farm data.
But what is truly worthy of attention is: Why did it stabilize after dropping?
My judgment is that the market has shown signs of "bearish dulling." What does bearish dulling mean? It means that bad news comes out, prices drop rapidly, but then they are picked up by buyers, indicating that the buying capacity below is strengthening. These buyers may come from ETFs, institutional allocations, or funds that previously missed out and are waiting for a correction. For long-term funds, a single non-farm data can change short-term trading but may not alter long-term allocation logic.
However, there is a variable that cannot be ignored: oil prices. Brent crude oil has reached 96.45 dollars, and WTI is at 91.85 dollars. Rising oil prices mean the market is starting to worry about inflation again. If a chain forms in the future of "strong employment → high oil prices → rising inflation → the Federal Reserve becoming more hawkish → yields rising," the macro pressure BTC faces will significantly increase.
So the real question now is not "will non-farm data affect BTC," but "will strong employment and high oil prices further change inflation expectations." The answer to this needs to wait for this Friday’s CPI data to be revealed. For real-time changes during the session, feel free to communicate and follow up together. safew, three lines jyx9188
Currently, the market expects the overall CPI in August to be about 3.4% year-on-year, and the core CPI to be about 2.4%, with a high probability of remaining flat, and no significant rate cuts expected. There are two scenarios:
If CPI continues to cool down
: Strong employment + cooling inflation, the economy has resilience but inflation is not out of control, expectations for rate hikes cool down again, and the current correction in BTC may instead become a handover, with 80,000 dollars reverting to support.
If CPI exceeds expectations
: Strong employment + high inflation + high oil prices + high yields, the space for the Federal Reserve to cut rates is compressed, and whether 80,000 dollars can hold will face real tests.
Conclusion: Before CPI, the market will likely maintain range-bound fluctuations, and won't exhibit a clear one-way movement. Before the data is released, all positions should be light, strictly incorporating stop-losses, and adjustments should be made in the direction of the trend after the data is released.
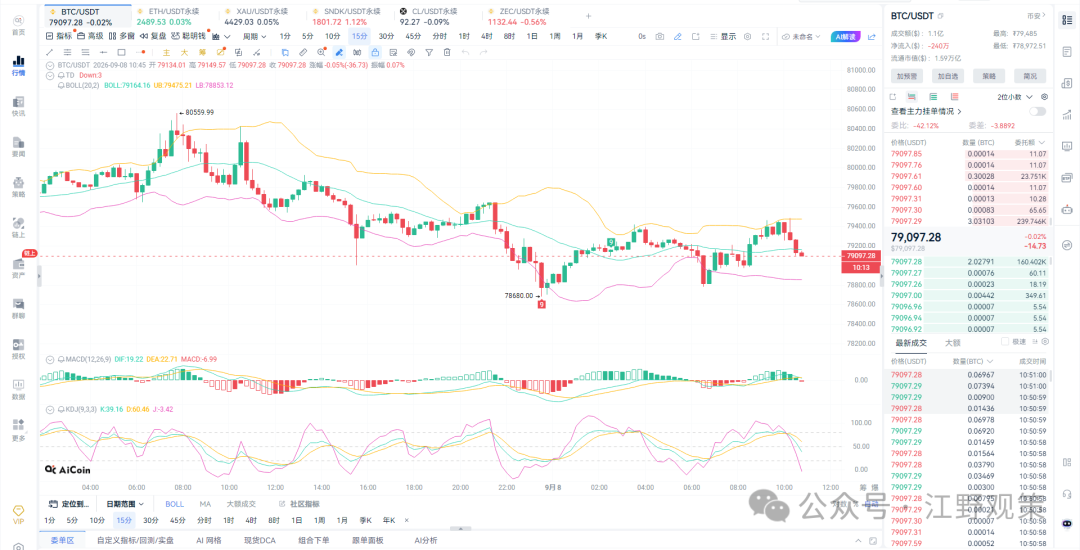
2. BTC Market Analysis: Bearish dulling but significant pressure above, first long then short intraday
Falling from a high of 82,280 to 78,649, now rebounding to around 79,280.
4-hour level: A small bullish candle with a long upper shadow, indicating certain selling pressure above 79,800. The MACD's DIF line is below the DEA, but the DIF is converging upwards, and the green volume histogram's negative value is shrinking, suggesting that bearish momentum is weakening, with a tendency to form a golden cross in the short term, indicating a possible rebound. The Bollinger bands at the daily level are beginning to narrow, which is a signal indicating a brewing large-scale market trend.
Key price levels:
Resistance: 79,800 → 80,500 → 81,500 (left shoulder pressure) → 81,800 → 82,800
Support: 78,649 (non-farm low) → 78,500 → 78,200 → 77,000
My judgment: BTC is currently in a repair phase after a major fall, with short-term rebound demand at the 4-hour level, but resistance remains heavy above at the daily level. The range from 81,500 to 81,800 is critical resistance from the previous left shoulder, serving as key resistance for this round of rebound. For real-time changes during the session, feel free to communicate and follow up together. safew, three lines jyx9188
Trading strategy:
Low Long
: If stabilizing on the pullback to the range of 78,500 to 78,200, feel free to take positions lightly for longs, stop-loss at 78,000, target 79,800 → 80,500.
High Short
: If rebounding to the range of 80,500 to 81,500 and stagnating, if a long upper shadow or engulfing bearish candle appears, try shorts lightly, stop-loss at 81,800, target 78,900 → 78,500 → 78,200.
Note
: Before the CPI data is released, do not chase shorts below 79,000, and do not chase longs above 81,000; operate within the range and exit when the target is reached.
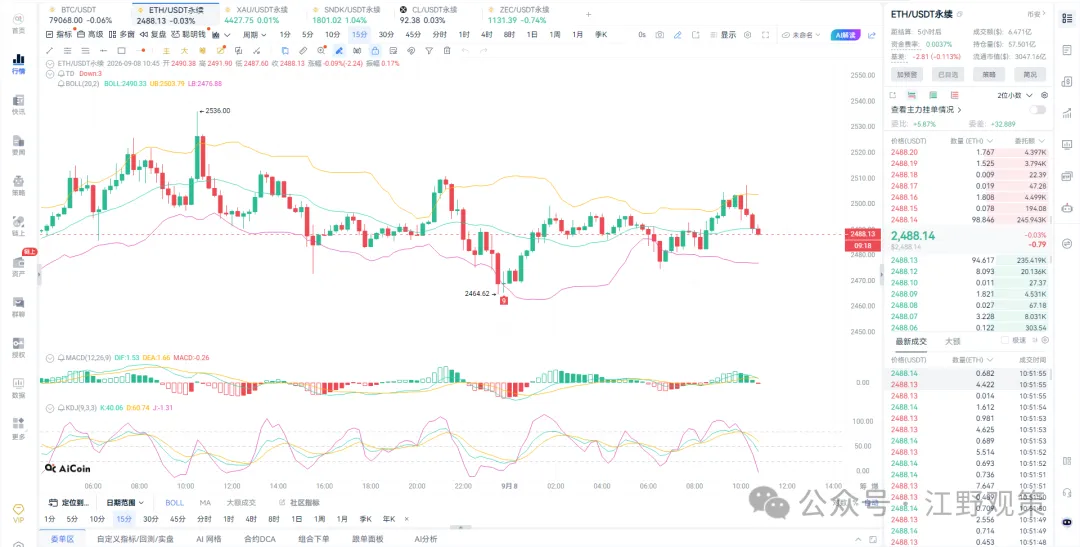
3. ETH Market Analysis: Range-bound at high levels is stronger than BTC, 2,545-2,558 is key resistance
ETH is currently around 2,498, with an overall trend being stronger than BTC, fluctuating back and forth at high levels without weakening like BTC.
4-hour level: High-level fluctuation pattern, prices are repeatedly moving within the range of 2,460 to 2,530. MACD's bearish momentum is weakening, showing signs of bottom divergence repair. If it can maintain support during U.S. trading hours, there is potential to reach higher, but longs need to set take-profit levels in advance due to heavy resistance above. For real-time changes during the session, feel free to communicate and follow up together. safew, three lines jyx9188
Key price levels:
Resistance: 2,530 → 2,545 → 2,558 (4-hour trend resistance) → 2,580 → 2,620
Support: 2,480 → 2,470 → 2,460 → 2,430
My judgment: ETH is currently in high-level oscillation, with no absolute advantage for either bulls or bears. The range from 2,545 to 2,558 is 4-hour trend resistance and key resistance for this round of rebound; 2,460 to 2,470 is short-term support, if broken would weaken the oscillation pattern.
Trading strategy:
Low Long
: If stabilizing on the pullback to the range of 2,470 to 2,480, feel free to take positions lightly for longs, stop-loss at 2,455, target 2,530 → 2,545.
High Short
: If rebounding to the range of 2,545 to 2,558 and stagnating, if divergence signals appear, try shorts lightly, stop-loss at 2,575, target 2,500 → 2,480 → 2,460.
Note
: ETH's volatility is greater than BTC's, so position sizes should be lighter, and stop-losses should allow enough room.
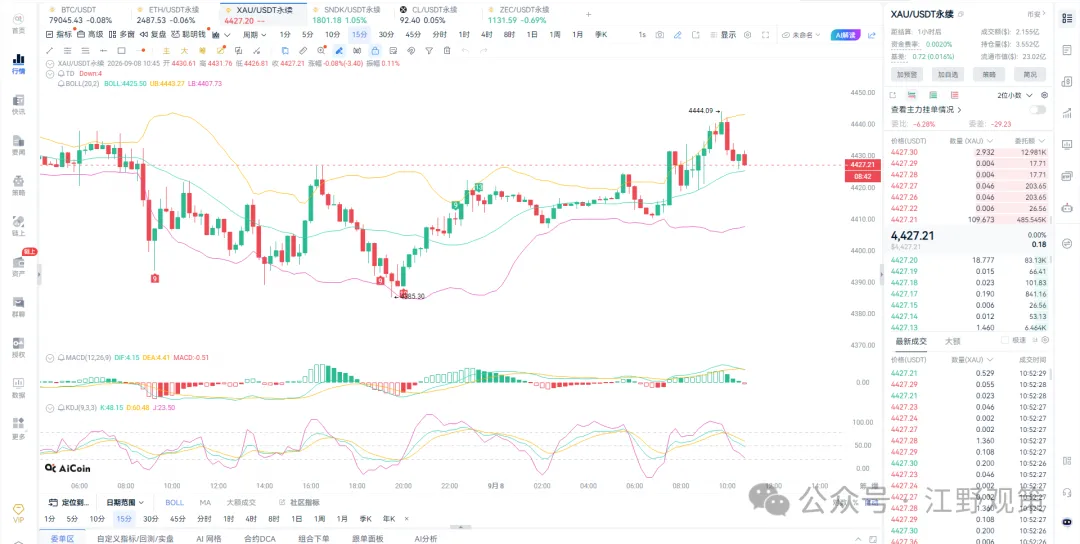
4. Gold Market Analysis: Is the breakout at 4,430 a bull trap or a real breakout? The 4-hour close will determine direction
Gold is currently around 4,434, having just broken the resistance level of 4,430. This position is critical and requires watching the 4-hour close to determine the direction.
Two scenarios:
If the 4-hour closes above 4,435
: Indicates there is still upward space, the short position should move up to around 4,480.
If the 4-hour closes below 4,435
: It indicates that the breakout is a false breakout, leading to a bull trap scenario, and one can directly short.
Overall structure: The residual heat of strong non-farm payroll data is still extending, the market adjusts upward the Federal Reserve's interest rate hike expectations, and U.S. Treasury yields remain high, with gold prices continuing in a pressure consolidation state. After the significant drop at the daily level, it has entered a restoration phase, with clear pressure from the moving averages above, and rebound strength is limited. The 4-hour cycle still belongs to a bearish repair structure, repeatedly encountering resistance as it tries to push higher.
Key price levels:
Resistance: 4,436 → 4,440 → 4,480
Support: 4,390 → 4,400 (short-term support moves up) → 4,365 (key low from non-farm data) → 4,348 → 4,356 → 4,316 → 4,321 (core support)
My judgment: Gold is still generally in a bearish fluctuation state, and the emphasis is on shorting during rebounds. The 4,430 level has just been broken but requires confirmation by the 4-hour close. Before the arrival of CPI data, big funds are inclined to observe, and the market is mostly in a fluctuation phase to digest, with mutual pulls between bulls and bears, making shakeouts more frequent. Do not let small bullish or bearish candles mislead the judgment of the larger trend. For real-time changes during the session, feel free to communicate and follow up together. safew, three lines jyx9188
Trading strategy:
High Short (Main Strategy)
: If the range of 4,436 to 4,440 is under pressure, one can directly short, stop-loss at 4,449, target 4,380 → 4,365 → 4,348.
If the 4-hour closes above 4,435
: Move the short position to around 4,480 to enter again, stop-loss at 4,495, target 4,430 → 4,400.
Low Long (only for super short-term support)
: If stabilizing on the pullback to the range of 4,390 to 4,400, one can lightly bet on a rebound, stop-loss at 4,375, target 4,430 → 4,436, in and out quickly.
Key Observation
: 4,365 is the key low from non-farm data; holding above this level would prolong the range-bound oscillation; once it effectively breaks below, it opens up further downside space.
5. Comprehensive Conclusion of Three Varieties’ Resonance
Variety | Current Price | Short-Term Trend | Core Resistance | Core Support | Main Operation Thought |
|---|---|---|---|---|---|
BTC | 79,280 | Repair after a big drop, bearish dulling | 80,500-81,500 | 78,500-78,200 | First long then short, operate within the range |
ETH | 2,498 | Range-bound at high levels, stronger than BTC | 2,545-2,558 | 2,470-2,460 | Low long and high short, exit when the target is reached |
Gold | 4,434 | Bearish oscillation, waiting for confirmation at 4,430 | 4,436-4,440-4,480 | 4,390-4,365 | Mainly short during rebounds |
Core Conclusions:
Macro bearishness but price resilience, signs of bearish dulling emerging
Indicates that there are real buyers supporting around the 80,000 dollar level, but this does not equate to a trend reversal.
Before CPI, range-bound oscillations are very likely
and a clean one-way movement will not occur; direction will be chosen after the data is released.
Operations should focus on ranges
: BTC first long then short, ETH low long high short, gold primarily short during rebounds.
All positions should be light, strictly implementing stop-losses
, and do not heavily bet on direction before the CPI data is released.
6. Summary of Key Price Levels
Variety | Strong Resistance | Resistance | Current Price | Support | Strong Support |
|---|---|---|---|---|---|
BTC | 82,800 | 81,800, 81,500, 80,500 | 79,280 | 78,649, 78,500, 78,200 | 77,000 |
ETH | 2,620 | 2,580, 2,558, 2,545 | 2,498 | 2,480, 2,470, 2,460 | 2,430 |
Gold | 4,480 | 4,440, 4,436 | 4,434 | 4,400, 4,390, 4,365 | 4,348, 4,321 |
Summary: Strong non-farm payrolls + high oil prices = macro bearishness, but BTC stabilizing at the 80,000 level indicates bullish dulling, suggesting support below. This Friday's CPI is a decisive event, with a high probability of range-bound fluctuations before the data. In terms of trading: BTC low long at 78,500-78,200, high short at 80,500-81,500; ETH low long at 2,470-2,480, high short at 2,545-2,558; gold high short at 4,436-4,440, light long at 4,390-4,400. Use light positions and strict stop-loss before CPI, adjusting in tandem after the data is released.
⚠️ Risk Warning: The above content is only a technical analysis of the market for reference and communication only, and does not constitute any investment advice. The financial market is highly volatile, and contract trading involves extreme risks; please trade rationally, strictly control positions, and set stop-losses, with profit and loss borne by yourself.
Thank you to all family members for your trust and companionship. The market changes rapidly, and steady compounding is the way to long-term success. I am Jiang Ye, see you next time.
For real-time changes during the session, feel free to communicate and follow up together. safew, three lines jyx9188

免责声明:本文章仅代表作者个人观点,不代表本平台的立场和观点。本文章仅供信息分享,不构成对任何人的任何投资建议。用户与作者之间的任何争议,与本平台无关。如网页中刊载的文章或图片涉及侵权,请提供相关的权利证明和身份证明发送邮件到support@aicoin.com,本平台相关工作人员将会进行核查。