Cryptocurrency Scholar: The high-level fluctuations of Ethereum (ETH) at 9.7 are not a pause; is Ethereum completing a major chip cleansing? Latest market analysis reference
The current price of Ethereum is 2490, and the market has again fallen into a painful stalemate. Many friends are very conflicted now; they fear being stuck at the peak if they chase high, while shorting risks being caught off guard by a surge that wipes out stop losses, being whipped back and forth by the market. Many people are always thinking about catching a big rise or fall all at once, but neglect the fact that we are currently in a stage of oscillation and grinding. The major trend reversal at the bottom has been confirmed, but in the short term, there will not be a one-sided and reckless rise.
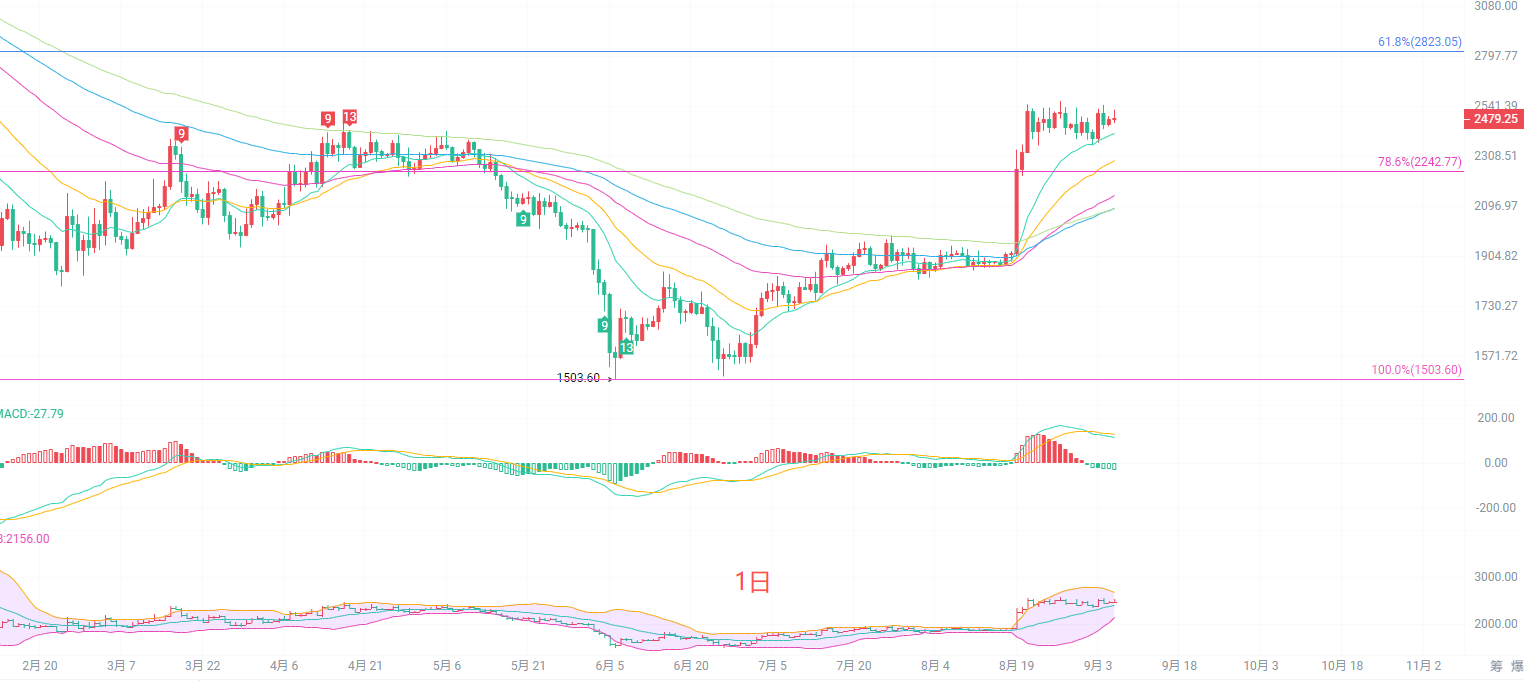
All EMA lines on the daily K-line have turned upwards, and the medium to long-term moving averages have formed support, establishing a bullish structure for the larger cycle. The Bollinger Bands are opening upwards, and the price is running near the upper band, with strong resistance looking towards the 28232932 range above. The MACD indicator's red bars are continuously shrinking, and both the DIF and DEA are still maintaining above the zero axis, indicating a weakening of bullish momentum with signs of a top divergence. The key support below is 2242, which is an important threshold for this round of rebound. As long as this level is not effectively broken, the daily K-line's upward structure will not be damaged. The short-term market has entered a high-level oscillation to digest profit-taking, and the difficulty of a direct significant surge is relatively high, with a high likelihood of maintaining a repeated oscillation to wash out traders.
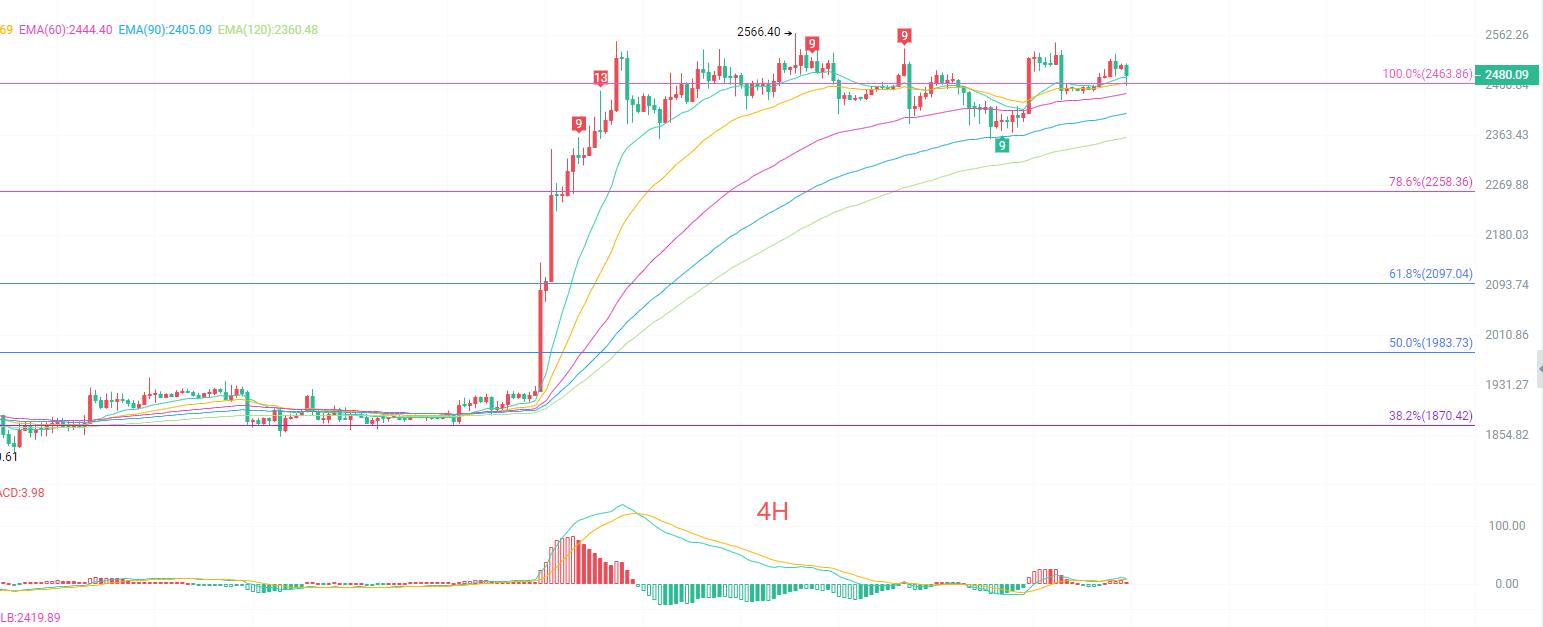
In the four-hour K-line, the short-term EMA moving averages are intertwined and flat, with bullish and bearish forces tending to balance. The Fibonacci 100% position at 2463 has become short-term support, with the price repeatedly testing above this level. The Bollinger Bands are constricting, and the volatility range is beginning to narrow, indicating that the market is about to choose a direction. The MACD is above the zero axis, with weak red bars, indicating insufficient bullish momentum for upward attacks, and after several attempts, there is a lack of strength to refresh high points. The upper pressure point is 2566, which is the recent rebound high, and only a firm hold here will open up a new round of upside space. The core support below is 2258; if broken, it will trigger a deep correction in the short term. The four-hour level belongs to a high-level oscillation pattern, with no clear one-sided signals, making it unsuitable for chasing positions; it is more prudent to wait for break confirmation before following along.
Short-term reference:
If it does not break below 2430 to 2400, go long, stop loss 40 points, target 2550 to 2630.
If it stalls and goes south from 2560 to 2566, stop loss 40 points, target 2460 to 2360.
Specific operations should primarily refer to real-time data from the market. For more detailed information, please consult the author. There may be delays in article publication; it is recommended for reference only, and the risk is borne by the reader.

Friendly reminder: The above content is solely created by the author's public account. The ads in the comments section and at the end of the article have no relation to the author. Please discern carefully. Thank you for reading.
免责声明:本文章仅代表作者个人观点,不代表本平台的立场和观点。本文章仅供信息分享,不构成对任何人的任何投资建议。用户与作者之间的任何争议,与本平台无关。如网页中刊载的文章或图片涉及侵权,请提供相关的权利证明和身份证明发送邮件到[email protected],本平台相关工作人员将会进行核查。