Dear teammates, good weekend. This morning's focus news is very interesting, with long and short signals fighting fiercely. On one side, the net inflow of Bitcoin spot ETF in a week has approached 1 billion US dollars, showing a strong willingness of institutional funds to enter the market, which is a solid buying force. On the other side, CME data shows that the probability of the Federal Reserve raising interest rates by 25 basis points in September has risen to 59.4%, and the expectation of tightening liquidity hangs like a sword above us. Additionally, the ancient giant whale that has been dormant for 12.8 years suddenly awoke, transferring 202 BTC and making profits of millions, which always raises concerns in the market due to the unusual activity of these low-cost chips. News is torn, but the technical aspects provide a relatively clear path; let's look at the data directly.
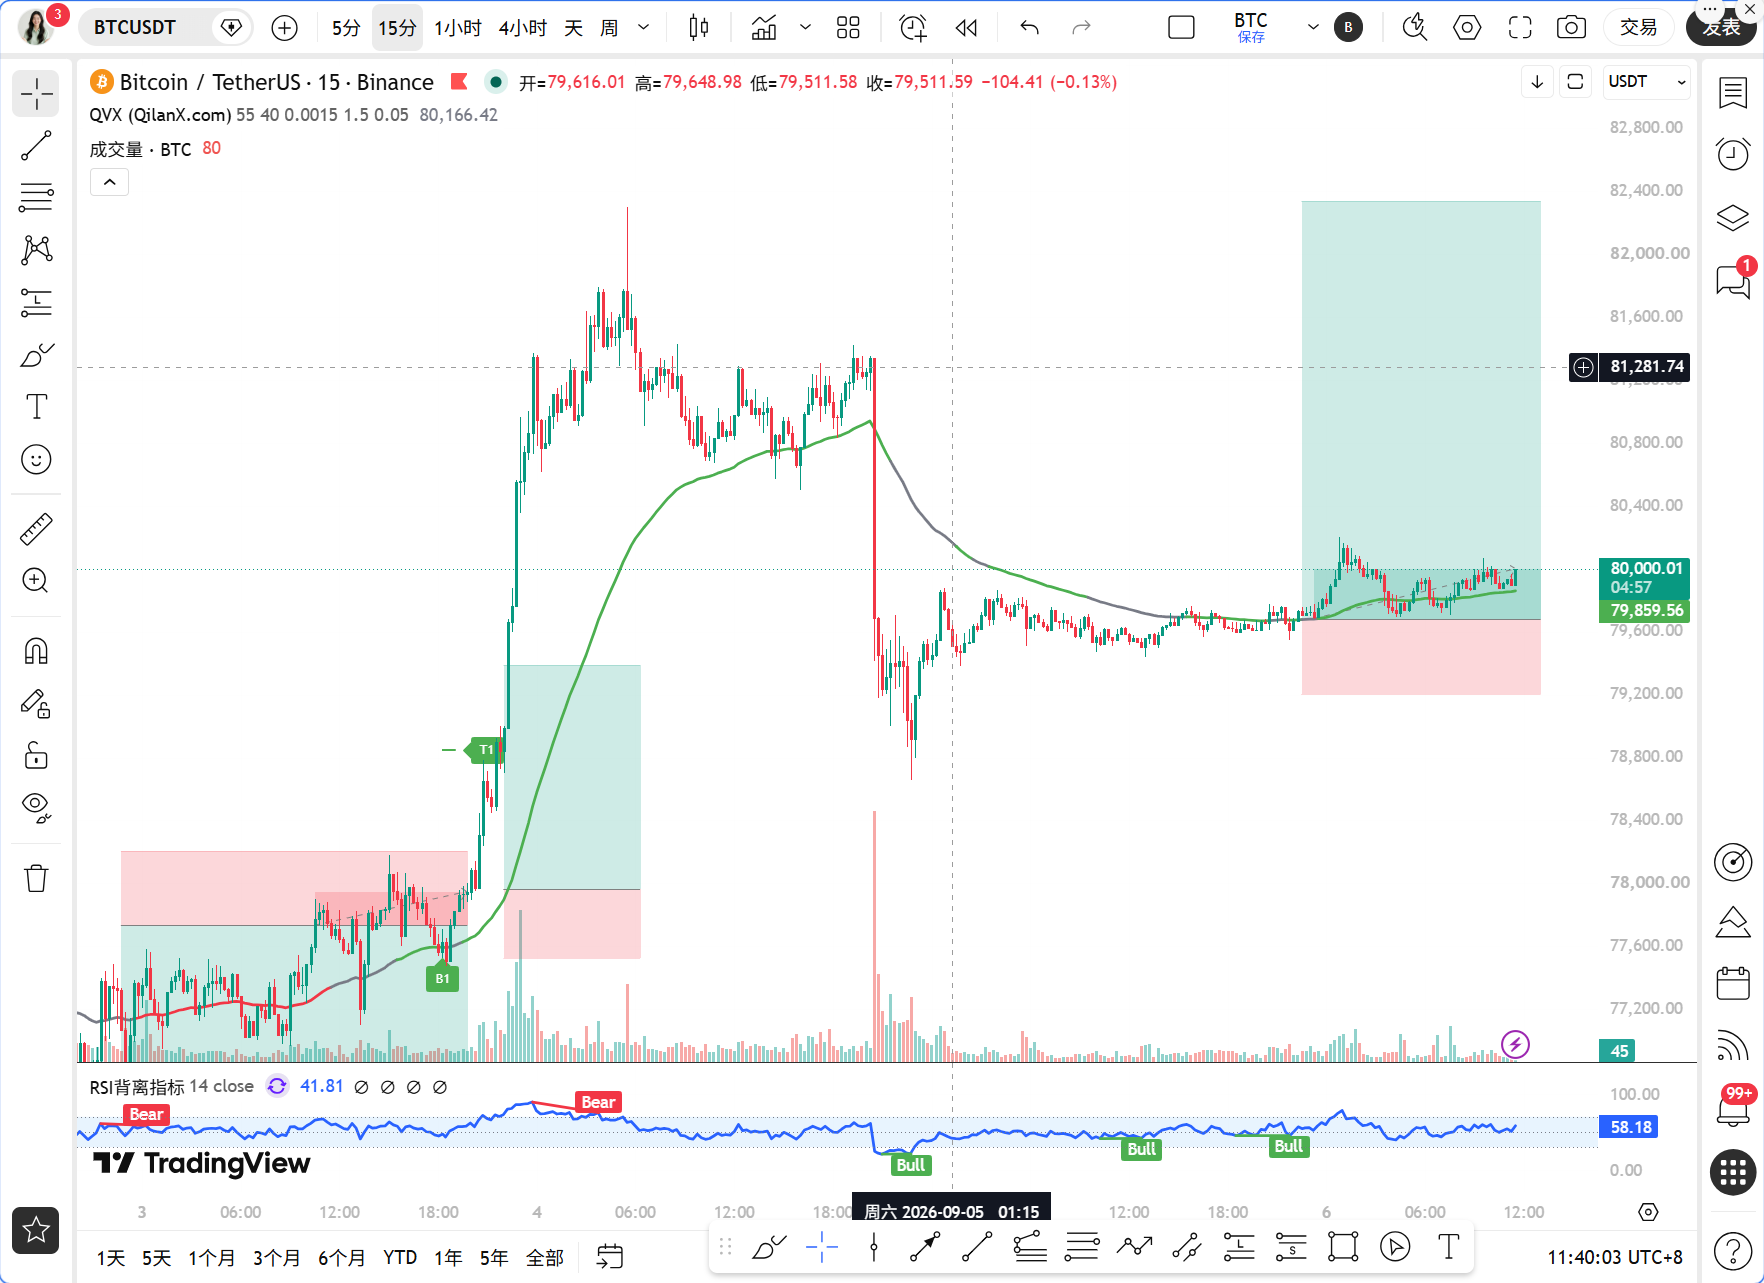
The current time is September 06, 11:40, with Bitcoin quoted at 80010 USDT, a 24-hour increase of 0.39%. The price has once again surpassed the psychological level of 80,000, but whether it can hold that level depends on subsequent volume cooperation. This position is delicate; one step up means endless opportunities, while one step down could lead to the bears' sorrow.
First, let's look at the larger cycle. On the daily level, MA5 is at 79622, MA10 at 78789, and MA30 at 72763, with the moving average system still presenting a standard bullish arrangement, keeping the price above all the moving averages. However, the MACD is negative at 164, indicating signs of a dead cross in the high area for DIF and DEA, while RSI at 57.7 is neither overbought nor strong; the daily level is in a high-level oscillation stage. The 4-hour level requires more caution, with MA5 and MA10 entangled around 79800. Although the MACD is negative at 62.7, DIF has begun to turn upward, showing signs of repair; RSI at 31.7 indicates an initial rebound from the oversold area. The 1-hour level is currently the clearest, with MA5 at 79913, MA10 at 79875, and MA30 at 79739, all moving above the price, with MACD positive at 23.5, DIF above DEA, and RSI at 64.4, indicating strong short-term momentum. The 15-minute level just formed a golden cross, with a bar value of 3.9, indicating a short-term impulse.
Next, let's verify the signals using the Qinglan TPV system. The core rule is the 1-hour EMA55, currently at 79691. In the last eight 1-hour K lines, the closing price greater than EMA55 occurred 8 out of 8 times, with zero crossings, and the price is 0.4% away from EMA55, which does not meet the definition of an oscillation range, belonging to a one-sided trend area. Continuous closing prices above EMA55 meet the first condition for going long. Looking at the support stability pattern, the 1-hour level has not shown classic pullback actions like long lower shadows or bottom formations; instead, it has directly surged and broken through, which is a characteristic of strength. In terms of momentum, the 1-hour MACD bars have consistently been positive without significant shortening, and RSI around 64 has not entered the overbought zone, indicating that upward momentum is still present. Thus, the TPV system indicates a bullish signal at the 1-hour level, but caution is needed since the 4-hour MACD bar remains negative, indicating that larger-scale momentum hasn't fully reversed; this bullish signal belongs to a smaller level leading to a larger level repair phase.
On-chain data shows the fear and greed index at 73, which is in the greed zone, indicating that market sentiment is somewhat heated; in such a situation, one should maintain a level of clarity. Bitcoin's market share is at 59.23%, still at a high level, indicating that capital is still rotating within BTC, with a lesser bloodsucking effect from altcoins. The continuous inflow of ETF funds is the strongest supporting logic in the medium term, but in the short term, one should be cautious of a pullback risk after a good news fulfillment. That giant whale transferred 202 BTC, and although it may not sell immediately, the loosening of chips on-chain will increase short-term uncertainty.
To look at key attack and defense levels based on some numbers. The first resistance level above is 80500, which is the area of the previous rebound high point. If it breaks and stabilizes, the bulls will test the range from 81500 to 82000. The first support below is at 79691, which is the position of the 1-hour EMA55. This level serves as the dividing line between bulls and bears; as long as the price does not effectively fall below this point, the short-term bullish structure remains. The second support level is 79200, located near the 4-hour MA30; if it falls here, it would indicate a failure of the 4-hour recovery. If the price exceeds 80500 with volume, the short-term target could be set at 81500.
As for trading strategies, Qinglan has provided two proposals. For trend-following long positions, the direction is to buy on dips and not chase highs. Entry conditions are to look for the price to pull back to the range of 79691 to 79800, close to the 1-hour EMA55. If a bottom formation or long lower shadow appears on the 15-minute level and the MACD bars shorten, one can cautiously enter a position. Set a stop-loss below 79200, which is below the 4-hour MA30; if it breaks, it indicates the bullish structure is damaged. The first target is 80500, and after a breakout, aim for 81500. If the price breaks through 80500 with volume directly, one can chase a long position, but stop-loss should be tightened below the 80000 integer level. The other proposal is a defensive short position, with the prerequisite that the price effectively falls below 79691 and two consecutive 1-hour closing prices are below EMA55; one can then turn to a short position, with a stop-loss set above 80500, targeting 79200 or even 78500. Currently, the probability of going long appears higher than going short, as the small-level trend is upward.
Risk warning in one sentence: The probability of the Federal Reserve raising interest rates in September exceeds 59%, which is the biggest negative looming overhead; any minor shift could provoke severe fluctuations, so it is vital to manage positions well and strictly enforce stop-losses.
Follow Qinglan's crypto classroom to seize more trading opportunities! Welcome to visit the official website www.qinglan.org
📊 Qinglan TPV trading strategy backtest reference
🕒 Last backtest time 09-06 07:00:02
Total analysis: 3859 Backtest: 3855 Accuracy rate: 79.1% (3048/3855)
免责声明:本文章仅代表作者个人观点,不代表本平台的立场和观点。本文章仅供信息分享,不构成对任何人的任何投资建议。用户与作者之间的任何争议,与本平台无关。如网页中刊载的文章或图片涉及侵权,请提供相关的权利证明和身份证明发送邮件到[email protected],本平台相关工作人员将会进行核查。