I. Multi-Cycle Market Breakdown
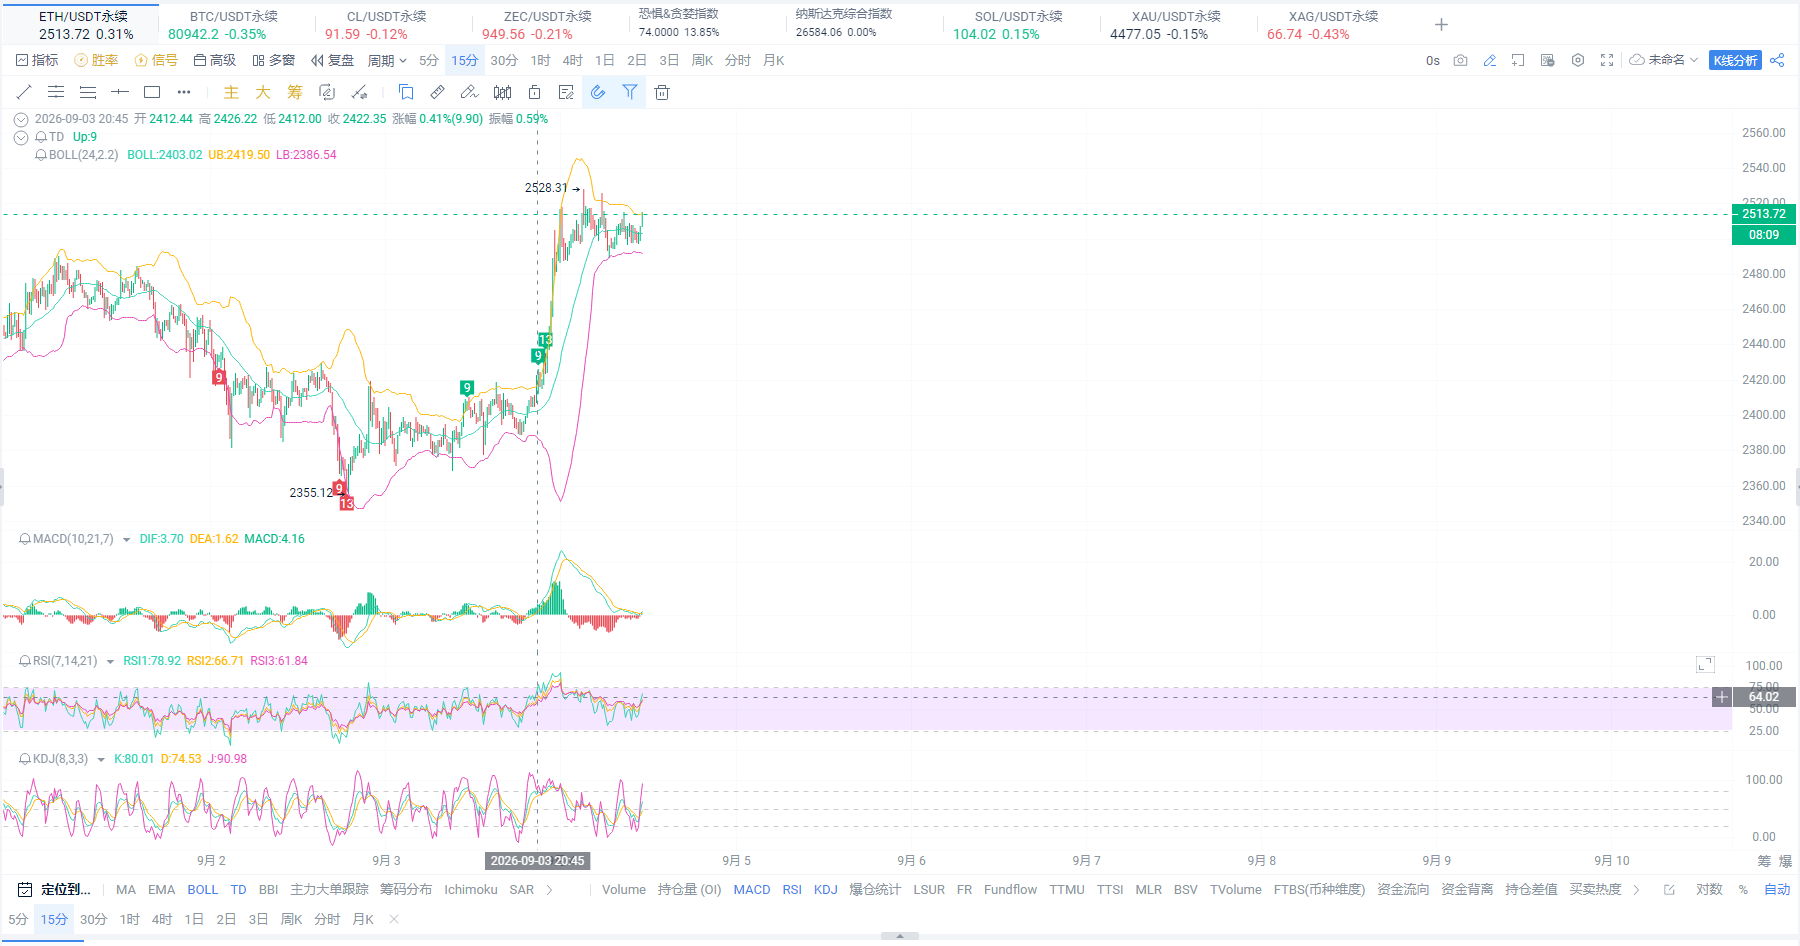
15-Minute Chart (Short-Term Sentiment)
Price violently surged from 2355 to a peak of 2528.31 before slightly retracing, currently around 2513.
TD Series Up:9 —— The upward count has reached the reversal threshold, and the probability of a short-term pullback is extremely high.
RSI1=78.92 has entered the overbought zone, KDJ J=90.98 is severely overbought, K/D are adhering in the high 80s.
MACD Red Bar 4.16 is still expanding, but the price has moved far from the Bollinger upper band (2419), and the divergence is excessive.
Conclusion: Short-term is severely overbought, chasing long positions is equivalent to catching falling knives; must wait for a pullback.
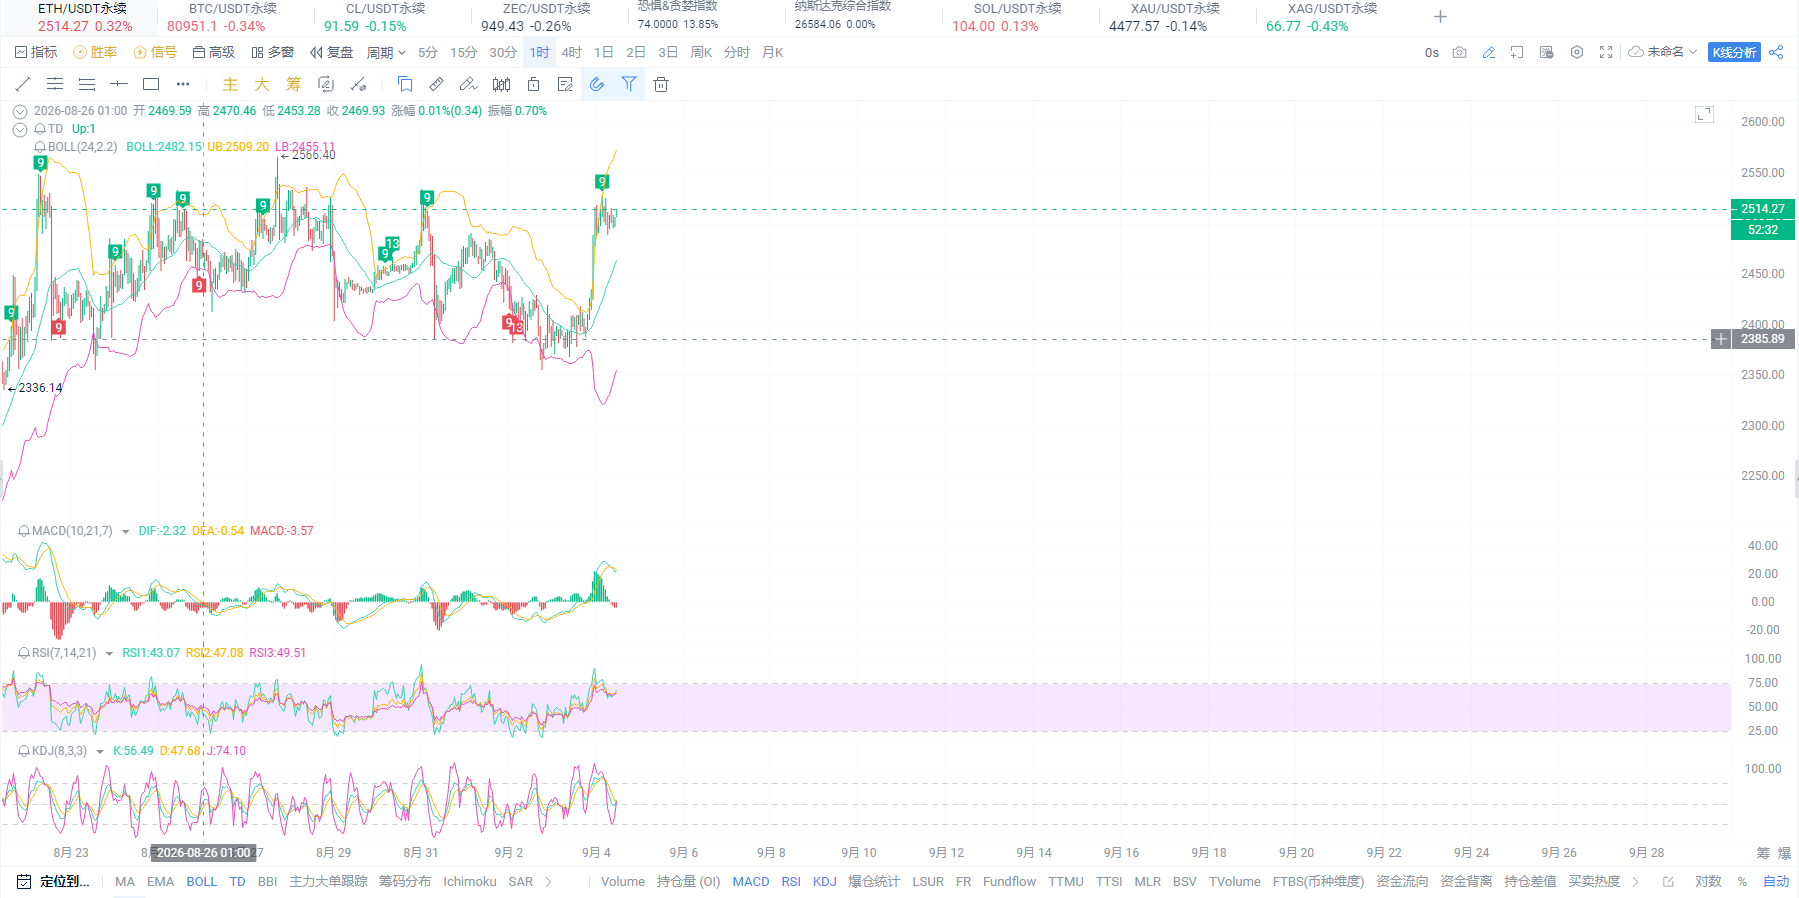
1-Hour Chart (Medium-Term Direction)
Price has just broken through the Bollinger upper band at 2509, standing above the 2500 whole number mark.
MACD Green Bar continues to shrink (-3.57), DIF -2.32 is about to cross above DEA, golden cross is imminent.
KDJ Golden Cross Upwards, K 56 / D 47 / J 74, bulls have just started and not yet reached overbought.
RSI is neutral bias towards bullish at 47-50, still has upward space.
Conclusion: The 1-hour level rebound structure is healthy, and a pullback is an opportunity to go long.
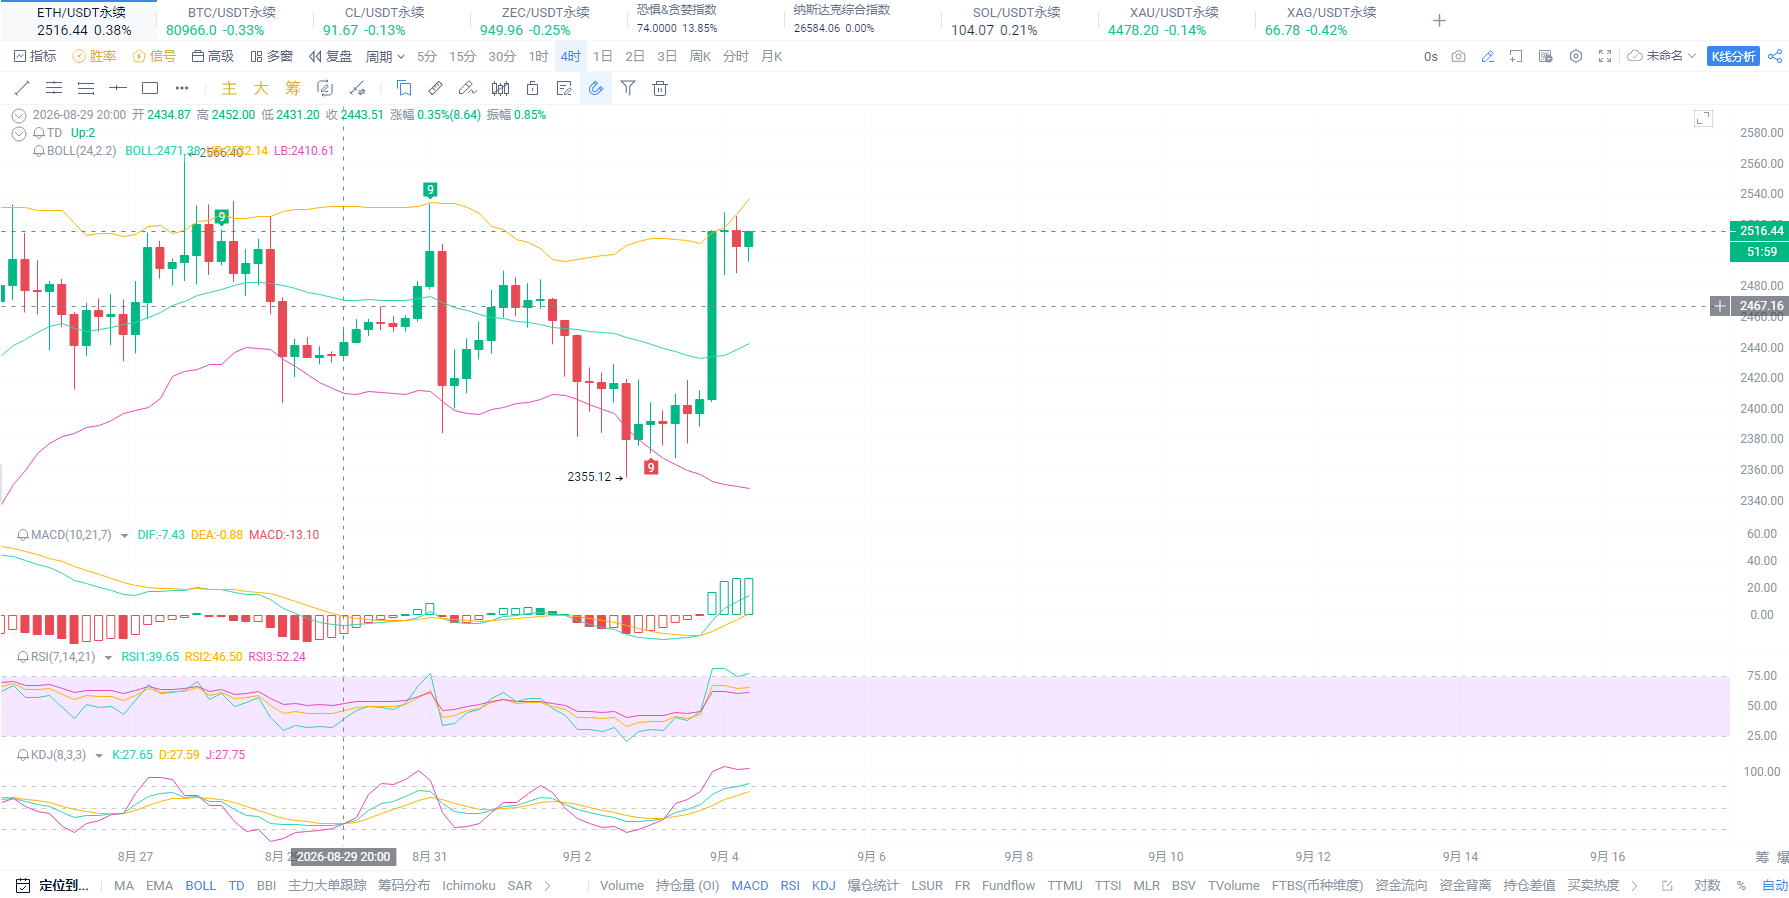
4-Hour Chart (Large Scale Trend)
A large bullish candle surged from 2355 to above 2500, directly breaking the Bollinger middle band at 2471.
KDJ Low-Position Golden Cross (K 27 / D 27 / J 27), large-scale rebound has just started.
MACD Green Bar - 13.10 but DIF has turned, strong expectation for a golden cross below the zero line.
The Bollinger upper band at 2562 is the next target level.
Conclusion: 4-hour level bottom reversal confirmed, trend is biased towards bullish.
II. Key Price Level Map
Table
Type | Price Level | Description |
|---|---|---|
Strong Resistance | 2560-2562 | 4-Hour Bollinger upper band, medium-term target |
Resistance | 2528-2530 | 15-Minute previous high, short-term pressure |
Current Price | 2513-2516 | — |
Weak Support | 2495-2500 | Whole number mark + 1-Hour breakout backtest |
Strong Support | 2470-2482 | 4-Hour Bollinger middle band + 1-Hour Bollinger middle band resonance |
Extreme Support | 2450-2455 | 1-Hour Bollinger lower band; a drop below means failed rebound |
III. Specific Trading Plans
Plan A: Go Long on Pullback (Recommended, in line with the main trend)
First Entry Zone: 2495-2500
Position: 30%
Stop Loss: 2478 (break below the 1-hour middle band, loss about 17-22 points)
Take Profit 1: 2528 (previous high, about +28 points)
Take Profit 2: 2560 (4-hour upper band, about +60 points)
Second Entry Zone: 2470-2480 (if a deeper pullback)
Position: Increase to 50%
Stop Loss: 2455 (below the 4-hour middle band, loss about 15-25 points)
Take Profit 1: 2528
Take Profit 2: 2560-2580
Logic: 15-Minute overbought pullback is inevitable, but the 1-Hour and 4-Hour bullish structure has just started; a pullback to support levels presents a buying opportunity. 2500 is a psychological level + breakout backtest point, with the best cost-performance ratio.
Plan B: Short-term Peak Short (Aggressive, only for short-term)
Entry Zone: 2525-2530 (near previous high)
Position: ≤20%
Stop Loss: 2542 (break above previous high by 12 points, loss about 12-17 points)
Take Profit 1: 2500 (whole number mark, about -25 points)
Take Profit 2: 2482 (1-hour middle band, about -43 points)
Logic: 15-Minute TD9 + overbought; near the previous high of 2528, there is a need for a pullback. However, this is counter to the main trend, so positions must be light and stop losses strict; if it pulls back near 2500, exit without greed.
Plan C: Follow Long After Breakout (After Confirmation)
Trigger Conditions: 1-hour closing price stabilizes above 2530
Entry: 2530-2535
Stop Loss: 2510 (below the previous high during a pullback, loss about 20-25 points)
Take Profit: 2560-2580
IV. Risk Control Reminder
Current position at 2513 does not recommend opening new positions —— 15-Minute overbought + TD9, awkward in both directions; wait for pullback or breakout before acting.
Total position for longs should not exceed 50%; although a 4-hour reversal is occurring, MACD still remains below the zero line, indicating a rebound rather than a trend reversal.
Shorts limited to short-term only; going short against the 1-hour / 4-hour bullish structure carries high risk, and stop losses must be strict.
If it drops below 2450, it indicates a failed rebound in the 4-hour; all long positions should stop loss and exit, reassess.
If a breakout above 2562 occurs, breaking the 4-hour Bollinger upper band means looking towards 2600+, which can be followed long.
In summary: The major trend rebound has just started, and the short-term overbought condition needs a pullback. Go long near 2500, short near 2528, with 2470 being a lifeline for both bulls and bears, and 2562 as a medium-term target.
The above is a technical analysis and does not constitute investment advice; contract trading carries high risks, please strictly control the position.
safew/X:ETHxx1207
免责声明:本文章仅代表作者个人观点,不代表本平台的立场和观点。本文章仅供信息分享,不构成对任何人的任何投资建议。用户与作者之间的任何争议,与本平台无关。如网页中刊载的文章或图片涉及侵权,请提供相关的权利证明和身份证明发送邮件到[email protected],本平台相关工作人员将会进行核查。