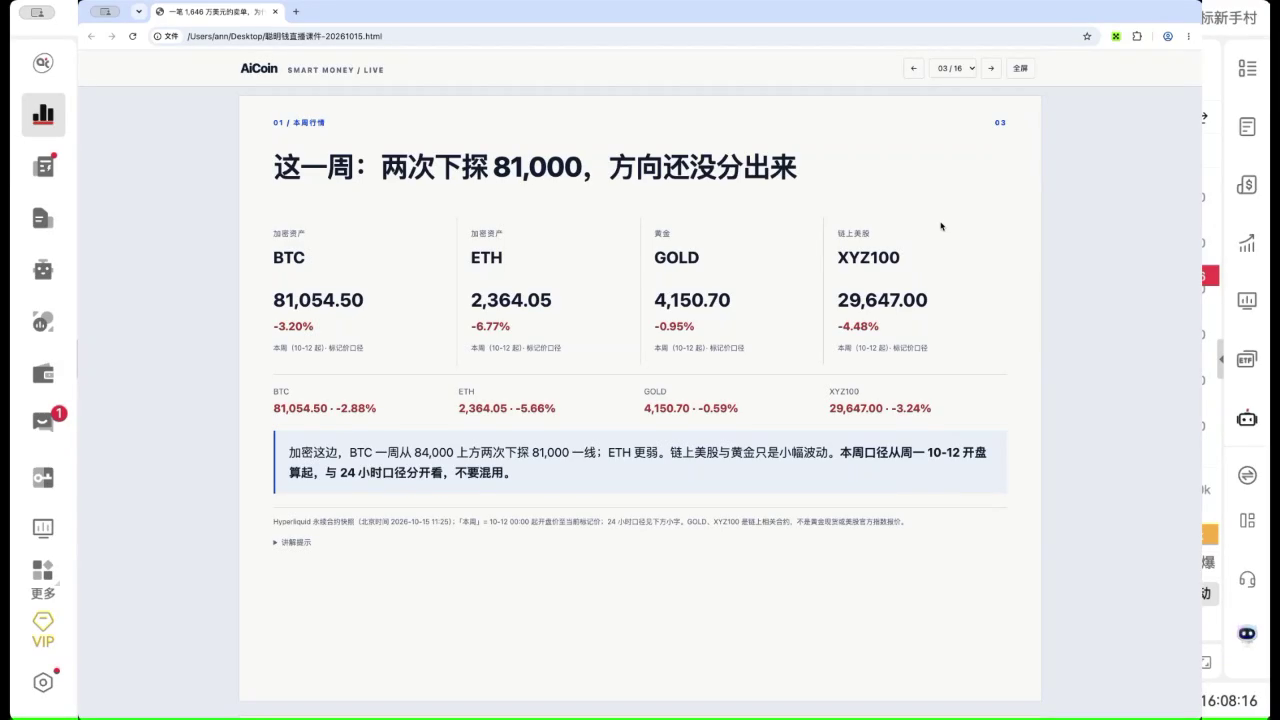
This week, friends who placed orders, did you make a profit or a loss? To be honest, the market this week is really hard to judge. Last week we mentioned that the market has not yet chosen a direction, so don’t rush to place orders. A week has passed, and BTC is still fluctuating between 76,000 and 79,000, not rising far nor falling away. Therefore, last week's conclusion still applies this week — just wait.
The actions of large on-chain holders are quite mixed. Most long holders who entered at low levels are holding on without selling, indicating they are not worried about the medium-term trend; the short sellers who made money a few days ago have already closed most of their positions, which shows they also don’t dare to short heavily. Yet, around the vicinity of 78,000 USD, new short positions are piling up. With longs not backing off and shorts not giving way, the market is stuck in the middle, unable to move up or down.
Today's core point is to clarify this matter: right now, it’s neither a clear bull market nor a clear bear market. If you want to place directional trades, you can continue to wait; if you feel the urge to participate, a range grid is more suitable for the current market conditions than chasing the price up and down.
The conclusion hasn’t changed, but that doesn’t mean there’s nothing new this week. Last week we could only see a standoff between bulls and bears, but this week we can see how large holders are handling this range: some are holding without selling, some have adjusted their holdings and changed assets, and others are taking profits from short positions before trying to short again at the top of the range. Although no clear direction has emerged, positions are quietly adjusting, and that’s the most notable part today.
So now, if you see a bullish candle, don’t rush to chase it; and if you see a bearish candle, don’t immediately chase the short. Unless BTC truly breaks out of the range between 76,234 — 79,250 USD, any price moves inside are likely just back and forth fluctuations.
The "true breakout" I’m referring to is not just a price spike that lasts a few minutes. A more stable judgment criterion is: whether the hourly K-line can close outside the range without immediately falling back, while the trading volume is significantly increased compared to the current level. Only when both price and volume move together does a breakout seem driven by someone actively pushing the market, rather than just short-term stop-loss liquidation.
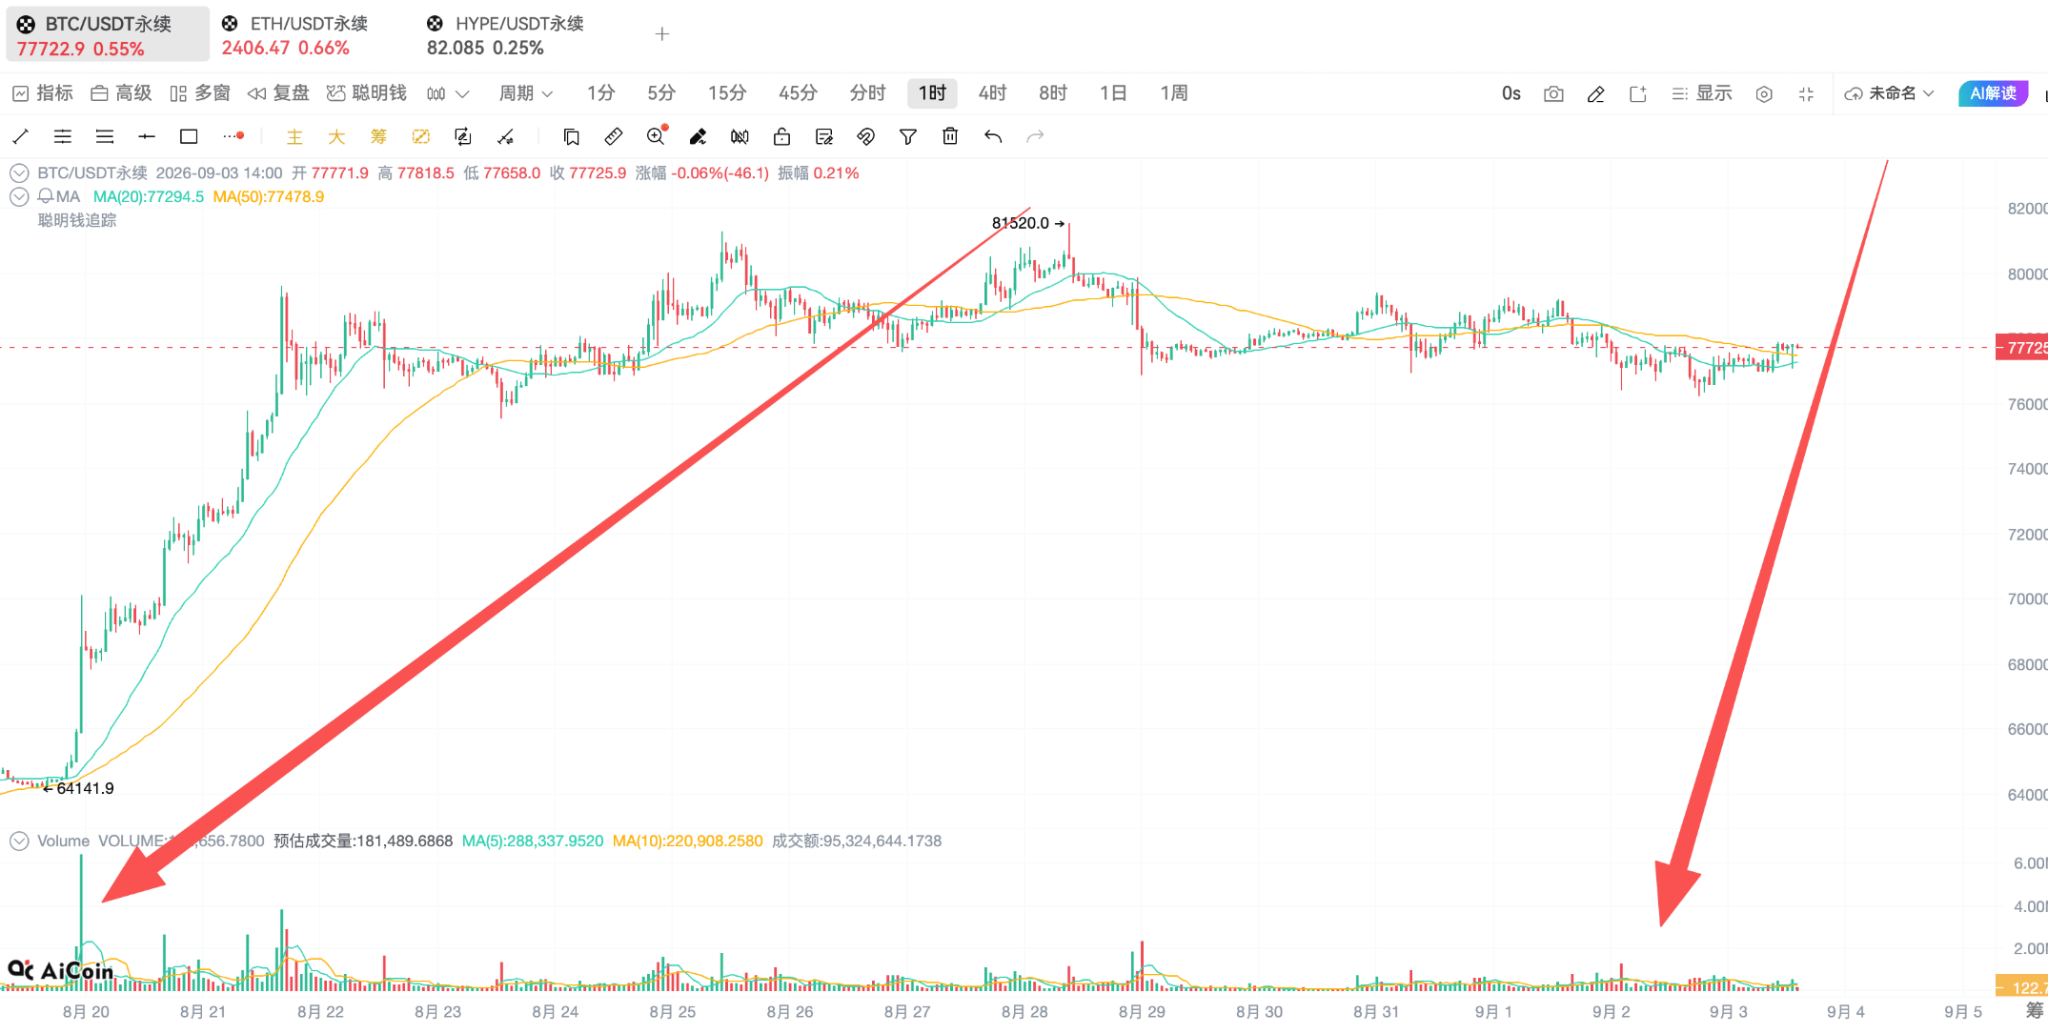
If the price wants to establish a trend, someone needs to invest real money into it. The current problem is the trading volume of the recent complete hourly K-lines is woefully low. BTC is around 37% of the average trading volume over the past 20 hours, ETH is about 31%, and HYPE is only 29%. It looks like the price has rebounded, but the volume hasn't matched up. Compared to the previous rally, trading volume has significantly dwindled. Coupled with the recent pressure in the US stock market and a decline in risk appetite affected by US bonds, it’s not really a suitable time to enter the market. At least up until now, there hasn’t been a significant influx of capital rushing in to buy. To confirm a new trend, it’s best to wait for a significant increase in trading volume alongside the price breaking out of the range.
Next, looking at the funding rate, BTC and ETH are positive, meaning that longs are paying shorts; HYPE's funding rate is slightly negative, indicating that shorts are paying longs. The fact that the three markets haven’t even aligned on their holding costs further shows that it’s absolutely not a coherent one-sided market at present.
We surveyed 120 candidate accounts, with 25 holding BTC positions, among which 9 are long and 16 are short. Focusing on the accounts that have made a profit over the last week and month, there are a total of 10 — 3 are long and 7 are short. There are indeed more shorts, but that doesn’t mean the market has turned bearish. Because on the flip side, low-cost longs are still holding their positions firmly, and accounts that previously had heavy short positions are also closing many of them. To put it more accurately: there are sellers willing to sell above 78,000 USD, while there are buyers willing to step in around 76,000 USD, keeping the price stuck in between. The smart money hasn’t come to a unified conclusion, and it’s telling us with their positions that this is temporarily just a sideways range. It’s not surprising that even the on-chain whales are confused; it’s natural for everyone to be puzzled.
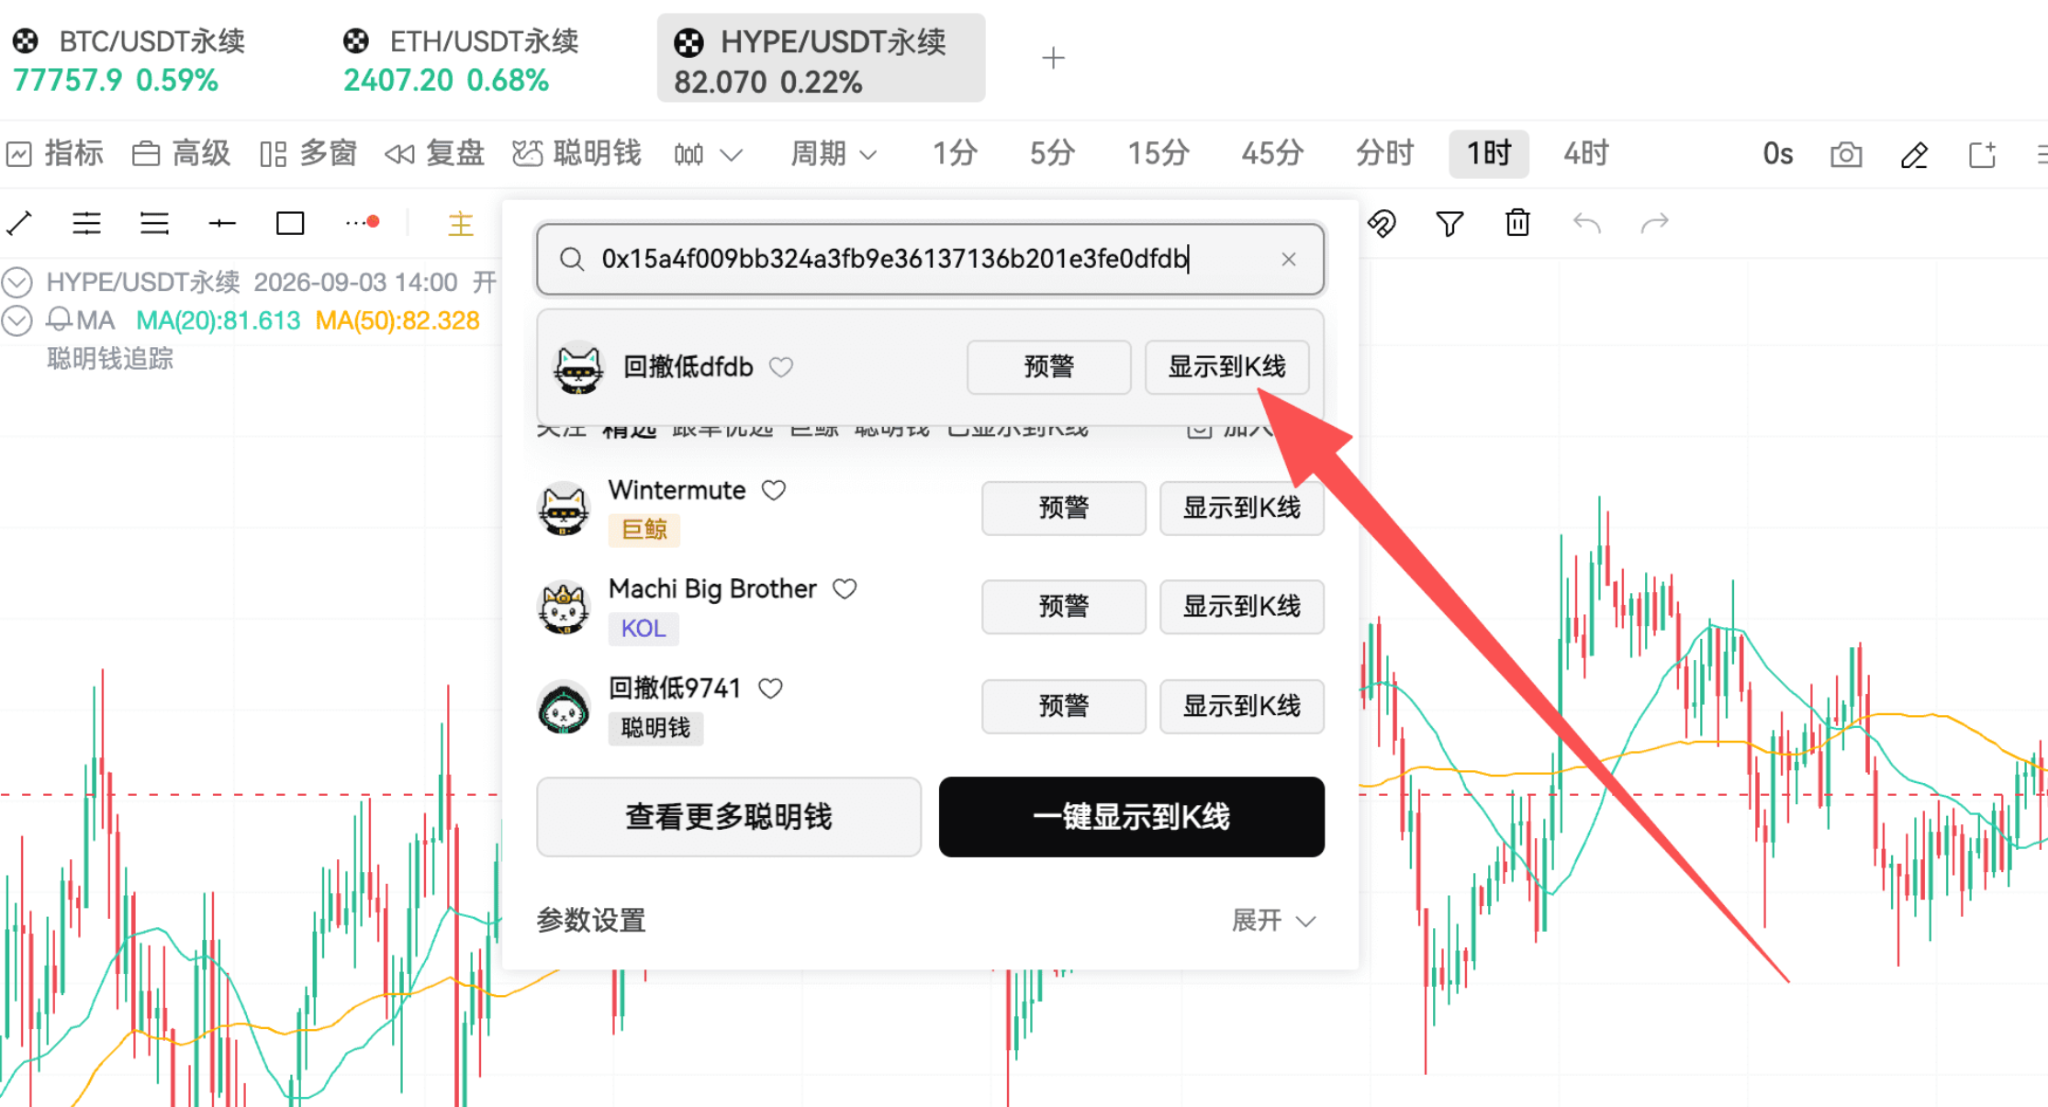
First, let’s look at a steadfast long holder. The complete address is 0x15a4f009bb324a3fb9e36137136b201e3fe0dfdb, and you can copy this address into smart money platforms to see its position changes on the K-line.
Last week it held 1,000 BTC long positions and 10,000 ETH long positions, and this week there hasn’t been any movement. BTC has an average cost of about 62,354 USD, and the current value of this position is around 77.65 million USD, with an unrealized profit of about 15.29 million USD; ETH has an average cost of about 1,762 USD, and the position value is about 24.01 million USD, with an unrealized profit of about 6.39 million USD.
They entered the market at the bottom and have completely refrained from trading recently. This account has lost about 2.13 million USD on paper in the past week, mostly due to profit withdrawal, but in the past month, it still made about 19.09 million USD. They haven’t traded at all for a whole month, haven’t added to or reduced positions, just holding onto what they have.
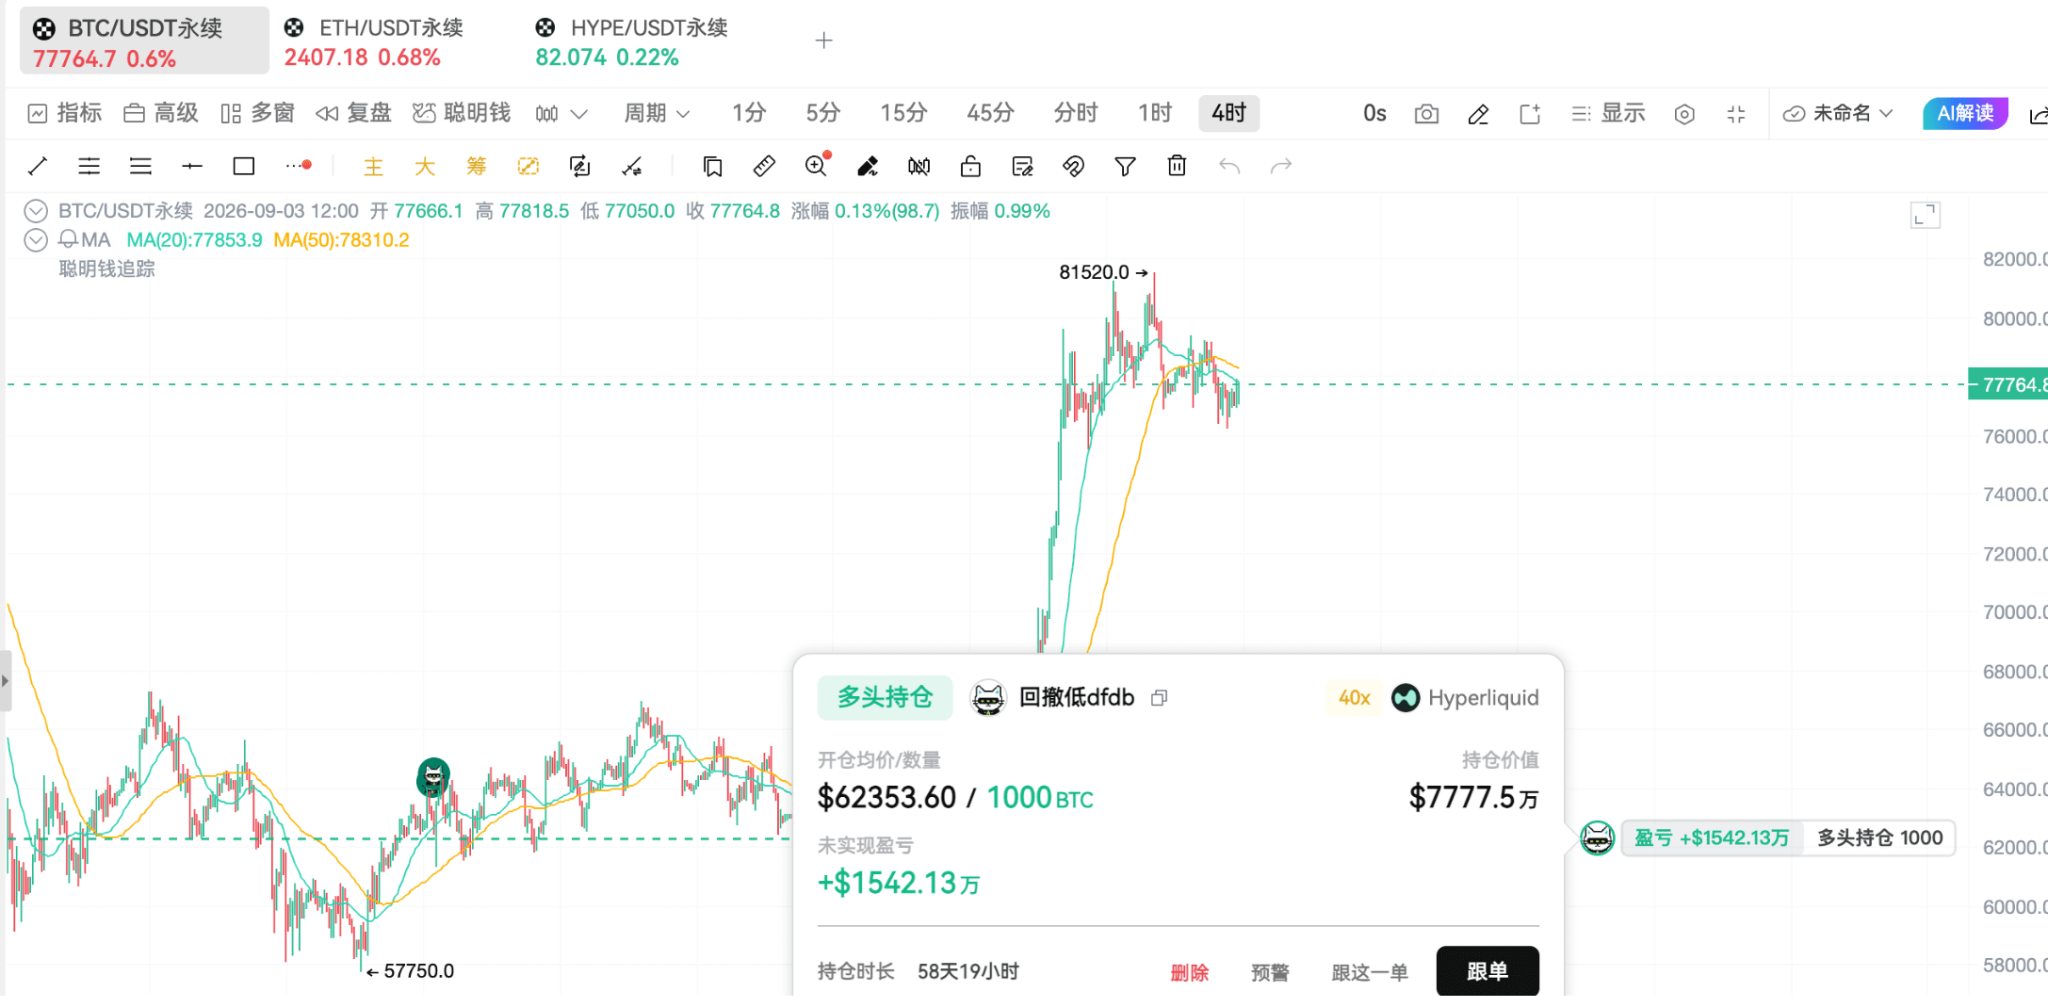
If BTC returns to around 76,000 USD and they still don’t move, it indicates that they are willing to endure the fluctuations with this low-cost long position; if it suddenly drops from 1,000 to a few hundred, then that would indicate a change in attitude. The only thing we can confirm right now is that this long holder hasn’t exited the market during this week’s sideways action. Bullish individuals can closely monitor this address, as it represents the judgment of low-cost whales. If the price rises afterward and they start to sell gradually, it would be worthwhile to set a warning for when they make their moves. Everyone can add this shared address to the K-line for tracking.
The second address is 0x634fe24f2f7396f5d967ec3936df04f49a3e6951. Last week, it simultaneously went long on BTC and ETH, but this week it directly changed its holdings.
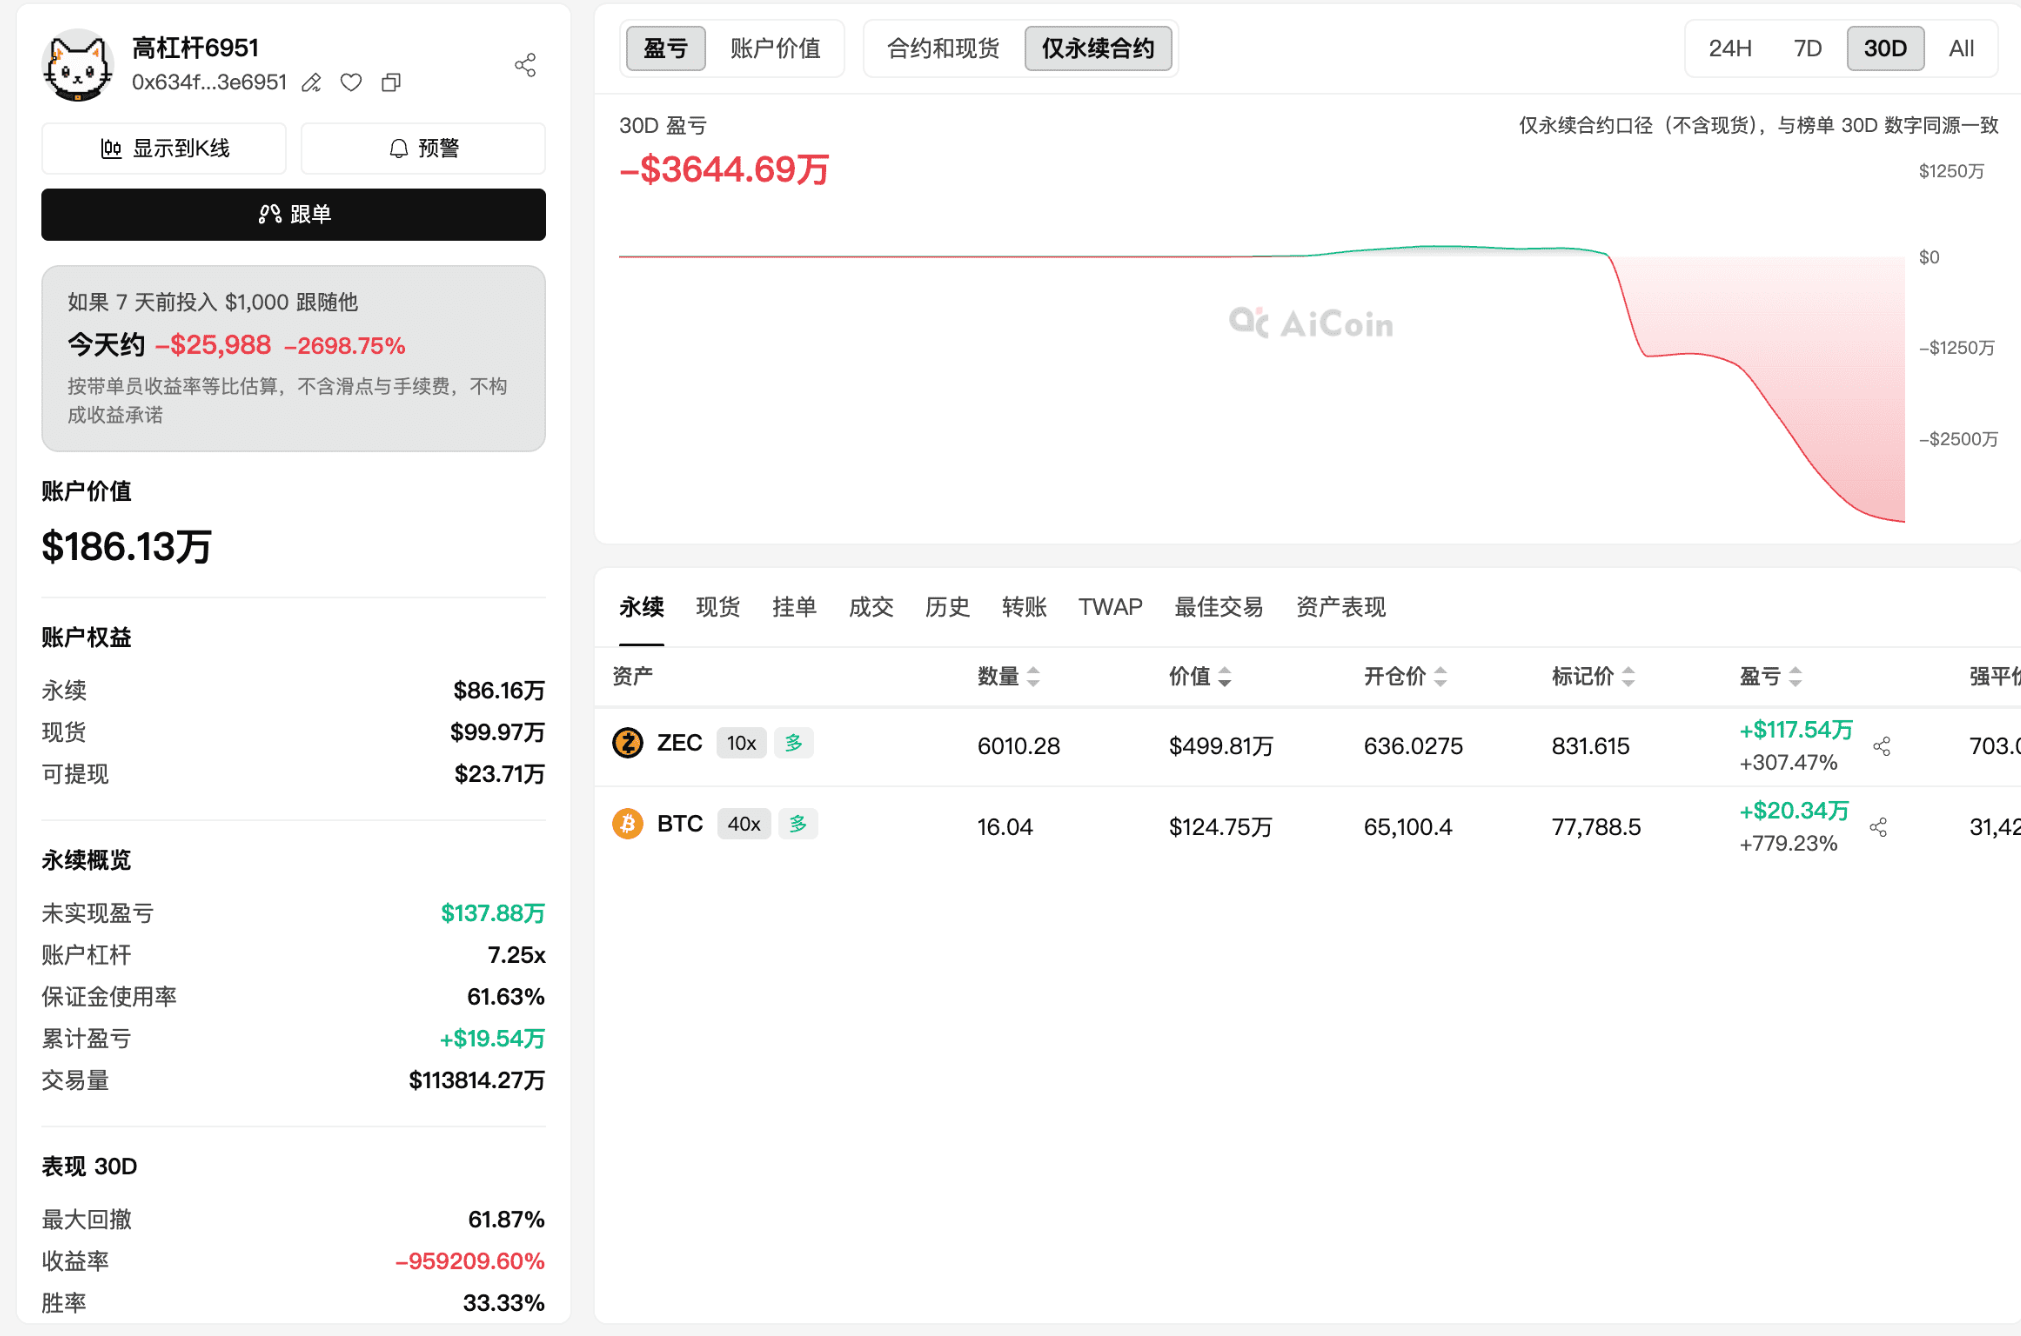
It still holds about 16.038 BTC long positions, with an average cost of around 65,100 USD, currently at an unrealized profit of about 200,000 USD. It has completely cleared all of its ETH positions, with public trading records showing that around 9:30 PM on August 27, it closed 3,113.65 ETH long positions at around 2,490 USD, making a profit of about 16,700 USD. Now its largest position is converted to ZEC, with about 6,010 long positions valued at approximately 4.92 million USD and an unrealized profit of about 1.09 million USD. This address hasn’t exited the crypto market, it just exchanged ETH for ZEC. For the market, this feels more like a rotation between assets rather than a full bearish outlook. ZEC’s current price is about 821 USD, having fluctuated between 788 - 872 USD over the past three days, without establishing a new direction. However, its open contracts are about 388 million USD, with a 24-hour trading volume of about 193 million USD, indicating decent activity. This address’s choice of ZEC indicates that during the sideways phase, some people are still willing to seek out more elastic assets to capitalize on market movements. Friends focusing primarily on altcoins should keep an eye on this address.
Next, let’s look at the short seller we tracked last week, the address is 0x396dc3e4d1051837bb559810d2b1ea797775899. Last week it shorted about 55.33 BTC, and now only about 8.665 BTC remains, having closed more than 84% of its positions. Over the past seven days, it made a profit of about 253,000 USD on BTC. This account has made a total profit of about 1.75 million USD over the past month, indicating that it isn’t closing out due to an inability to hold, but rather it is actively taking profits.
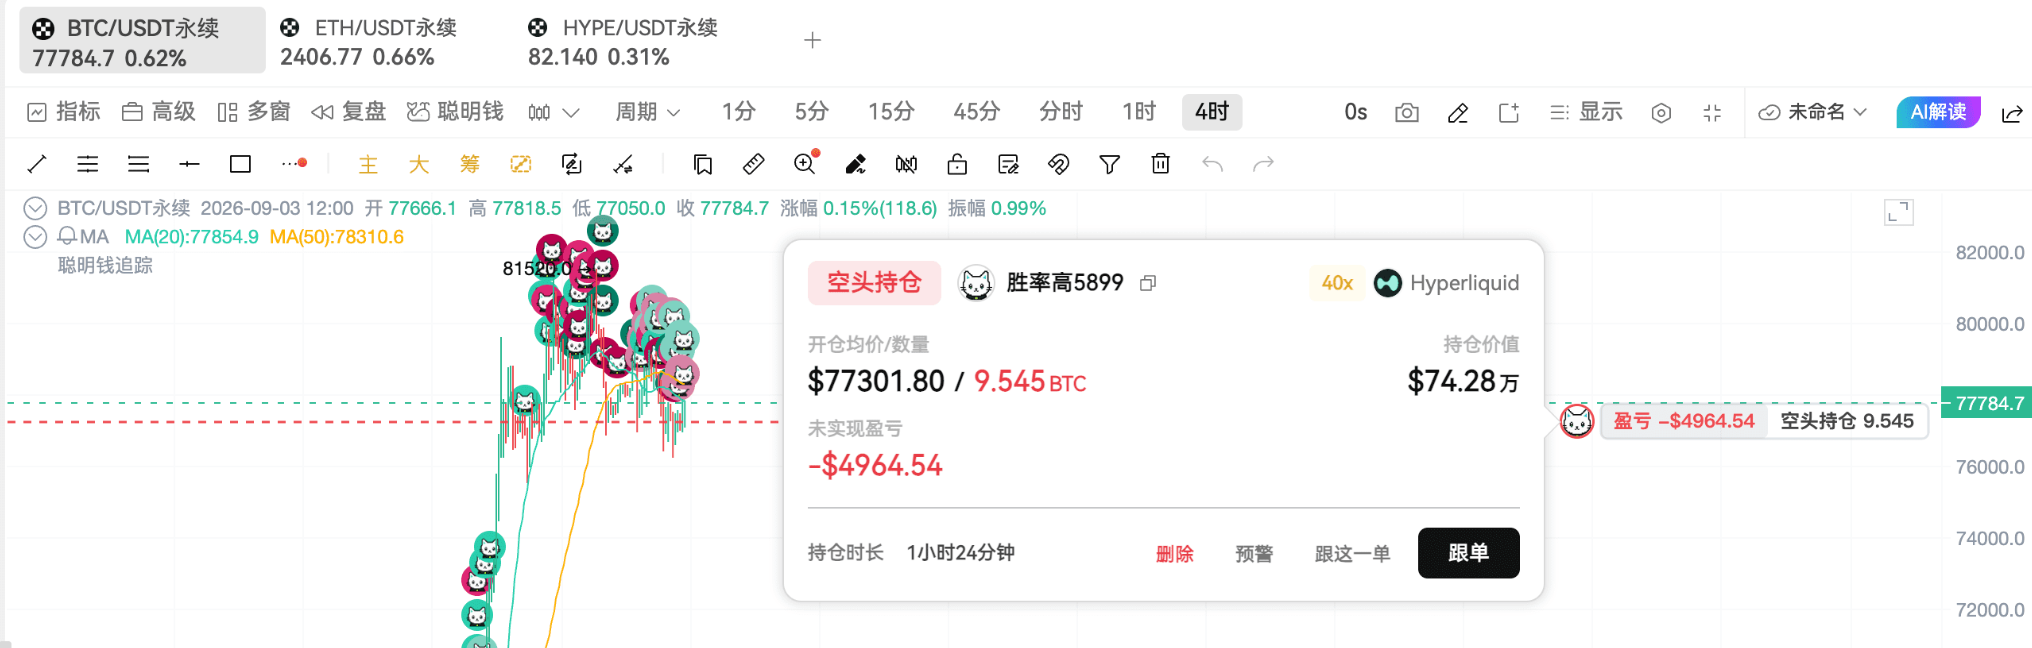
It can be seen that its current holding is at a slight loss. What has this short seller sensed that they don't dare to continue holding the short position? If they were truly strongly bearish, there wouldn’t be any need to reduce their position from 55 to less than 9. A significant reduction in holdings indicates that the space below has become less favorable than before; leaving a small short position shows they are also unwilling to side entirely with the bulls. This approach of both taking profits and leaving some test positions fits perfectly with the currently oscillating market.
After saying all of this, how can we use smart money to identify resistance levels? You can look at the following two addresses.
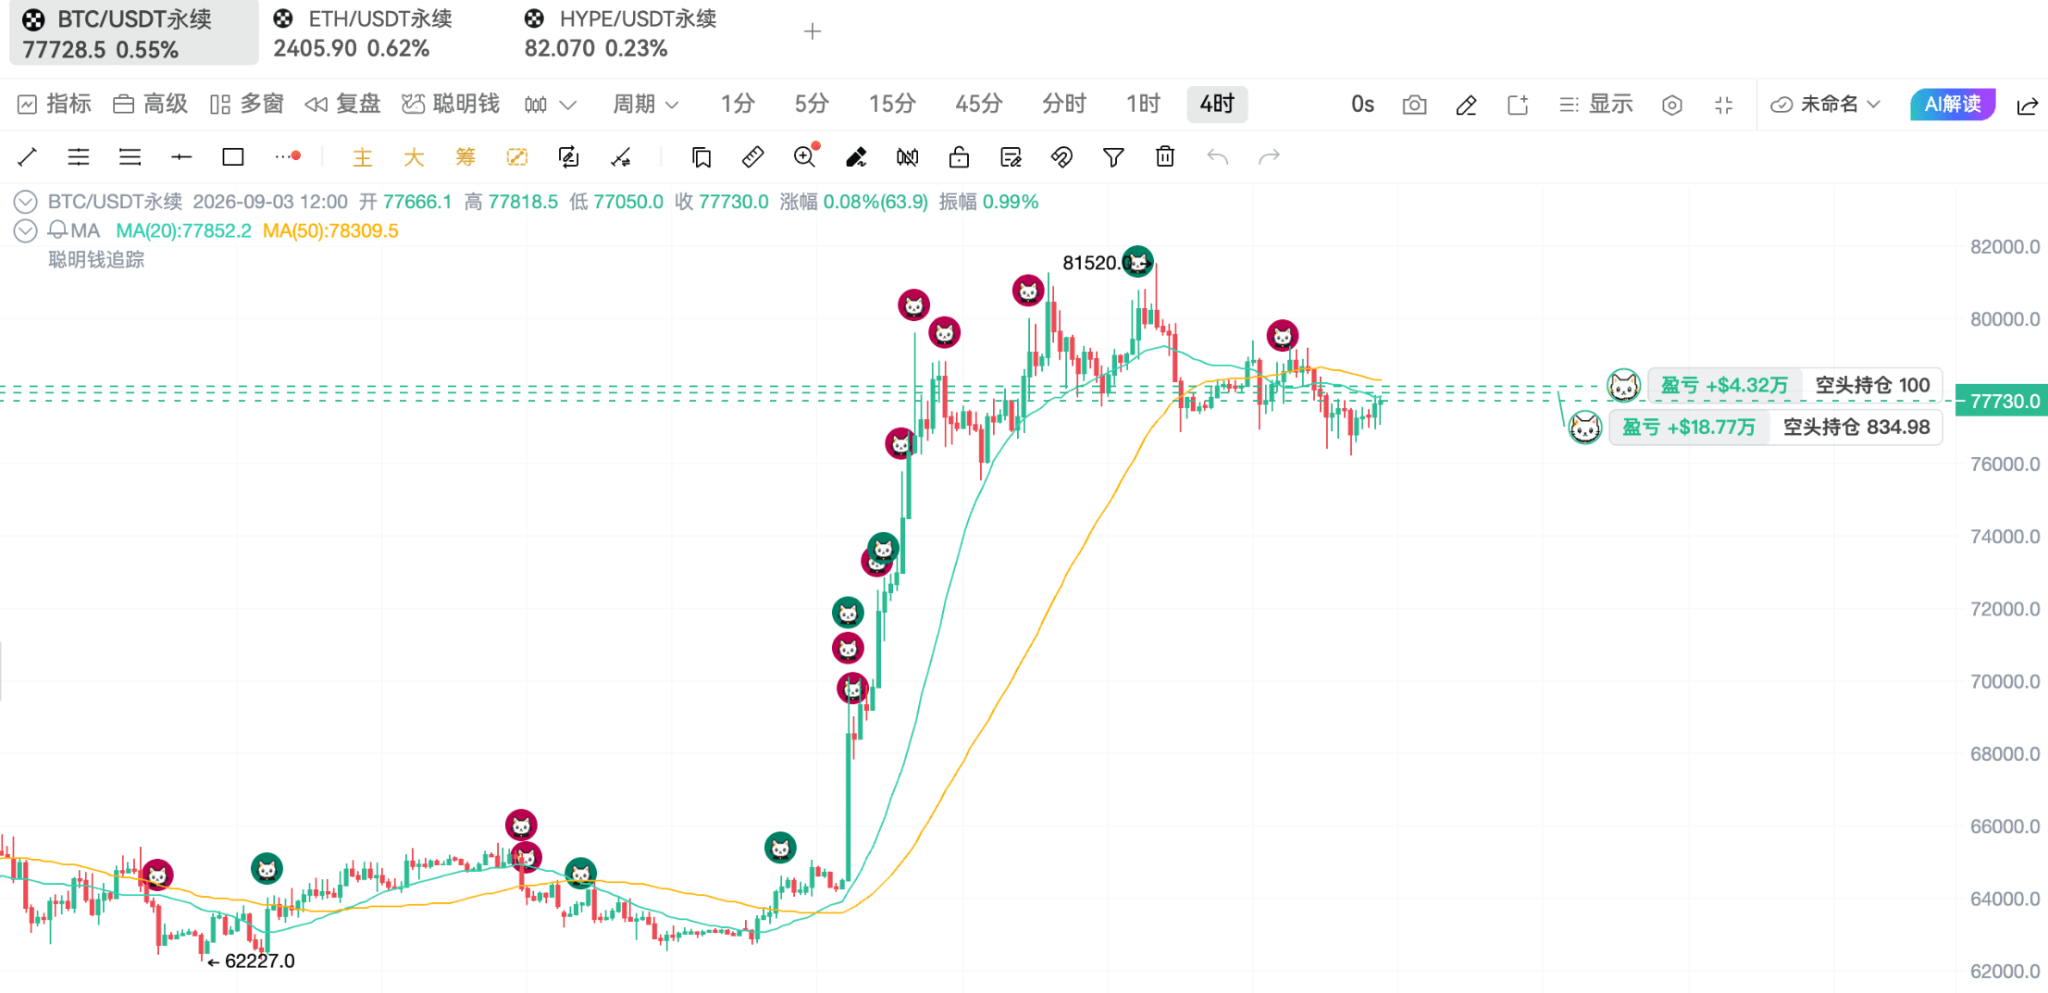
After reducing their short positions, new shorts have appeared above the range. The address 0xfc27136e42af1732ddc9ce2605ea9bff1b959d9d currently has shorted about 835.252 BTC, with a position value of approximately 6.489 million USD, and an average opening price of about 78,008 USD. This account has made about 2.43 million USD over the past week and about 2.24 million USD over the past month. Another address 0x9321d8117e73b0c79035f0e87debcfd8dbb1d75a has shorted exactly 100 BTC, with an average opening price of about 78,199 USD. Over the past week, it has made about 2.77 million USD, and in the past month, approximately 3.99 million USD. Both accounts that have been profitable recently are placing their short positions around 78,000 USD. This indicates that the 78,000 — 78,200 USD area indeed has pressure. The locations where on-chain smart money opens short positions are surprisingly consistent, all hover around 78,000. If BTC approaches around 78,000 USD again and these addresses continue to add shorts, that upper pressure remains; if the price breaks above 79,250 USD, and they start buying to cover their shorts, that would increase the credibility of the breakout. Conversely, if the shorts remain unchanged and the price rapidly falls back into the range, it indicates that this upward attempt has once again failed.
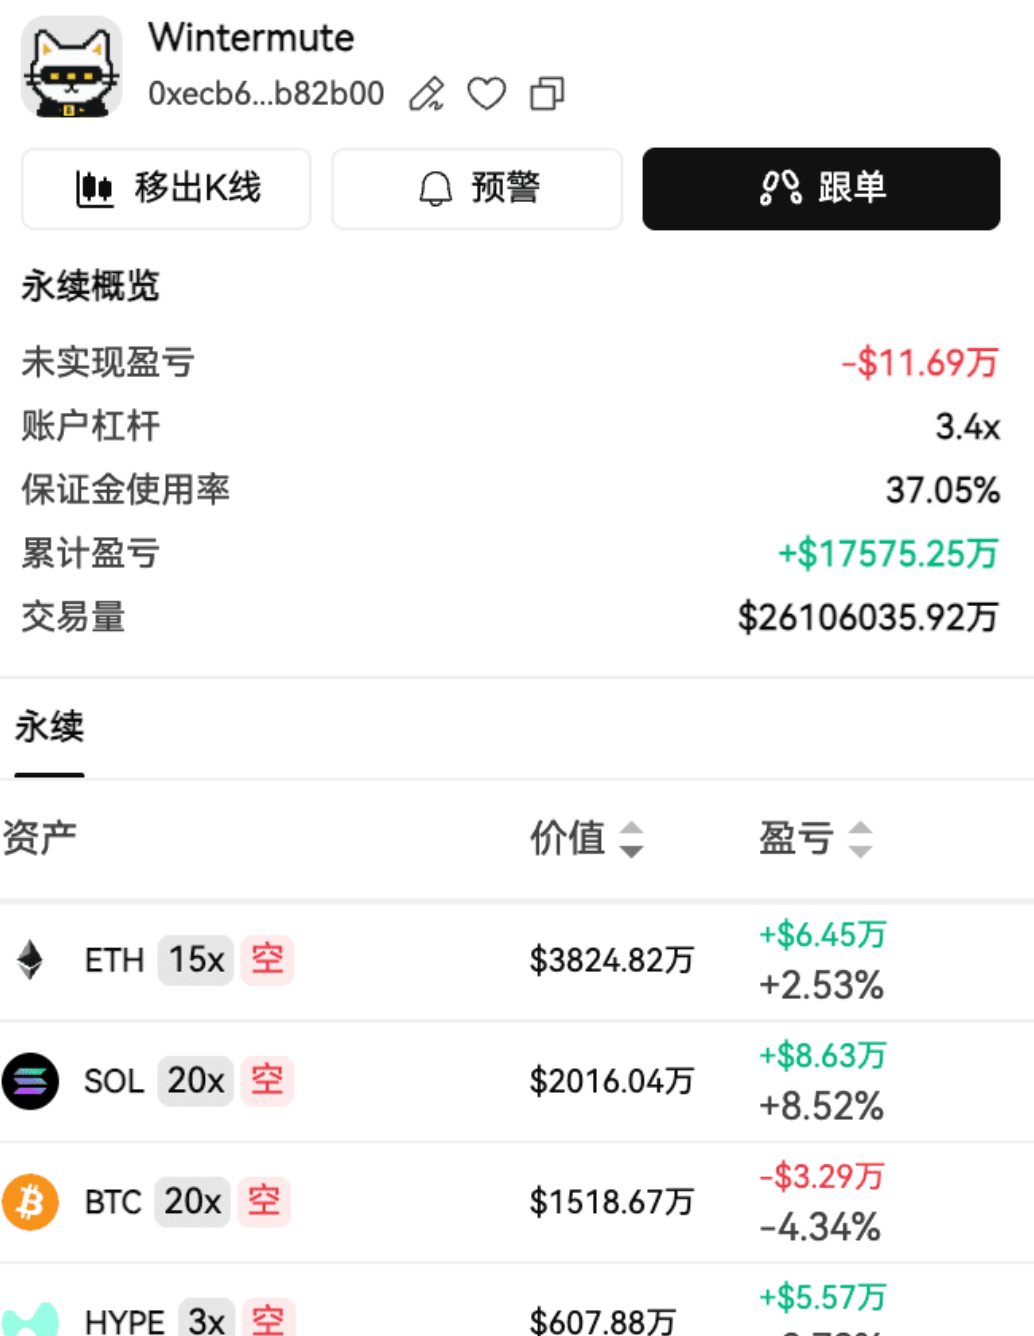
Now let’s take a look at HYPE, which has risen sharply recently. With BTC directionless, HYPE is also fluctuating, but the risks for HYPE are much higher. Currently, it has about 1.871 billion USD in open contracts, with a 24-hour trading volume of about 319 million USD. Simply put, there is still a large amount of unclosed leveraged positions in the market. It seems everyone enjoys fighting over highly elastic targets. The address 0xecb63caa47c7c4e77f60f1ce858cf28dc2b82b00 currently has about 77,285 HYPE shorted, valued at around 634,000 USD. This account also simultaneously shorts BTC, ETH, and SOL. However, its trading frequency is extremely high, with more than a thousand BTC orders alone, resembling a market-making account, so we can’t simply label it as smart money that’s broadly bearish. The position does not represent their trend attitude.
HYPE's current operating range is 79.94 — 85.40 USD. As long as it remains within this range, it is a fluctuating market; once it moves out, a large number of leveraged positions may adjust together, and the volatility will be much faster than BTC. If you want to set up grids, HYPE seems to have a larger price difference, but the risk is also significantly higher. Friends still holding HYPE should be cautious about the risks, as HYPE's funding rate is currently slightly negative, and the pressure on shorts is quite significant. If the market suddenly explodes, a large number of short sellers could instead become fuel for upward movement.
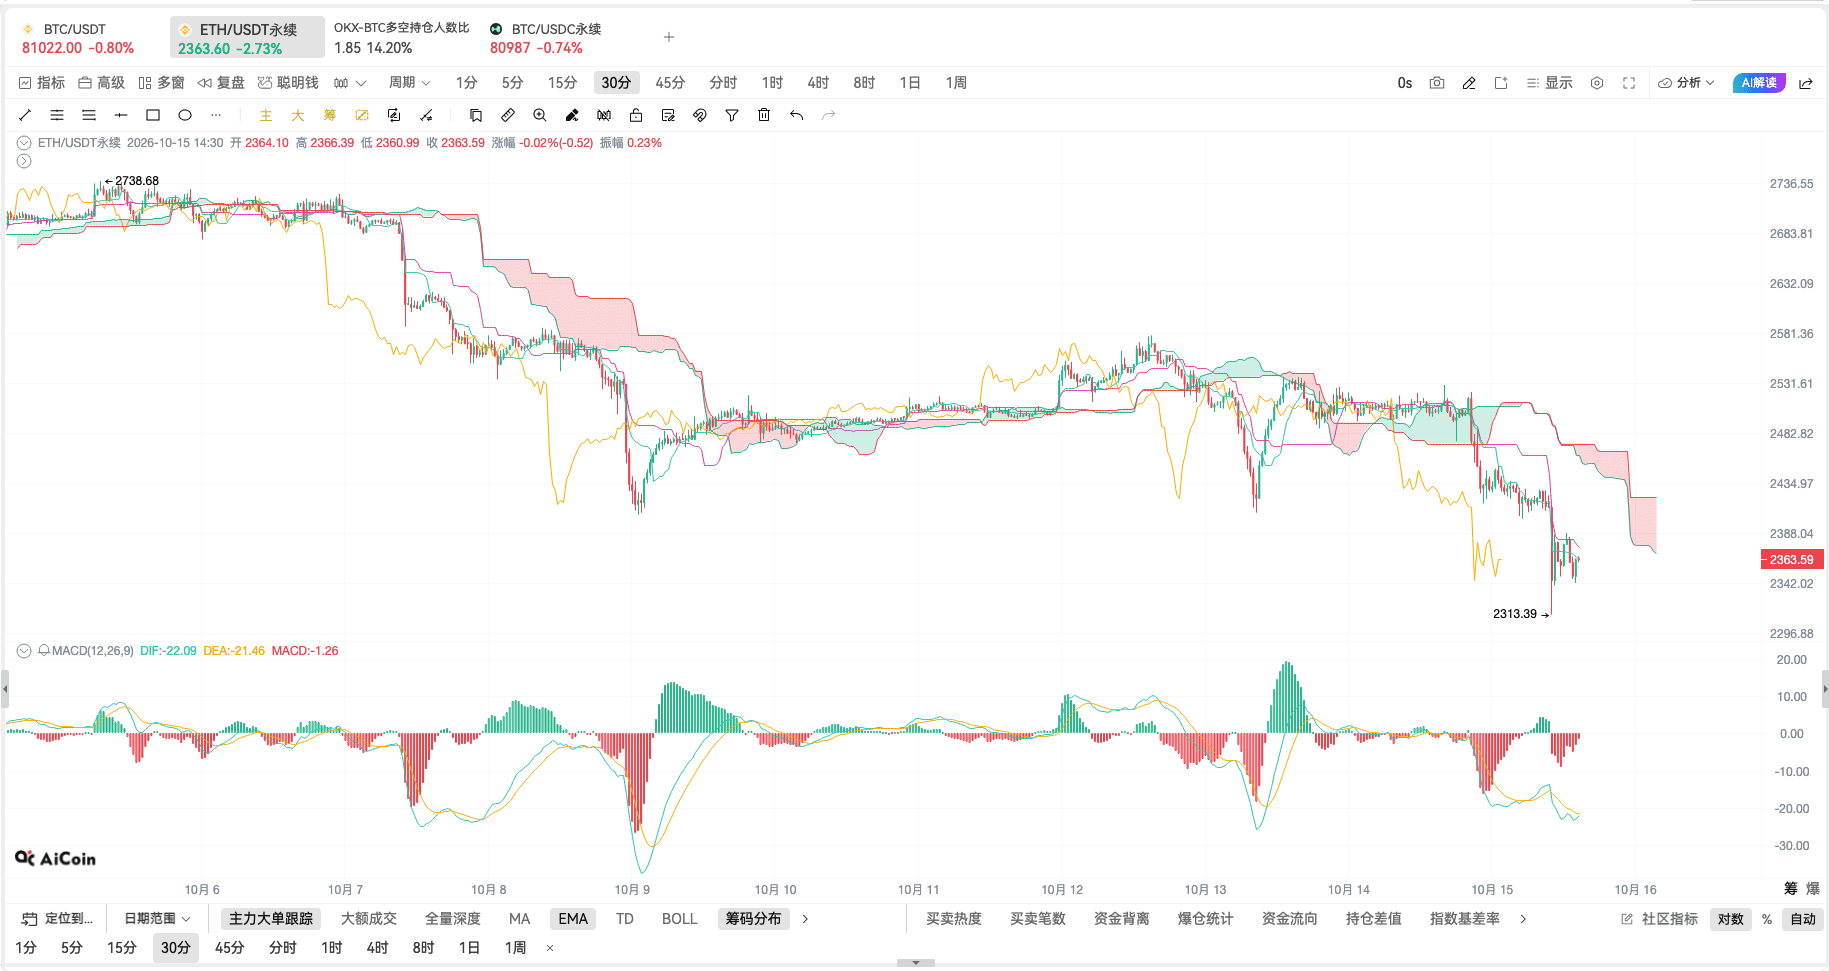
So after discussing all this, what should we do now? My answer is: set up grids. The past week has had no direction, and prices have been oscillating within a range, making it indeed a comfortable area for grids. BTC can be observed around 76,200 — 79,300 USD, and ETH can be looked at between 2,350 — 2,490 USD. Buying in batches as the price approaches the lower end and selling in batches as it nears the upper end is much more reasonable than chasing price jumps in between.
The actions of large on-chain holders are quite clear: low-cost longs are holding on, old shorts have closed about eighty percent of their positions, and new shorts are waiting around 78,000 USD. Both bulls and bears are acting from their favorable positions, and no one is genuinely winning, so BTC remains trapped between 76,234 — 79,250 USD.
For directional trades, we just wait for BTC to leave this range. A breakout to the upside should have accompanying volume, and ideally, ETH should also stand above 2,490 USD; for a downward break below 76,234 USD, we also need to see if ETH simultaneously breaks below 2,356 USD. If it’s just a quick price spike that retracts immediately, it doesn’t count as confirmation of direction. If you want to participate in the current market, consider low-leverage, conditional exit range grids. BTC can currently be monitored at 76,200 — 79,300 USD, and ETH at 2,350 — 2,490 USD. If the range is effectively broken, stop the old grids and reassess the direction.
The upcoming market can be divided into three scenarios: First, BTC continues to move within the range, and the grid logic remains unchanged; Second, if it breaks above 79,250 USD with volume, we stop the original range strategy and wait for a retest confirmation before determining the next move; Third, if it breaks below 76,234 USD and ETH simultaneously weakens, we should control positions and avoid adding more to the grid downwards. This handling is much more practical than trying to guess which one will definitely happen in advance.
To sum up: smart money hasn’t unified on direction yet, and the market is still oscillating. Directional trades should continue to wait, while those who want to participate should set up grids, but don’t forget to establish exit conditions for the grid.
Currently, there are live broadcasts every day, and you are welcome to continue following the AiCoin community! Reserve your spot in advance 👇
https://www.aicoin.com/zh-Hans/live/list?tab=upcoming
Join our community to discuss together and become stronger together!
Official Telegram community:
https://t.me/aicoincn
AiCoin Chinese Twitter:
https://x.com/AiCoinzh
Aster rebate:
https://www.asterdex.com/zh-CN/referral/9C50e2
Hype rebate:
https://app.hyperliquid.xyz/join/AICOIN88
Binance rebate:
https://jump.do/zh-Hans/xlink-proxy?id=3 Invite code: aicoin668
Coinbase rebate:
https://jump.do/xlink?checkProxy=true&proxyId=25 Invite code: Y8L23JL
免责声明:本文章仅代表作者个人观点,不代表本平台的立场和观点。本文章仅供信息分享,不构成对任何人的任何投资建议。用户与作者之间的任何争议,与本平台无关。如网页中刊载的文章或图片涉及侵权,请提供相关的权利证明和身份证明发送邮件到[email protected],本平台相关工作人员将会进行核查。