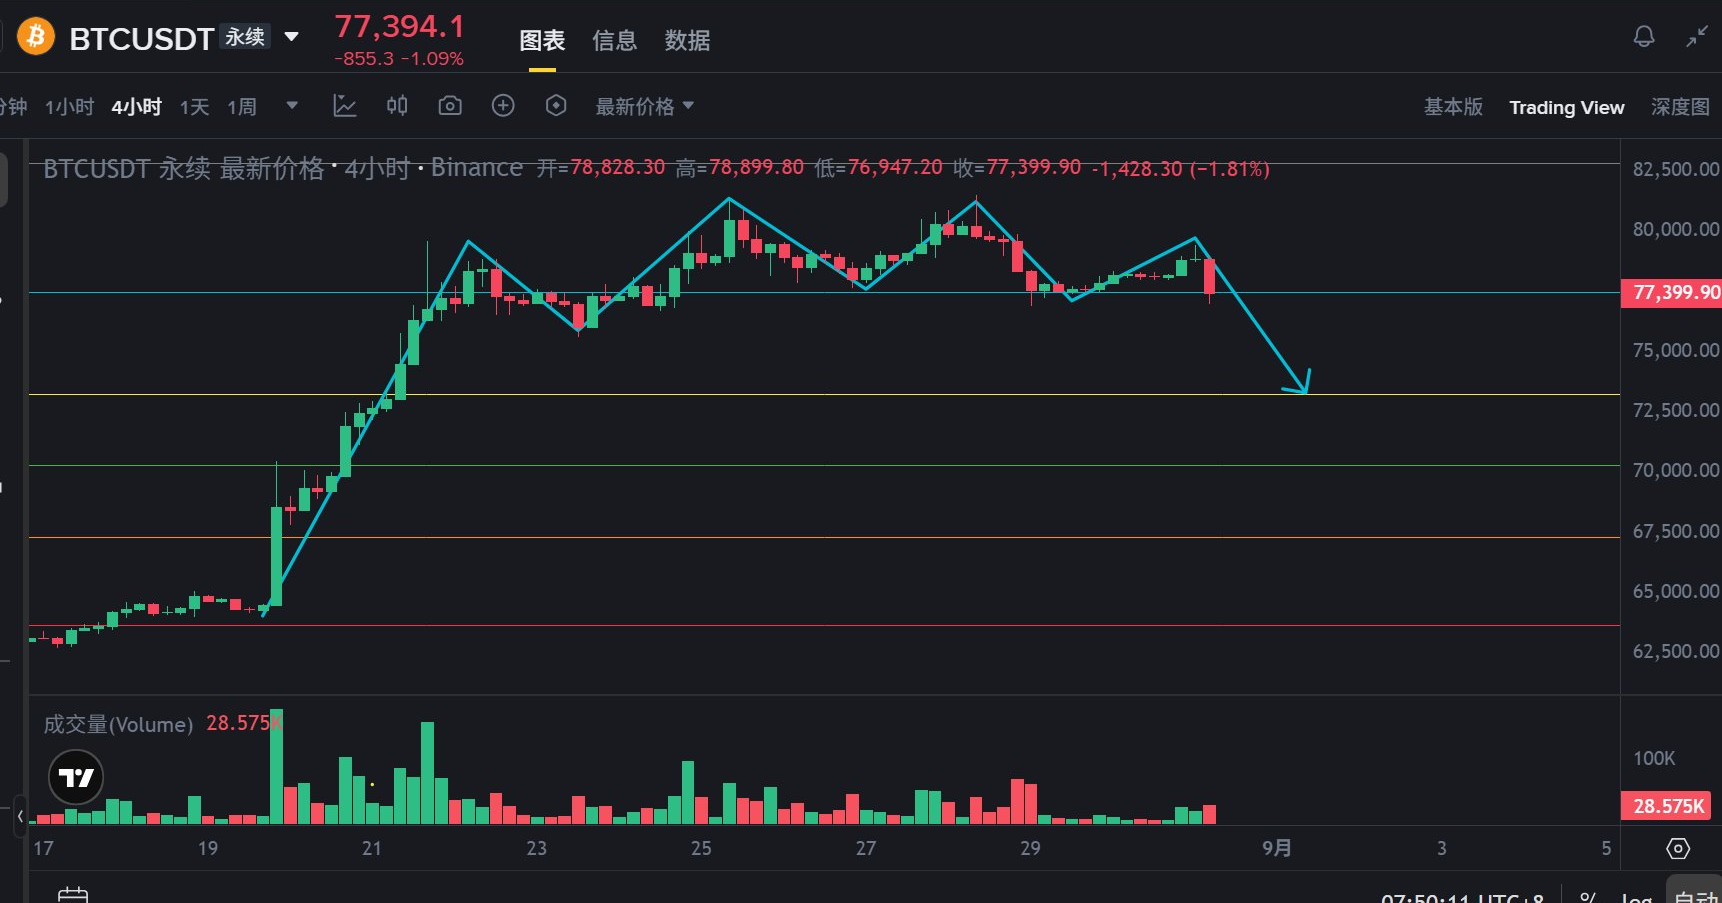
From a low of 1520 to a high of 2566, an increase of over 68% in just over a month, the scene of the bulls celebrating is still vivid, but in the blink of an eye, the market has fallen into a range bound around 2460.
Many people are unsure: is this a correction during an upward trend, or a signal for a market reversal? Today, we will thoroughly explain the current market logic from three time frames: 4 hours, 1 hour, and 15 minutes, in conjunction with the four major indicators—Bollinger Bands, MACD, RSI, and KDJ.
1. Market Review: After Violent Surge, Market Enters Consolidation Phase
First, let's review the complete context of this market movement: at the beginning of July, after the asset hit a phase low of 1520.54, the bulls completely erupted, with prices soaring along the upper Bollinger Band to a maximum of 2566.40, achieving a maximum increase of over 68%, resulting in a smooth trending market.
However, after reaching a new high, profit-taking pressure from the upper side was concentrated, and bullish momentum gradually weakened. Prices quickly retreated from the high and then entered a narrow oscillation range of 2460-2470. From a technical perspective, this is a normal correction after a significant rise—the market needs to digest profits and exchange positions through oscillation to accumulate strength for the next directional choice.
2. Multi-Cycle Technical Analysis
1. 4-Hour Level: The Major Trend Remains Intact, Correction Underway
The 4-hour chart is the core period for judging the medium-term trend; let’s set the overall direction:
Bollinger Bands (BOLL): The Bollinger Bands overall still maintain an upward diverging structure. Although prices have fallen from the high, they remain above the middle band, indicating that the larger uptrend has not been broken. However, the upper band has begun to flatten out, suggesting a lack of upward momentum in the short term, and the market has shifted from a "one-way rise" to a "consolidation phase."
MACD: The MACD indicator has been continuously retreating from a high position, with DIF and DEA gradually converging, and the green bars continue to be released, indicating that the 4-hour level correction is still ongoing, and bearish forces are gradually being digested. However, there has not yet been an acceleration in the decline following a death cross, more so indicating a benign correction in the rising process.
RSI & KDJ: RSI has retreated to the neutral zone around 50, with both bulls and bears temporarily balanced; the KDJ's J line has dropped below 20 into the oversold zone, indicating that the space for short-term correction is relatively limited, and a rebound could occur at any time.
2. 1-Hour Level: Clear Range Oscillation, Intensified Bull-Bear Battle
When the time frame is narrowed to 1 hour, the oscillation characteristics of the market become very clear:
Bollinger Bands (BOLL): The Bollinger Bands are significantly constricted, with prices operating below the middle band, where 2500-2520 is a strong resistance area, and 2384.20 is a critical support level. In the short term, the market will likely oscillate within this range until new capital or news emerges.
MACD: MACD is fluctuating near the zero axis, with red and green bars alternating, showing no clear bias for bulls or bears, which is a typical indicator of oscillating market conditions. During this phase, blindly chasing rallies or selling off can easily lead to losses on both sides; a strategy of buying low and selling high within the range is a more prudent choice.
RSI & KDJ: RSI is oscillating near 50, indicating that the market lacks a clear direction; KDJ is in the mid to low range and shows signs of turning up, suggesting short-term rebound demand, but constrained by the correction pressure of the larger cycle, the height of the rebound should not be overly optimistic.
3. 15-Minute Level: Short-Term Stabilization, Minor Rebound Imminent
If trading intraday short positions, the 15-minute cycle can help us find a more precise entry rhythm:
Bollinger Bands (BOLL): The 15-minute Bollinger Bands are further narrowing, with prices oscillating near the middle band, indicating that short-term bulls and bears have reached a critical point, and a minor directional move is likely to emerge soon.
MACD: The green bars of the MACD are continuously shortening, with small red bars emerging, and DIF and DEA forming a potential golden cross below the zero axis, indicating that short-term bearish forces have exhausted, and bulls are beginning to attempt a counterattack, with a rebound expected during the day.
RSI & KDJ: RSI has risen to the 50 mark, and the J line of the KDJ is rapidly diverging upward, suggesting that short-term rebound momentum is accumulating, with the first rebound target being the 2480-2490 area.
3. Future Operating Strategies
Based on a comprehensive judgment of multiple cycles, we provide corresponding reference strategies for friends with different trading styles:
Long-term Holders
The major uptrend has not been broken; core positions can continue to be held, using the middle band of the 4-hour Bollinger Bands as a trend defense line. As long as prices do not effectively break below the middle band, there is no need to blindly cut losses; when the price retraces to the key support level, one can buy in batches to average down your position cost.
Short-term Traders
The current market is a typical oscillating condition where blindly chasing rallies or selling panic is most discouraged.
When prices fall to the support range of 2400-2380, one can gradually buy long positions, with stop losses set below 2380;
When a rebound occurs to the resistance range of 2500-2520, take profits gradually and exit, without being greedy or overly attached;
Only follow through when prices effectively breach the new high of 2530 or effectively drop below the 2380 support to join the trend.
Observers
If you are uncertain about the direction, don't force yourself to enter the market. Patiently wait for the market to show a clear signal: either break 2530 with significant volume confirming the continuation of the uptrend or effectively break below 2380 confirming a deeper correction. Only then is it appropriate to act, avoiding the depletion of capital from repeated stops in an oscillating market.
Risk Warning
The cryptocurrency market is highly volatile, and news or funding changes may trigger market fluctuations at any time. The above analysis is only a probabilistic judgment based on technical aspects and does not constitute any investment advice. Please be sure to control your position and strictly set stop losses, taking responsibility for your own funds.
In summary, the current market is like a "halftime break after a big rise"—there is no need for blind optimism claiming a new high is imminent, nor need for excessive panic thinking a bear market has come. Following the cycle rhythm, managing positions well, and waiting for the market to clarify before acting in the direction is currently the best trading strategy.
If you find this article useful, feel free to like, view, and share it with your trading friends around you. See you next time.
免责声明:本文章仅代表作者个人观点,不代表本平台的立场和观点。本文章仅供信息分享,不构成对任何人的任何投资建议。用户与作者之间的任何争议,与本平台无关。如网页中刊载的文章或图片涉及侵权,请提供相关的权利证明和身份证明发送邮件到support@aicoin.com,本平台相关工作人员将会进行核查。