Crypto Circle Academician: After Ethereum (ETH) surged to 9.1, it has reached a turning point. What should Ethereum be wary of going forward? Latest market analysis reference.
The current price of Ethereum is 2470. After this wave of upswing, many friends have started to struggle, whether to continue pushing for new highs or to turn back for a correction. Many people, seeing the market rise sharply, hurriedly buy at high prices, only to encounter fluctuations and losses as they enter, causing their mindset to explode. The market never just moves up or down; after a big rise, it will not directly continue upward without thought, and will enter a fluctuation phase of competition between bulls and bears in the short term.
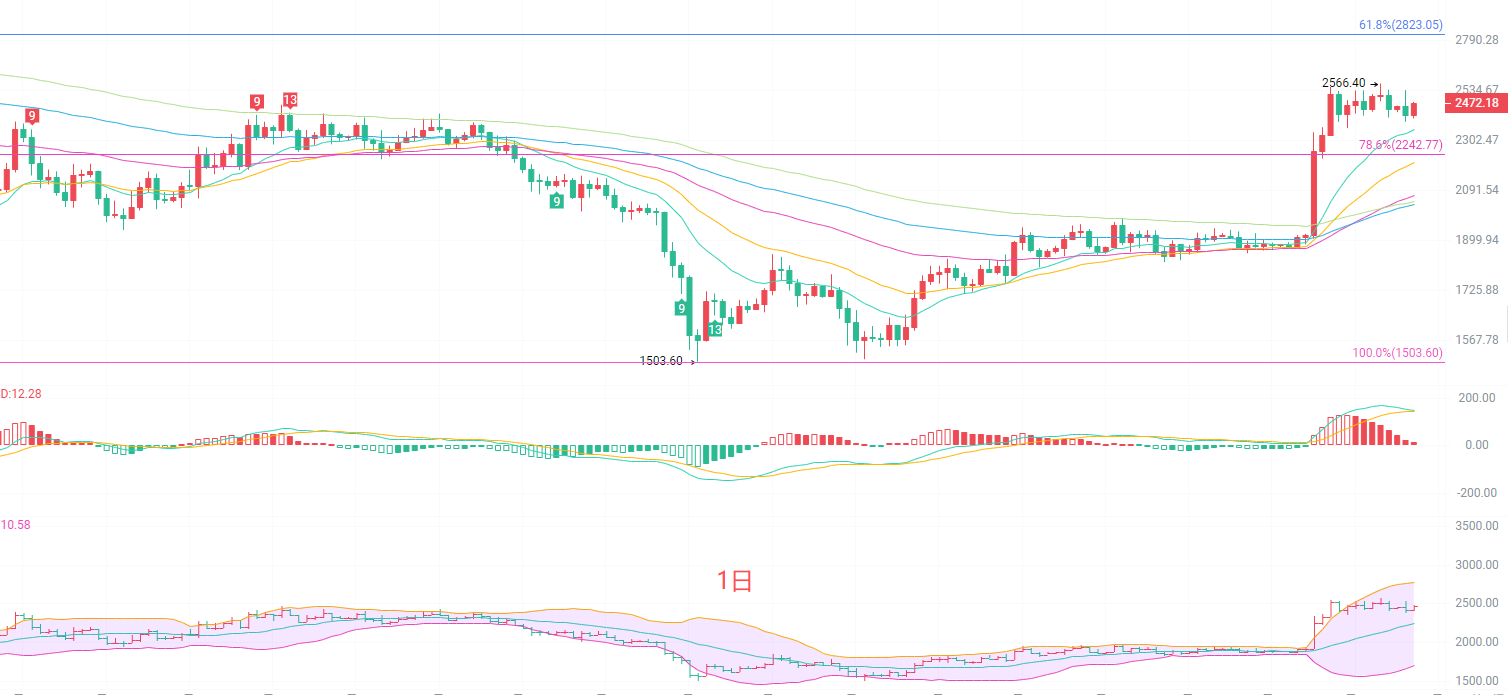
The daily K-line has begun to fluctuate downward at a high position. The current price is still stable above multiple EMA moving averages, and the medium-term bullish structure has not been broken. The MACD red bars have started to shorten, indicating a decrease in bullish momentum and signs of a bearish divergence. The Bollinger Bands are opening upwards, and the price is near the upper band. The key resistance above is 2566, while the first support below is 2242, which is the 78.6% Fibonacci level. The daily level trend remains bullish, but the short-term bullish momentum is exhausted, and the market is likely to enter a high position fluctuation to digest. It is difficult to continuously and violently rise directly; after facing pressure above, there is a possibility of testing support again.
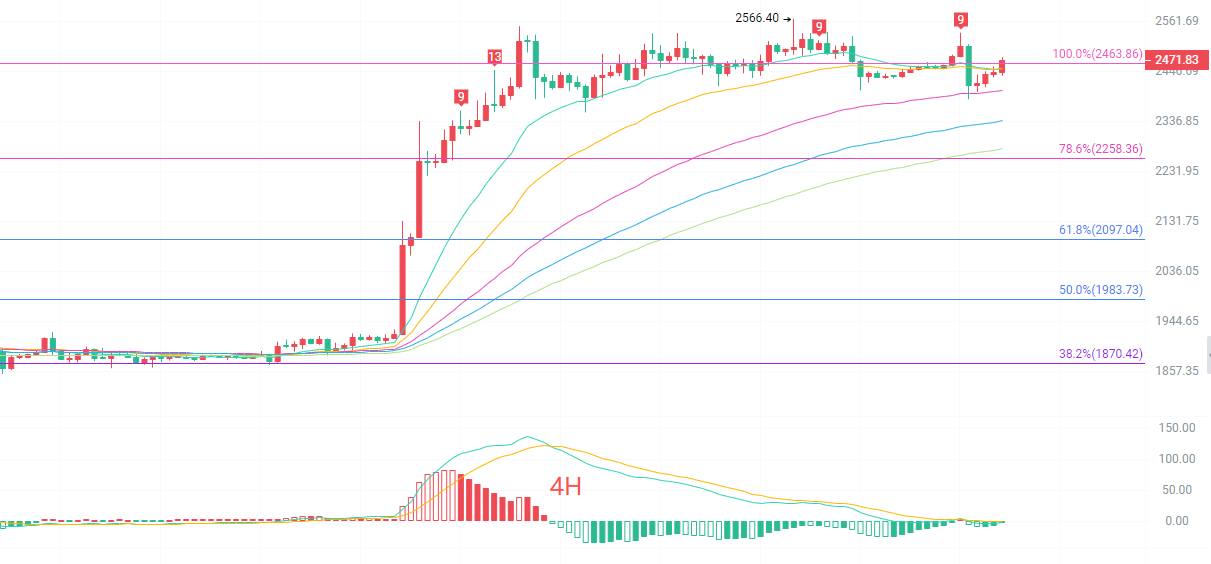
The four-hour K-line is in a high position fluctuation range. The short-term EMA moving averages have started to intertwine, and the bullish momentum is obviously slowing down. The MACD indicator DIF has crossed below DEA, and the red bars have almost disappeared, indicating a slight release of bearish power. The upper band of the Bollinger Bands presents clear resistance, and the price is approaching the middle band from the upper band. The strong resistance above is around 2463-2470, and the key support below is 2258. The 4-hour level has already shown a correction signal after the rise; for the bulls to restart the upward movement, they need to hold the 2258 support. Once this position is effectively broken, the recent upward pace will be disrupted, leading to further tests of deeper support.
Short-term reference:
Do not break 2440 to 2410 below to move north, stop loss 40 points, target look at 2530 to 2620.
Do not break 2540 to 2560 above to move south, stop loss 40 points, target look at 2500 to 2450.
Specific operations should be mainly based on real-time data of the market. For more details, you can consult the author. There is a delay in the article release; it is suggested for reference only, and the risk is borne by yourself.

Warm reminder: The above content is created solely by the author of the public account. The ads at the end of the article and in the comments section are unrelated to the author. Please identify cautiously, thank you for reading.
免责声明:本文章仅代表作者个人观点,不代表本平台的立场和观点。本文章仅供信息分享,不构成对任何人的任何投资建议。用户与作者之间的任何争议,与本平台无关。如网页中刊载的文章或图片涉及侵权,请提供相关的权利证明和身份证明发送邮件到support@aicoin.com,本平台相关工作人员将会进行核查。