Don't just focus on how much BTC and ETH have risen; it's more interesting to dig into the on-chain positions -- who is still stubbornly holding long positions, who is secretly trying to short at high levels, and what expectations are there for xyz:NVDA after Nvidia's earnings report hit the market.
Let's put the conclusion out first: From the price and high-performing address samples over the past 30 days, the dominant direction still leans bullish, but the market is no longer in a stage where you can blindly buy anything and expect it to rise. The daily gains are significant, and short-term indicators have also entered a hot zone, with recent hours showing signs of divergence.
In the past two weeks, BTC has accumulated a rise of 23.66%, ETH has risen by 30.43%, and HYPE has surged even more, jumping to 49.21%. Looking at this set of numbers, it's easy to conclude that “risk appetite has fully returned,” which is commonly referred to as a bull retracement.
Has the bull really returned? The market trends over the past few days have not been uniform: At the time of the snapshot, BTC was reported at $78,826, down 0.13% on the day; ETH was reported at $2,491.9, up 1.33% on the day; HYPE was reported at $81.573, down 0.49% on the day. The strong overall trend is still present, but the tokens have started to move in different directions.
On-chain smart money has also shown the same kind of differentiation. We scanned 150 candidate accounts chosen by the Hyperliquid leaderboard and filtered them to find those with profits over the past 30 days that are still holding positions. In this sample, the number of long positions in BTC and ETH is significantly higher than that of shorts, and xyz:NVDA is also predominantly long; however, when accounting for recent sizable loss-making accounts, ETH will be pulled into nominal net shorts by a few large short positions. What is truly interesting today is not just the phrase “smart money is bullish,” but the fact that most profitable players are following the trend, while a few large whales are still betting against it. Simply put: a lot of smart money is going long, but a few large whales are going short. Do they know something?
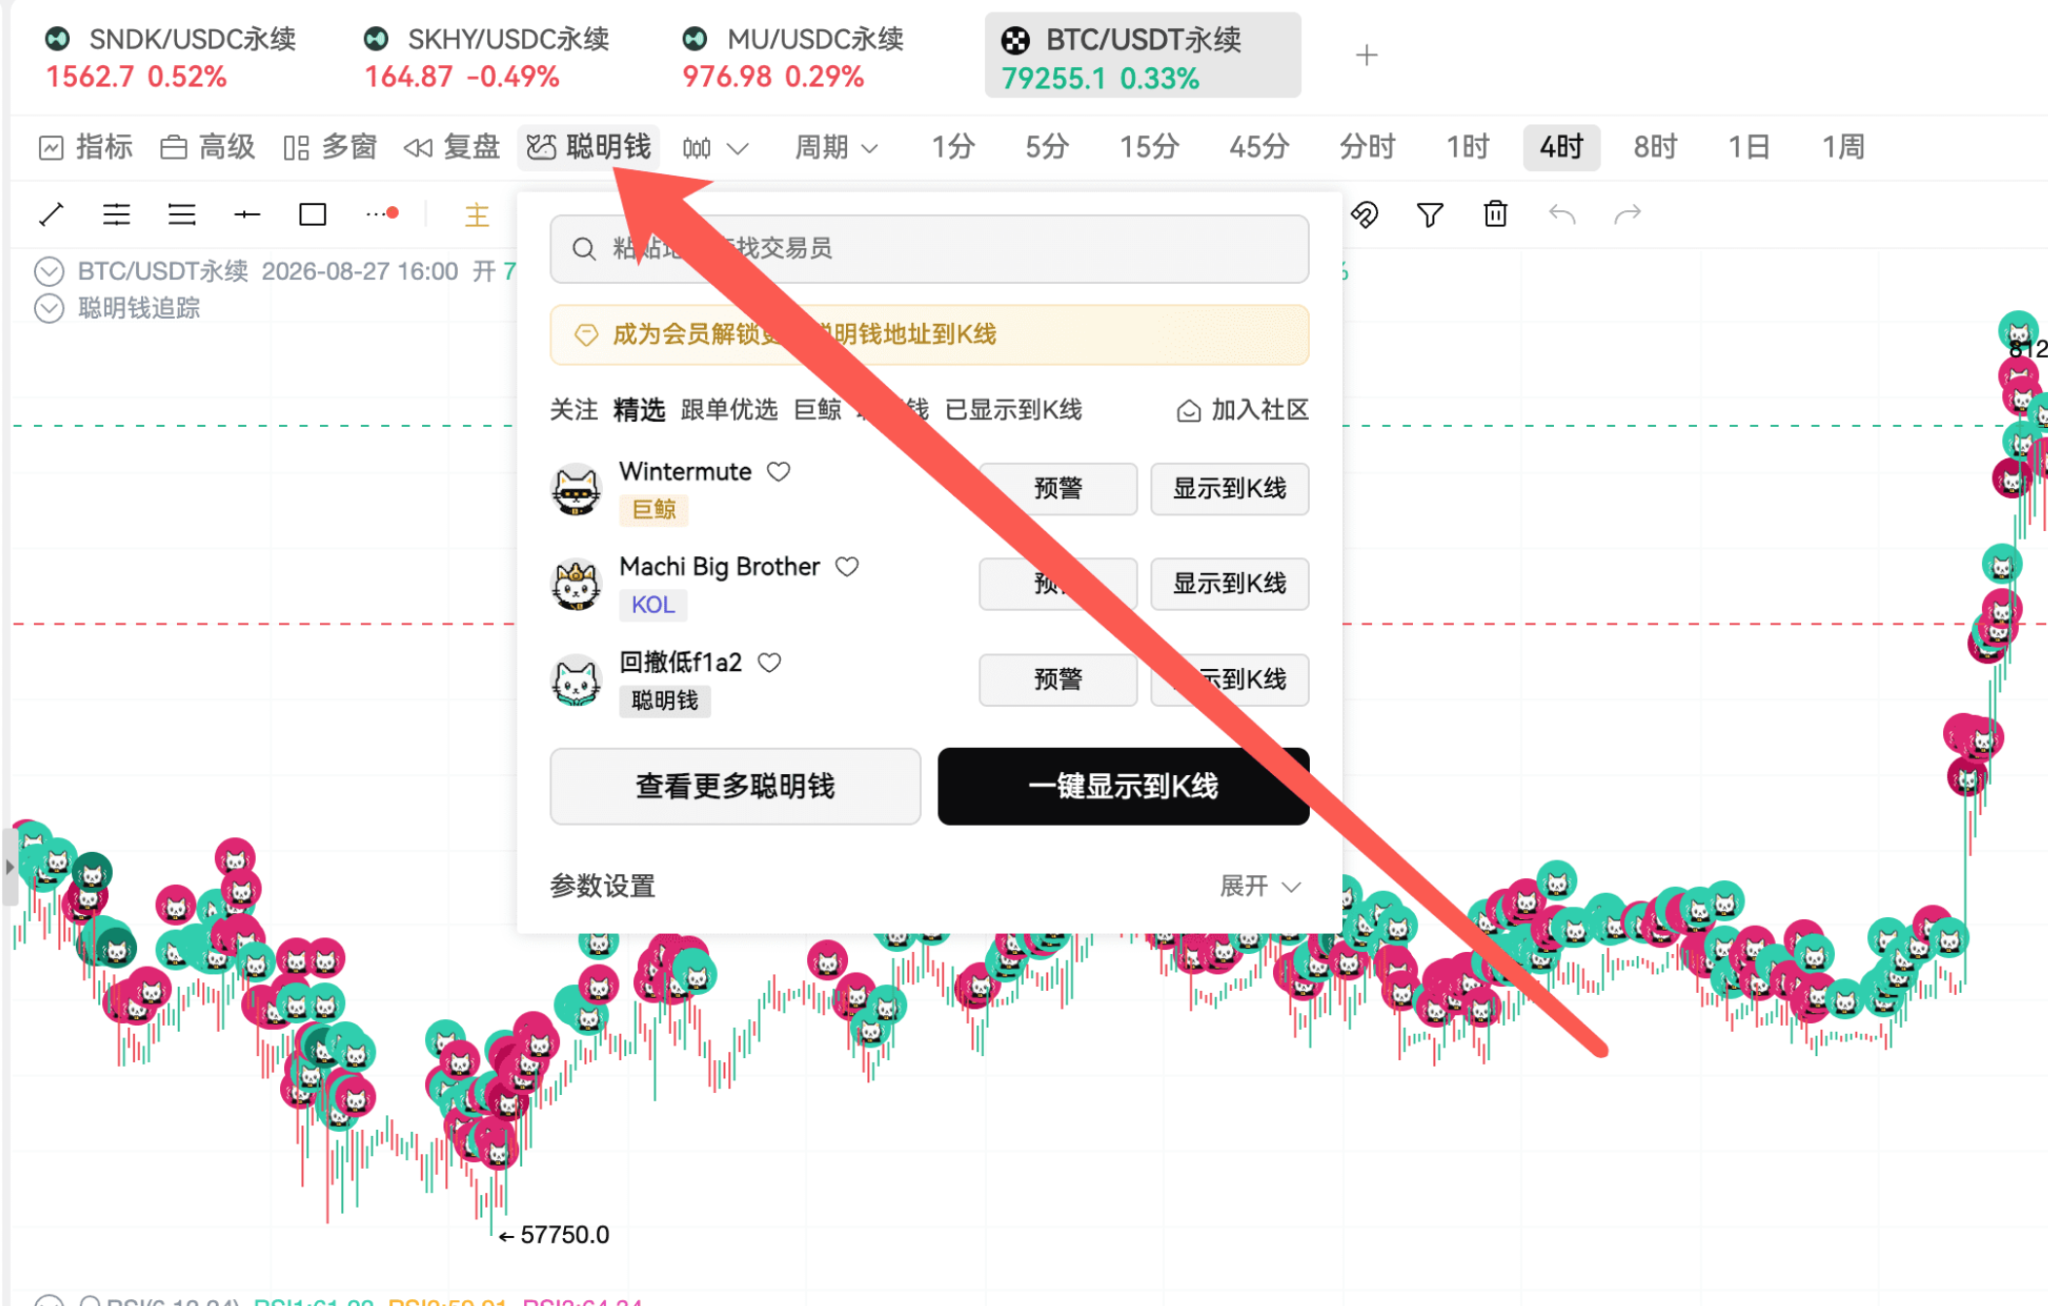
As a side note: those who want to see on-chain addresses can open the smart money section on the homepage, and we can track the addresses together. The addresses mentioned later can be added to your K-line for monitoring.
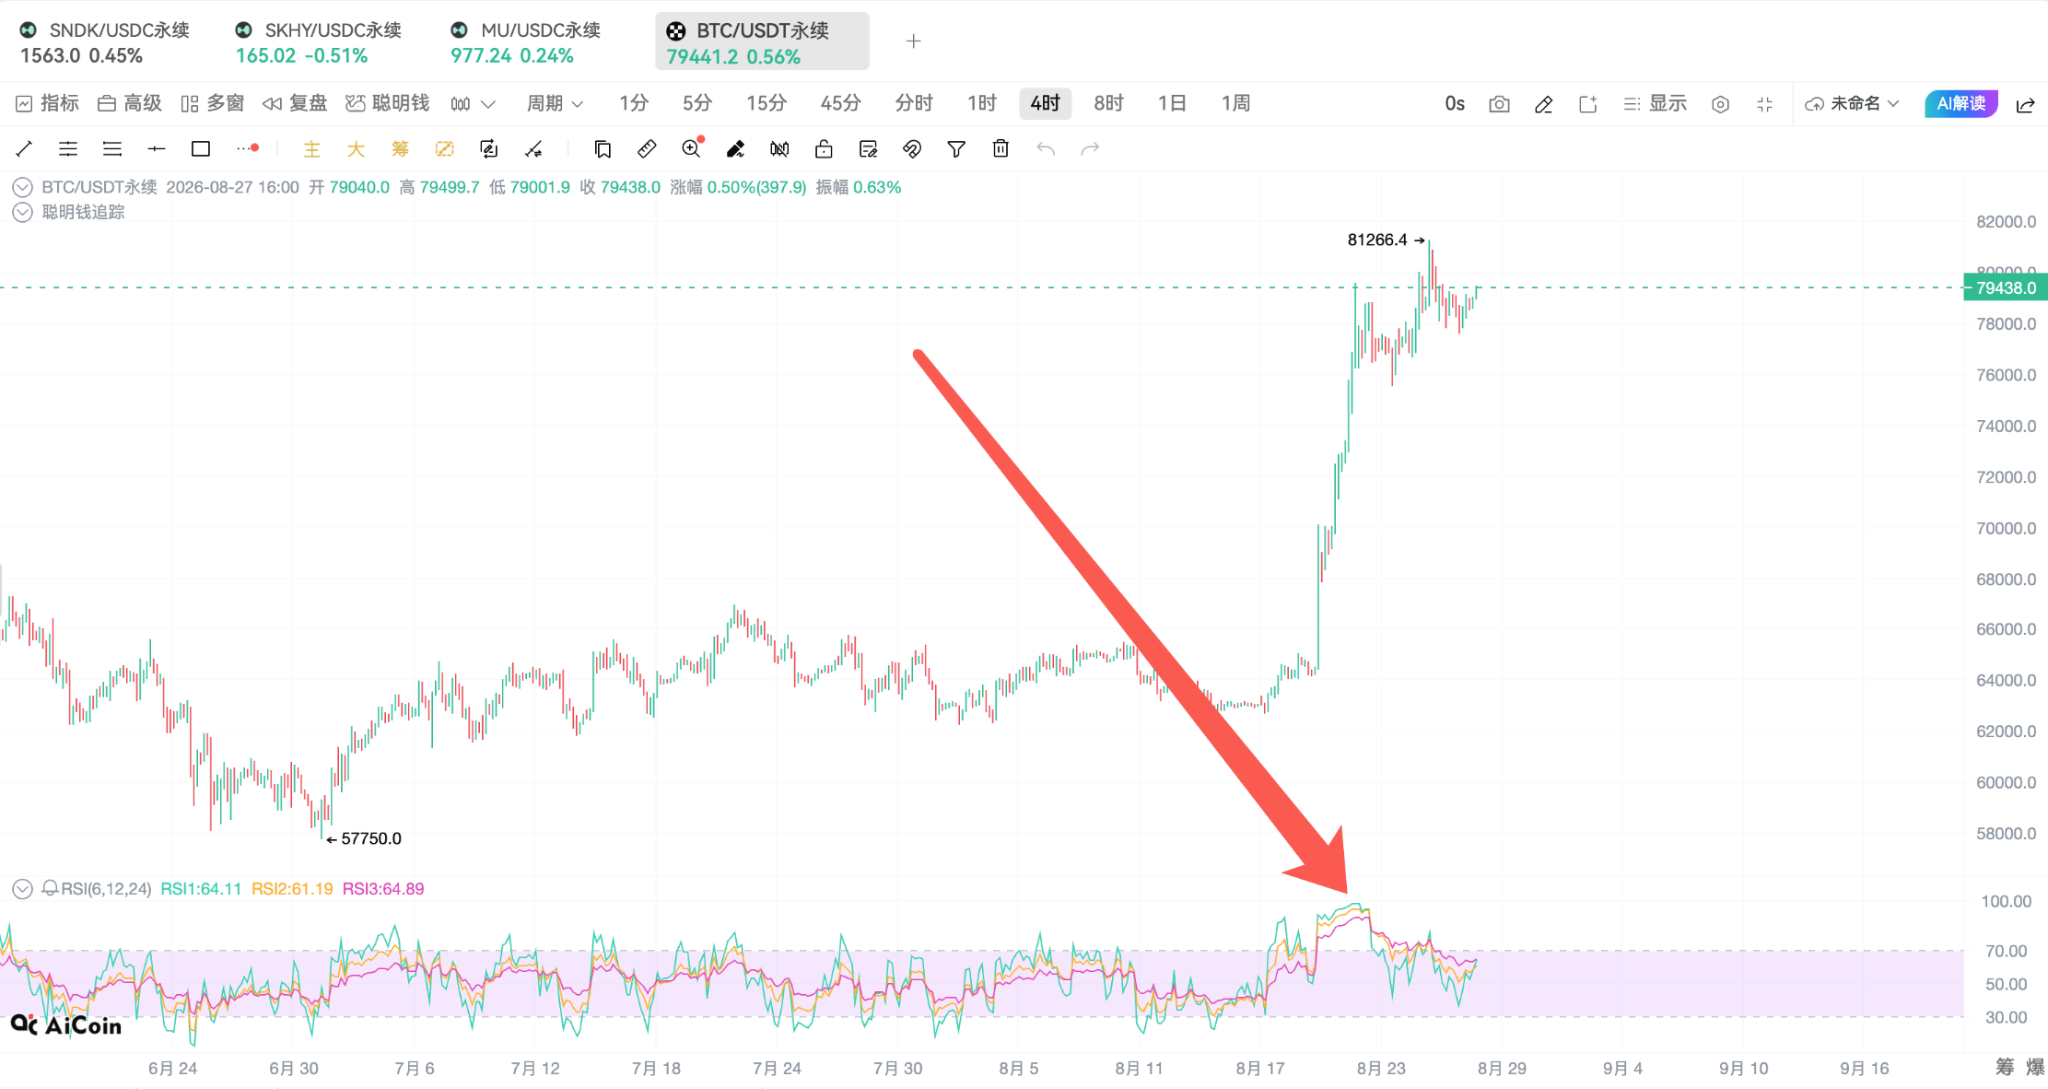
First, let's look at the overall market and extend the timeframe to 30 days. The tier of this round of increase is very clear. BTC is the market anchor, determining the direction, with a total increase of about 23.66%; ETH has a higher elasticity, rising by about 30.43%; HYPE has directly amplified risk appetite to nearly 50%. The simultaneous strengthening of all three indicates that the market situation is not an isolated event for any single coin, and funds are willing to spread along the risk curve from BTC to more volatile assets. However, the greater the increase, the higher the pullback risk undertaken by every subsequent chase trade, and one cannot simply translate "very strong over the past month" into "anything can be bought at any position now."
The daily RSI has already given the first warning. BTC's 30-day RSI is about 81.6, ETH about 76.9, and HYPE about 77.8, all in the hot zone. A high RSI does not mean an immediate top; in a strong trend, indicators can stay at high levels for a long time, but it will change the risk-reward ratio of trades: early bulls have a thick profit cushion, while newly entering bulls face less upward space and greater short-term volatility. There is no need to call a top here; a more suitable statement is that the trend remains strong, but the margin for error in chasing up is decreasing.
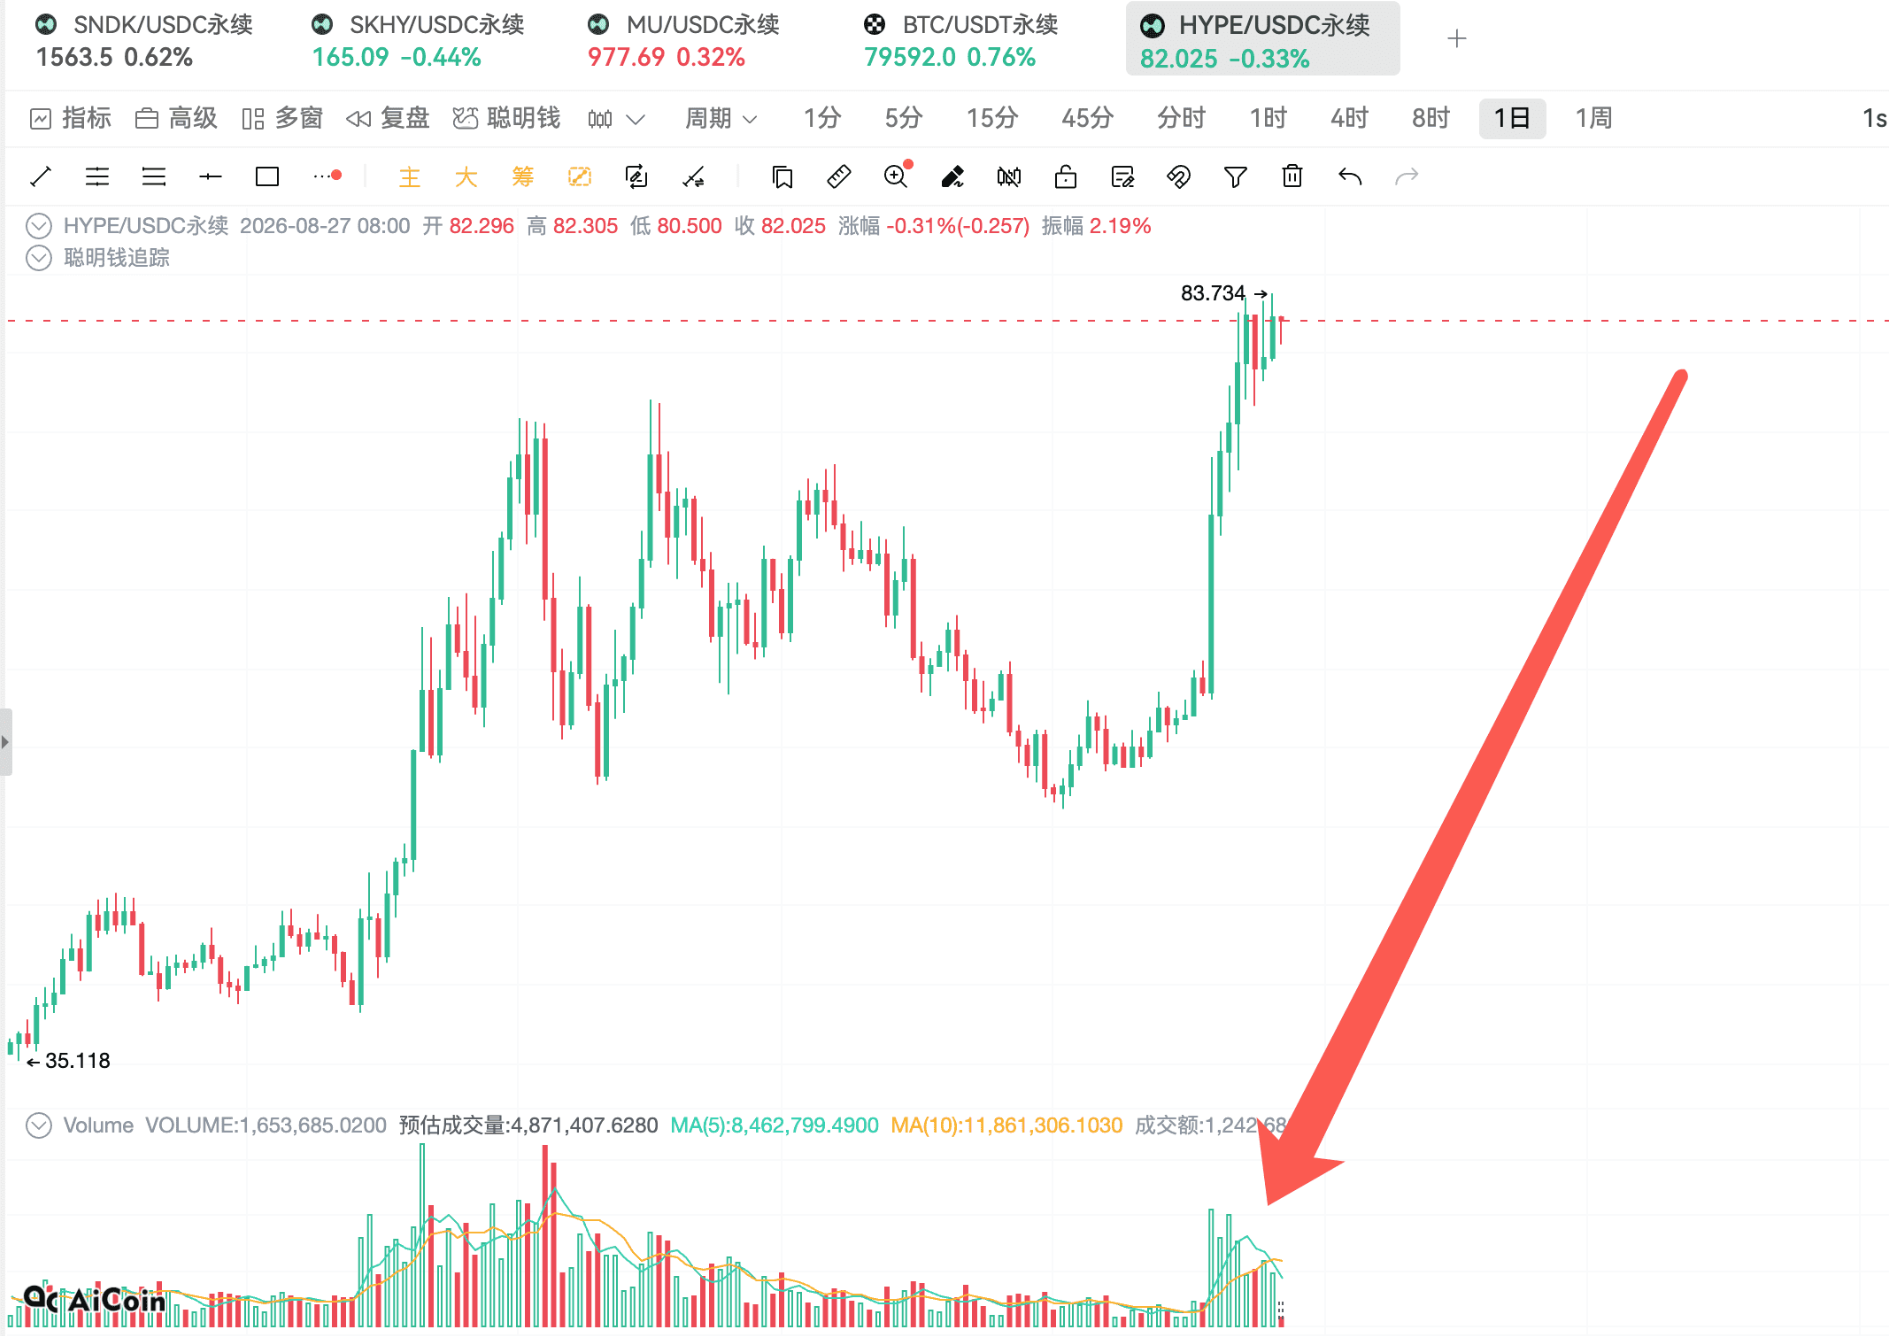
From transaction activity, at the time of the snapshot, BTC's nominal transaction volume over the past 24 hours was about $3.137 billion, ETH about $1.387 billion, and HYPE about $755 million. Although HYPE's volume is smaller than BTC and ETH, its trading volume relative to its market size is not low, indicating that it remains one of the trading venues with the highest concentration of this round of risk appetite.
The daily line is very hot, but the hourly line has not lost control in sync. Over the past 72 hours, BTC's EMA20 is about $78,682, and EMA50 is about $78,762, with the current price basically wedged between the two moving averages; the hourly RSI is about 54.3, belonging to neutral to slightly strong, not extreme overbought. The recent high for BTC was about $81,299 and the low was about $76,862, and it is still operating within this wide range. In other words, the daily trend is upward, but the short-term is digesting previous gains through sideways movement and fluctuations. This is also the reason for the significant decline in trading volume over the past few days -- the market is waiting for a turnover; those who were supposed to board have boarded, and then the next direction will be determined.
ETH's hourly structure is relatively stronger. EMA20 is about $2,480, EMA50 about $2,476, with the short moving average slightly higher than the long moving average, and the hourly RSI around 58.9. The high and low points over the past 72 hours are approximately $2,534 and $2,407.5, respectively. As long as the price continues to hold above the $2,476–$2,480 range, the short-term can still be considered a strong consolidation; if it cannot quickly recover after falling below, it will need to guard against the market returning to deeper range fluctuations and not cling to the narrative of “one-sided rise.” To put it bluntly, ETH is still looking at BTC's face and is relatively weak. Are there any ETH defenders in the audience?
HYPE's EMA20 is about $81.25, EMA50 about $80.80, with the price still near both moving averages, but the latest hourly trading volume is only about 0.304 times the recent average volume. Decreasing volume itself has no direction; it could either mean reduced sell pressure or that chasing funds have temporarily exited. The judgment method is very simple: if a breakout above the 72-hour high around $83.734 happens, it needs volume support; if a breakout below the average line around $80.8 occurs with increased volume, it indicates that this round's strongest asset is starting to cool off actively. HYPE is the spearhead in this wave, and if even HYPE cools down, the market becomes very dangerous. However, there is not much selling pressure above HYPE, and with positive catalysts from Trump, it can still be viewed with optimism.
So the conclusion is clear: HYPE is hitting highs, BTC is the backbone, and ETH is the drag.
Now let's look at derivatives positions. BTC's notional open interest is about $2.913 billion, ETH about $1.730 billion, and HYPE about $2.089 billion. HYPE's open interest has exceeded ETH, which is a comparison worth noting today: it indicates that a large amount of leveraged positions are concentrated in HYPE, but this does not imply that all this money is long, nor can we call open interest “net inflow.” Open interest only records the size of contracts that have not yet been closed; behind each long position, there’s a corresponding short position, and the direction needs to be viewed in conjunction with funding rates, prices, and address positions. Everyone likes to open positions in HYPE instead of ETH.
At the time of the snapshot, the funding rates for BTC, ETH, and HYPE were all 0.000125, indicating positive values. Positive funding rates indicate that longs are paying shorts, suggesting that the demand for perpetual contracts is relatively stronger; however, this is not direct evidence that “smart money is bullish.” The higher the funding rate, the higher the cost for long positions, and once prices stop rising, crowded longs may actively reduce their positions. The current rate still needs to be observed over a continuous time series; a single time point is more suitable for illustrating the current long-short holding costs.
Let’s look at our smart money to see if your views align. Next, we will enter the address section.
The first address is 0x15a4f009bb324a3fb9e36137136b201e3fe0dfdb. You can copy this address into smart money to track with me. This account has fully capitalized on a wave of growth. This account holds 1,000 BTC long positions, with a notional value of about $78.71 million, and an average entry price of about $62,353.6; it also holds 10,000 ETH long positions, with a notional value of about $24.85 million and an average entry price of about $1,761.94. The total unrealized profit from these two positions is about $23.59 million, and the account's PnL over the past month is about positive $19.88 million. It has earned about $20 million in a month. BTC has been held from about $62,354 to nearly $78,800, and ETH has been held from about $1,762 to nearly $2,492, indicating that it has capitalized on the main segment of the trend in these two directions. Compared to the longs that just chased into the current price, this kind of low-cost account has more patience when facing short-term pullbacks and more space to reduce positions and lock in profits. You can add it to your watch list; when it exits, it might indicate a short-term pullback.
Let’s look at the second smart money address. The second address is 0x634fe24f2f7396f5d967ec3936df04f49a3e6951. It holds about 16.038 BTC long positions with a notional value of about $1.262 million and an average entry price of about $65,100.4; it also holds about 1,675.316 ETH long positions with a notional value of about $4.163 million and an average entry price of about $2,458.24. This account has a PnL of about positive $1.075 million over the past month.
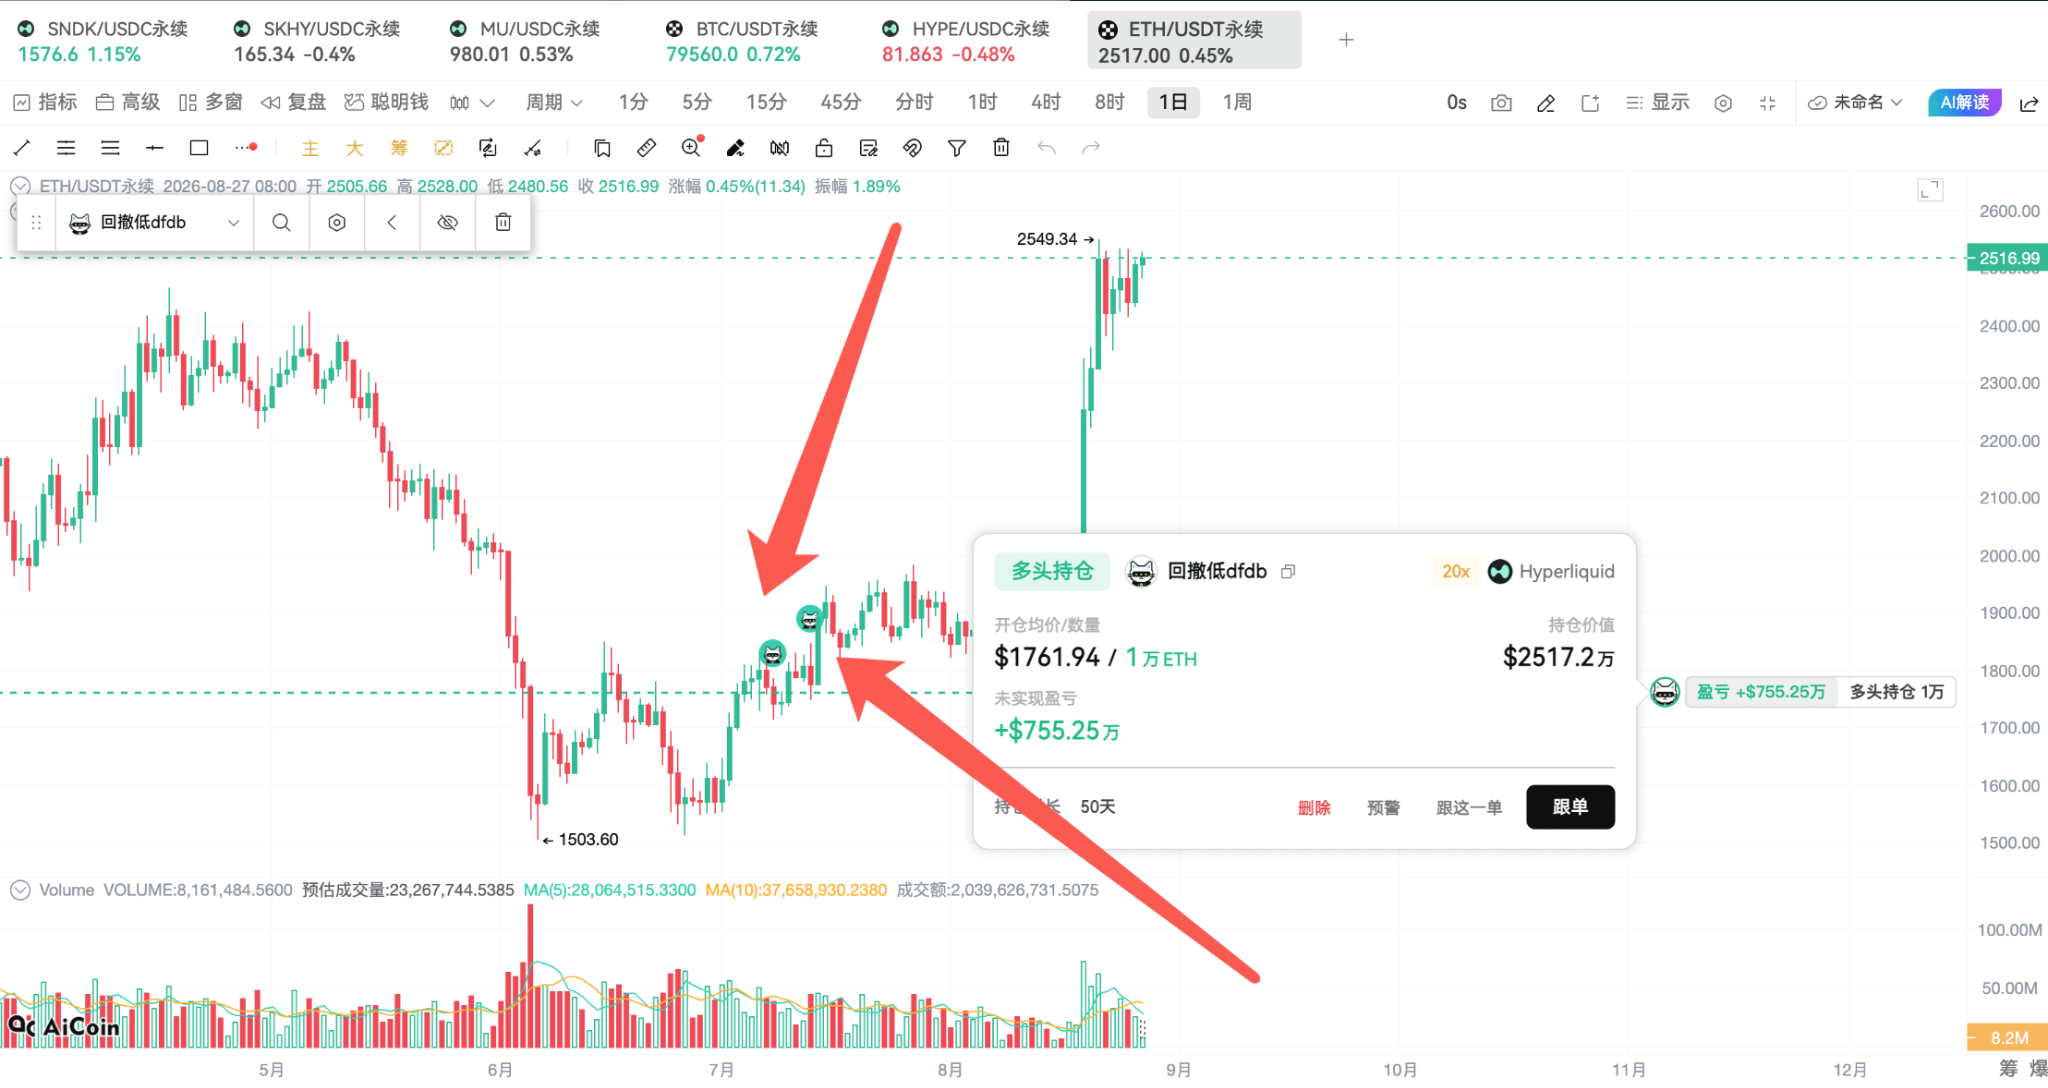 This case is more valuable when viewed together with the previous address. Both accounts hold BTC and ETH long positions simultaneously, but the second account's ETH cost is very close to the current price, resulting in a significantly thinner profit cushion. If ETH continues to stabilize above the hourly average around $2,476–$2,480, this position remains in the upward channel; however, if it falls back below the cost line, the decision pressure faced by this account will be greater than that of the first low-cost whale. The same direction does not imply the same risk; the position cost determines their capacity to withstand fluctuations. This is also an easy point to overlook when observing addresses: it's necessary not just to compare who bought more but also to consider at what position they bought, whether the account was previously profitable, and how significant the position is relative to total assets. A long-term holder with substantial unrealized profits differs greatly in behavior from a high-leverage long that just entered, even if both display green Long on the page. Those trading short-term can pay attention to this address, a typical high-leverage long.
However, the dominance of longs does not mean there are no shorts that can make money. Address 0x396dc3e4d1051837bb559810d2b1ea797775899 holds approximately 55.33 BTC in short positions, with a notional value of about $4.35 million and an average entry price of about $78,521, with an estimated liquidation price around $99,003. It has a PnL of about positive $1.475 million over the past month, and in the last 30 days, BTC trades have totaled 1,657 transactions, realizing a PnL of about positive $1.613 million.
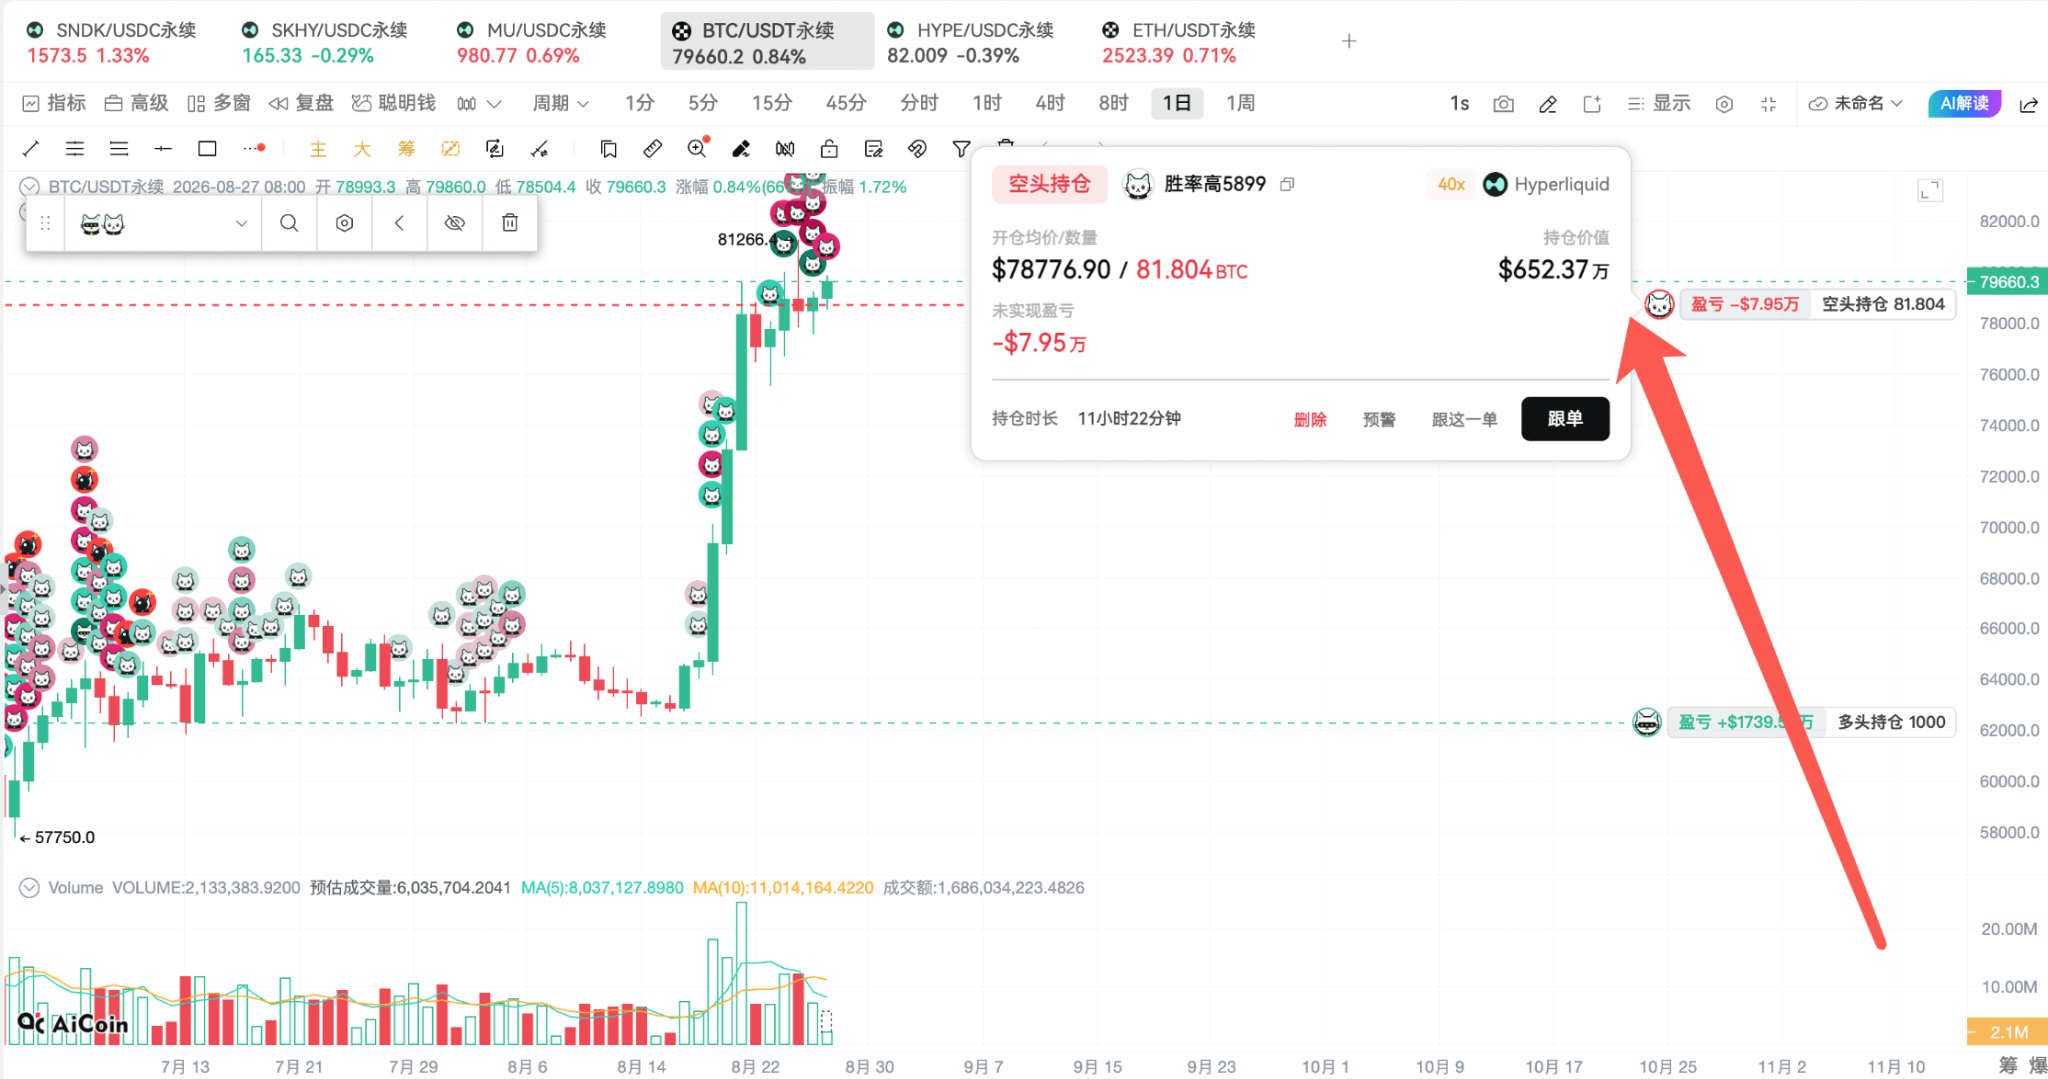
His holding price is near the current price, currently at a slight loss, and short brothers can take a look. He is not simply betting on a “big top” and then lying still, but is frequently adjusting near the current price. In the early hours of August 27, this account continued to open shorts around $78,567–$78,605; at the time of the snapshot, it had placed a reduce-only buy order at $78,299. A reduce-only designation means this buy order will only reduce the existing short position and will not increase the long position. Combining this with the large number of transaction records, it looks more like an active short that repeatedly profits from short-term fluctuations rather than making a singular judgment on BTC's long-term value. He first opened a wave of BTC long positions and has only recently reversed to open shorts. We will see whether those aiming to catch both sides will be eaten by larger whales. 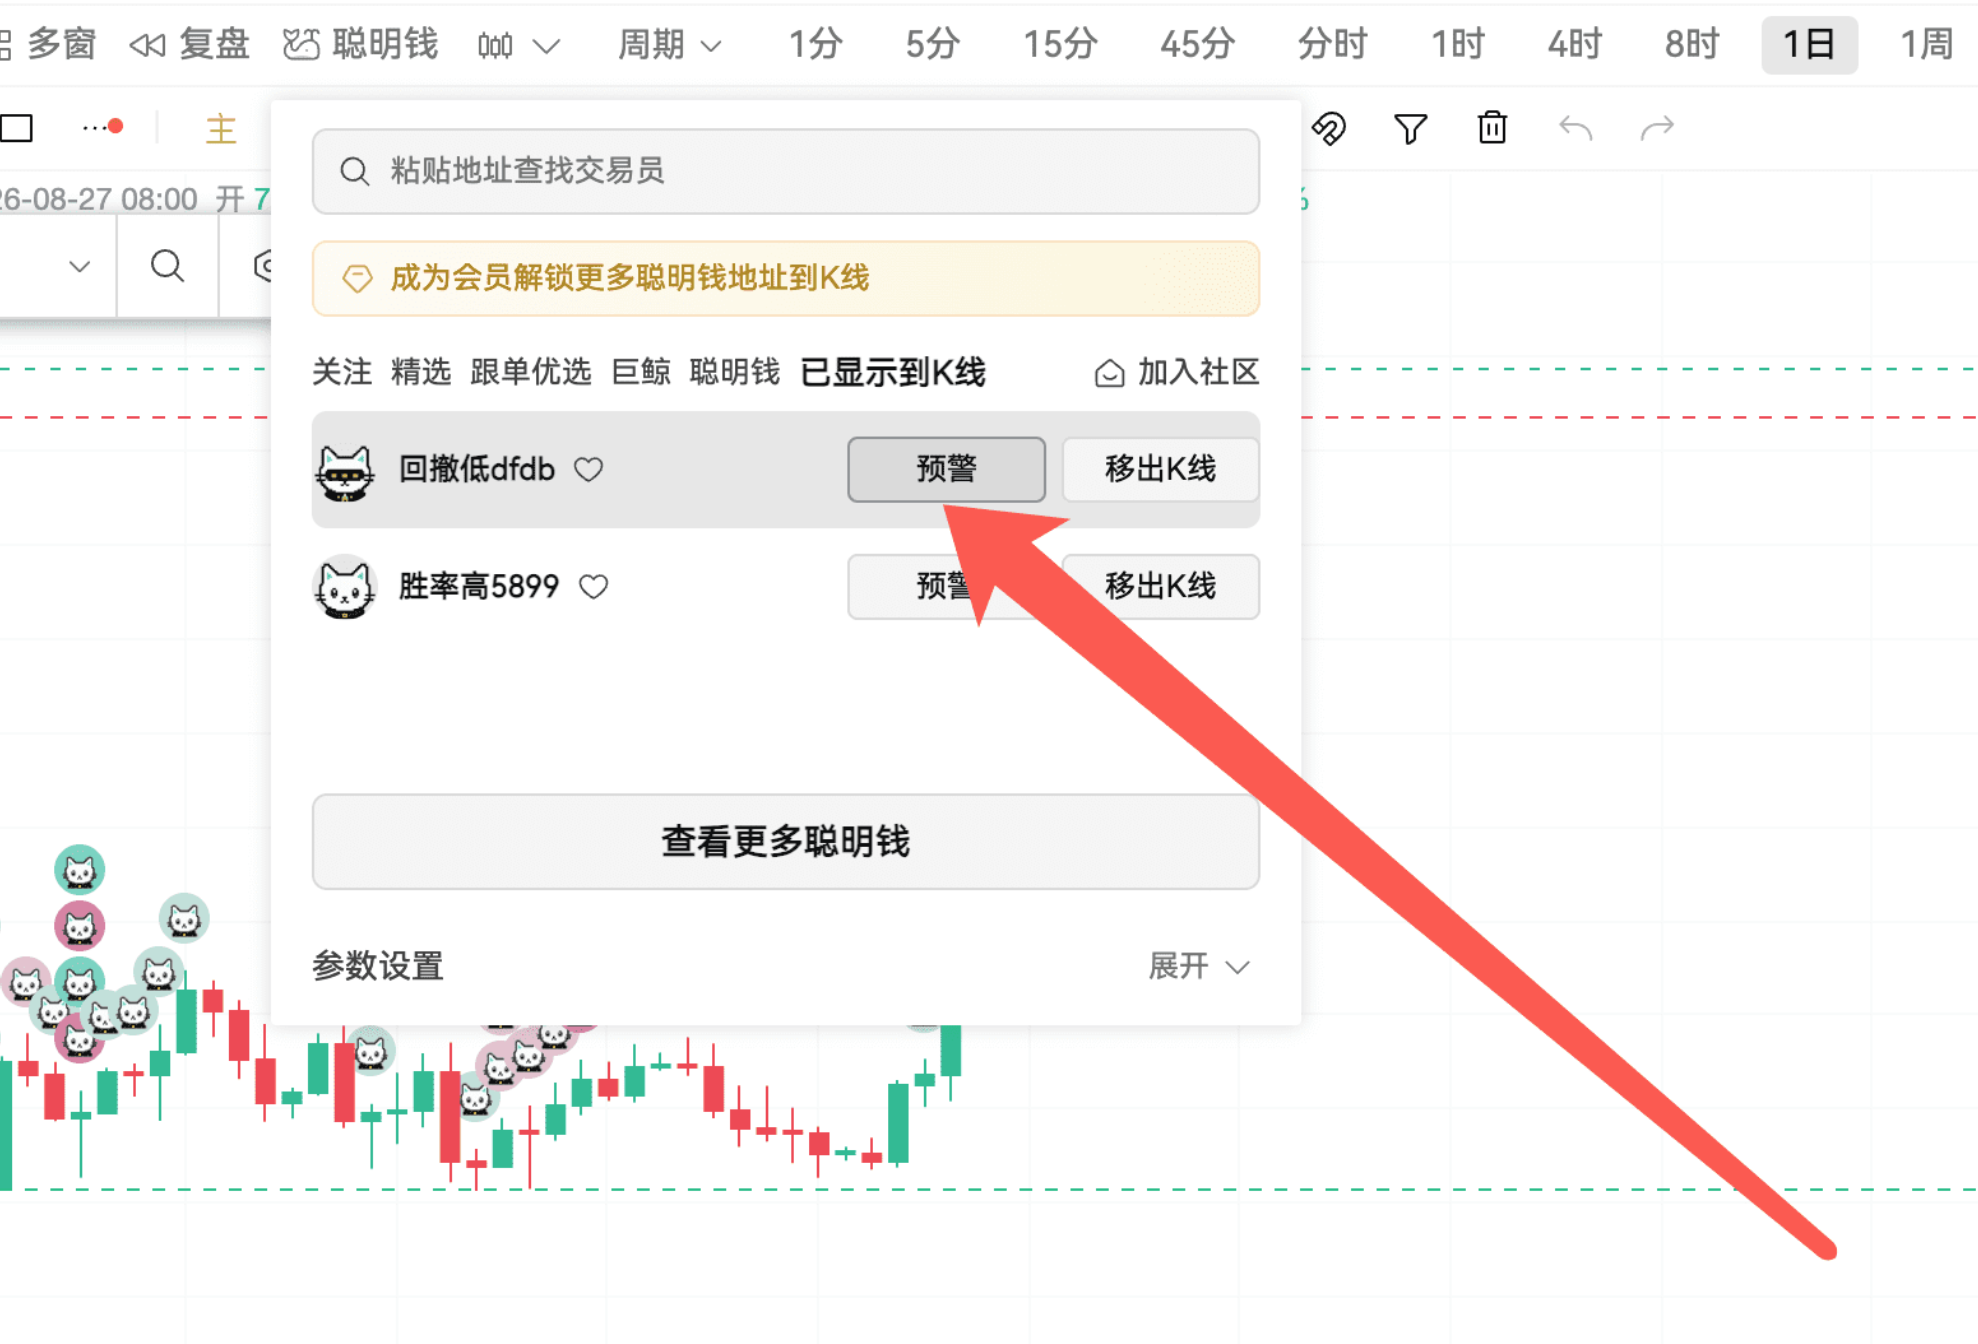 How to observe closures? That's a good question; once added to the K-line, simply click on the alert, and you can see this number's next action.
Did everyone pay attention to Nvidia's earnings report this morning? Apart from the recent rise in the crypto circle, another theme that connects the on-chain with traditional assets today is Nvidia's earnings report. Nvidia reported that its revenue for the second quarter of fiscal year 2027 reached $96.2 billion, an 18% quarter-over-quarter growth and a 106% year-over-year growth; of which, data center revenue was $89 billion, a 117% increase year-over-year. The GAAP and non-GAAP gross margins are both 75.0%, with a GAAP earnings per share of $2.46 and a non-GAAP earnings per share of $2.22. Whether looking at revenue size or growth rate, this is still a strong earnings report.
The company's guidance for third-quarter revenue is $108 billion, with an upward and downward fluctuation of 2%, and a gross margin guidance of about 74.0%, with a fluctuation range of 0.5 percentage points. There is an important detail here: this guidance does not include data center computing revenue from China. The market is digesting not only how much was earned this quarter, but also whether the next quarter can deliver over $100 billion in revenue, whether the gross margin can be maintained at such a large revenue scale, and whether related revenue from China might create additional variables. 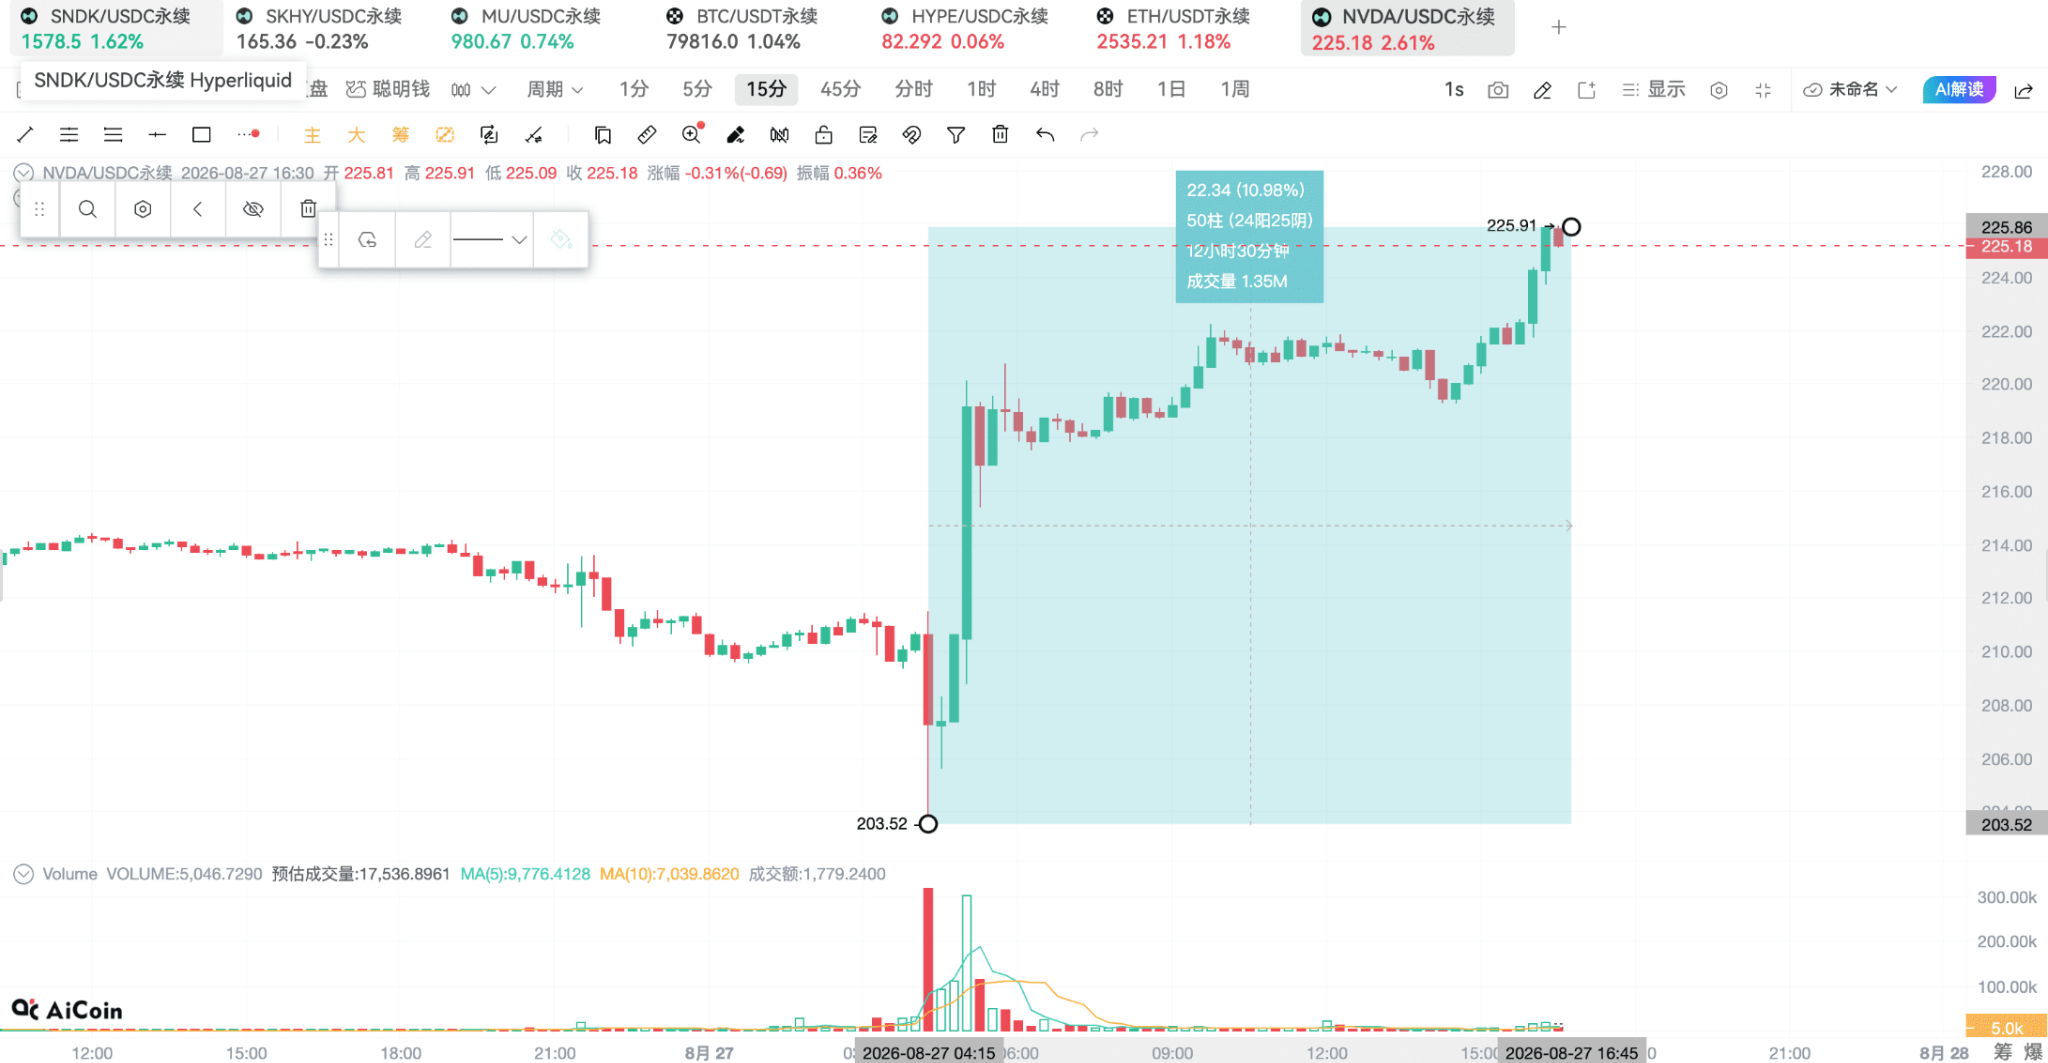
Over the past 72 hours, xyz:NVDA's EMA20 is approximately $217.02, EMA50 around $214.39, with the price still above both moving averages, with a range high of about $222.23 and a low of about $203.52, while the hourly RSI is around 70.7. The price structure is strong after the earnings report, but the short term is already close to the upper range, and momentum indicators have also entered a hotter zone. If it can break out and stabilize above $222.23, it suggests that the market continues to raise expectations; if it rises and then falls back below $217, the chasing funds post-earnings may begin to lock in profits.
Positive funding rates indicate that longs are paying, aligning with the rise after the earnings report, but open interest is still a stock position formed by both longs and shorts. What fits best here is not to say that “on-chain funds knew about the earnings report in advance,” because the current evidence does not support claims of insider or early trading; a more accurate angle is that on-chain perpetual contracts have turned the expectations for US stock earnings reports into positions that can be traded around the clock and with leverage, thereby amplifying price fluctuations and liquidation risks. Earnings reports can be checked on Yahoo, and Aiplot is also a good option; I like to view it on Aiplot.
First, let's look at the long positions for Nvidia at address 0x49e96e255ba418d08e66c35b588e2f2f3766e1d0. At the time of the snapshot, it holds about 14,382.857 shares of xyz:NVDA long positions, with a notional value of about $3.159 million, an average entry price of about $218.519, and an unrealized profit of about $16,410. The account has a PnL of about positive $221,648 over the past month, with a historical cumulative PnL of about positive $9.32 million. The position direction, recent performance, and current price structure are all consistent, thus it can be viewed as a directional long case post-earnings report. 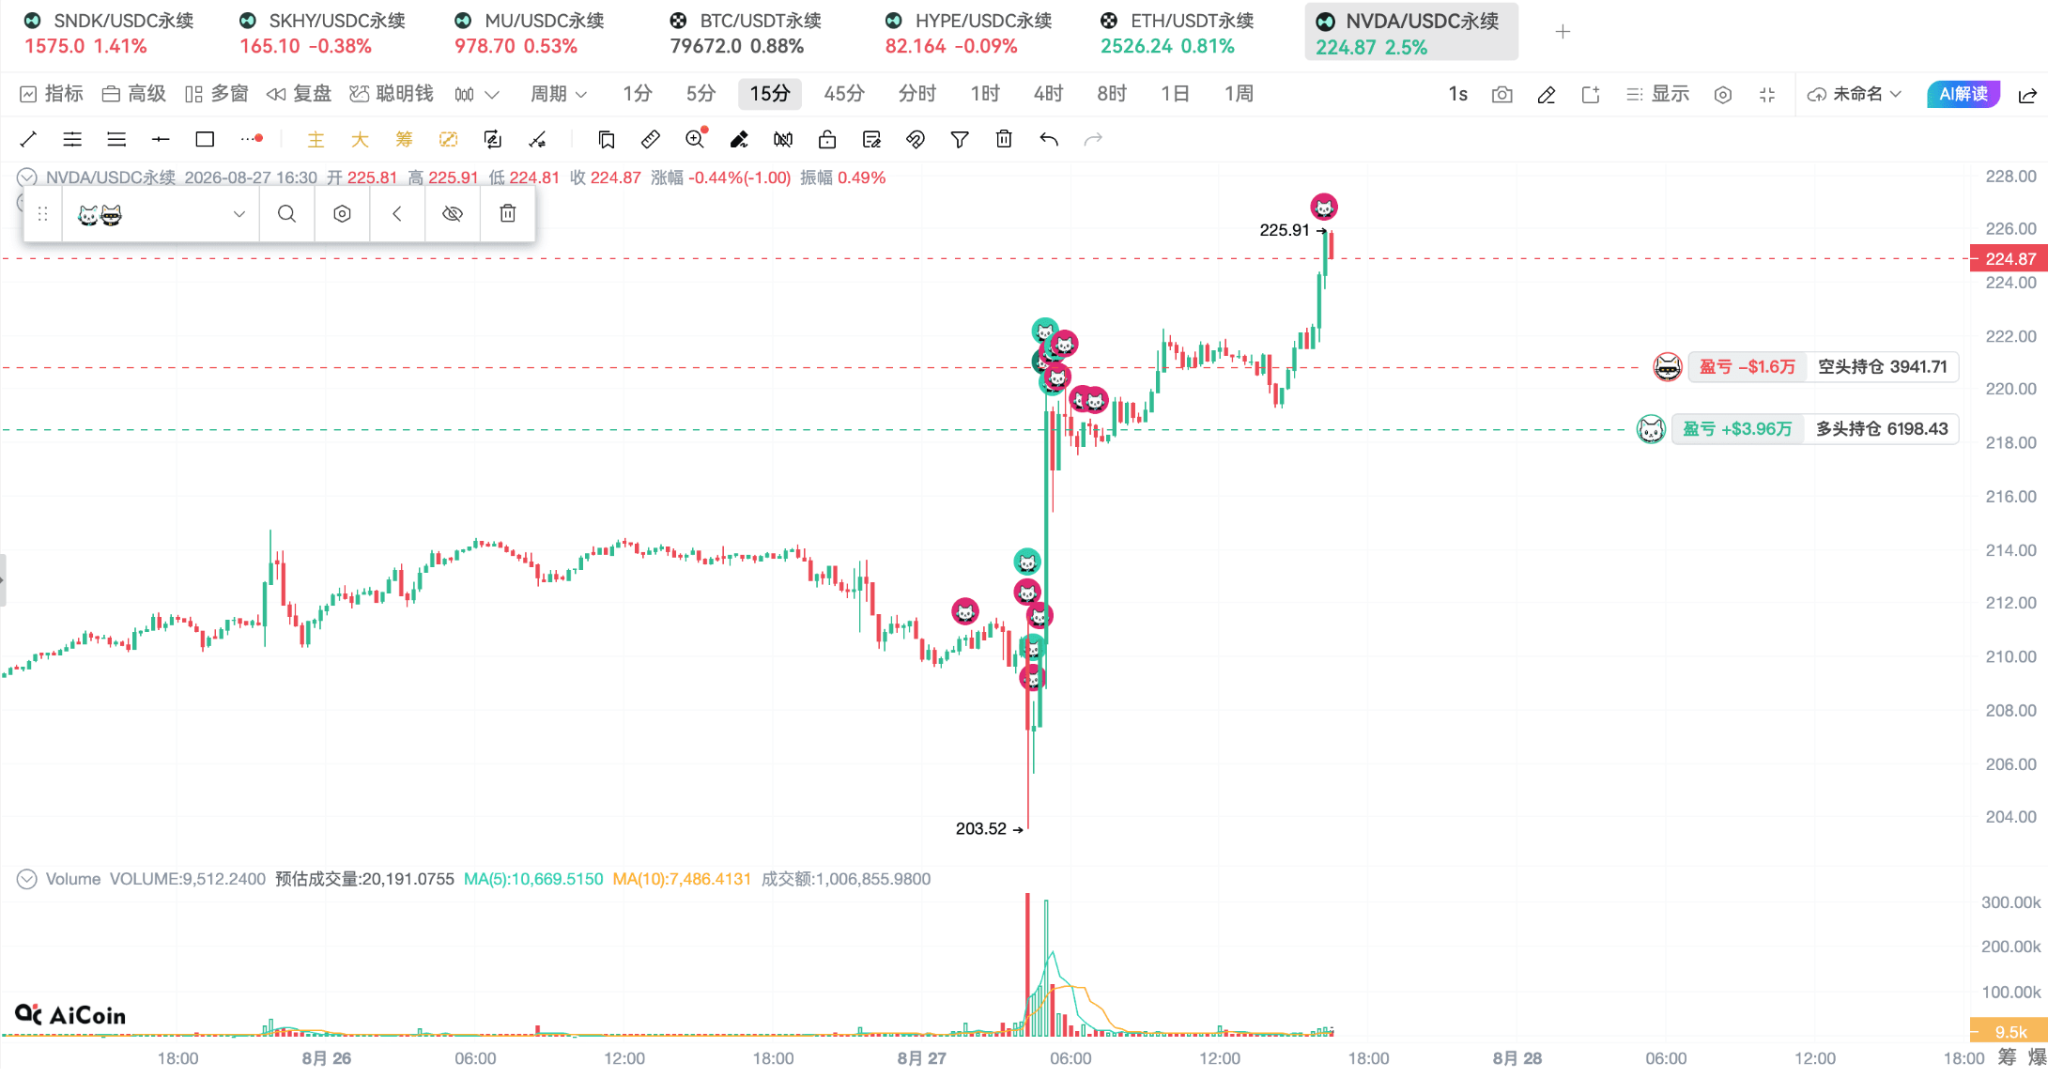
Now is not the time to rush into choosing a direction. If the bull has truly returned, it won’t matter if there are a few hundred points in between. For ETH, pay attention to the hourly moving average range of $2,476–$2,480 and the range low of $2,407.5; for HYPE, watch the moving average range of $80.8–$81.25 and the previous high of $83.734. Any breakout should be analyzed in conjunction with volume; one single spike is not enough. Therefore, I recommend that everyone buy in after the close.
For xyz:NVDA, focus on the short moving average of $217.02, the long moving average of $214.39, and the range high of $222.23. Establishing stability above the previous high will prompt the market to continue trading on growth expectations post-earnings; falling below the two moving averages suggests that the chasing influx from the positive earnings is starting to cool off. In terms of on-chain addresses, it’s important not to mechanically follow positions, as low-cost longs, short-term shorts near current prices, and high-frequency market-making accounts have completely different risk logic, and all positions, unrealized profits, and orders may change during the live broadcast.
Nvidia is the stabilizing force across all capital markets. If it dives at opening tonight, be cautious about the market's risk appetite weakening. After all, if such a strong earnings report causes a decline, what's the reason not to defend?
Currently, there are daily live streams; feel free to continue following the AiCoin friends! Reserve your spot in advance 👇
https://www.aicoin.com/zh-Hans/live/list?tab=upcoming
Join our community to discuss together and become stronger!
Official Telegram community:
AiCoin Chinese Twitter:
Aster Cashback:
https://www.asterdex.com/zh-CN/referral/9C50e2
Hype Cashback:
https://app.hyperliquid.xyz/join/AICOIN88
Binance Cashback:
https://jump.do/zh-Hans/xlink-proxy?id=3 Invitation code: aicoin668
Coinbase Cashback:
https://jump.do/xlink?checkProxy=true&proxyId=25 Invitation code: Y8L23JL
免责声明:本文章仅代表作者个人观点,不代表本平台的立场和观点。本文章仅供信息分享,不构成对任何人的任何投资建议。用户与作者之间的任何争议,与本平台无关。如网页中刊载的文章或图片涉及侵权,请提供相关的权利证明和身份证明发送邮件到support@aicoin.com,本平台相关工作人员将会进行核查。