Cryptocurrency Circle Scholar: On August 31st, Ethereum (ETH) moving averages have all turned upward; how far can this round of rebound go? Latest market analysis reference
The current price of Ethereum is 2475. Watching Ethereum rise sharply, I am conflicted about whether to chase it or wait for a pullback. After a big surge, there are two things to fear: buying high and getting stuck, or missing out and feeling uncomfortable. The market does not go according to everyone's thoughts; when it rises, there are bullish voices everywhere, and as soon as there is a slight pullback, panic spreads immediately. Many people rush into the market after seeing a big bullish candle, ignoring the supporting and resisting pressure behind it, and ultimately end up giving back profits or even incurring losses.
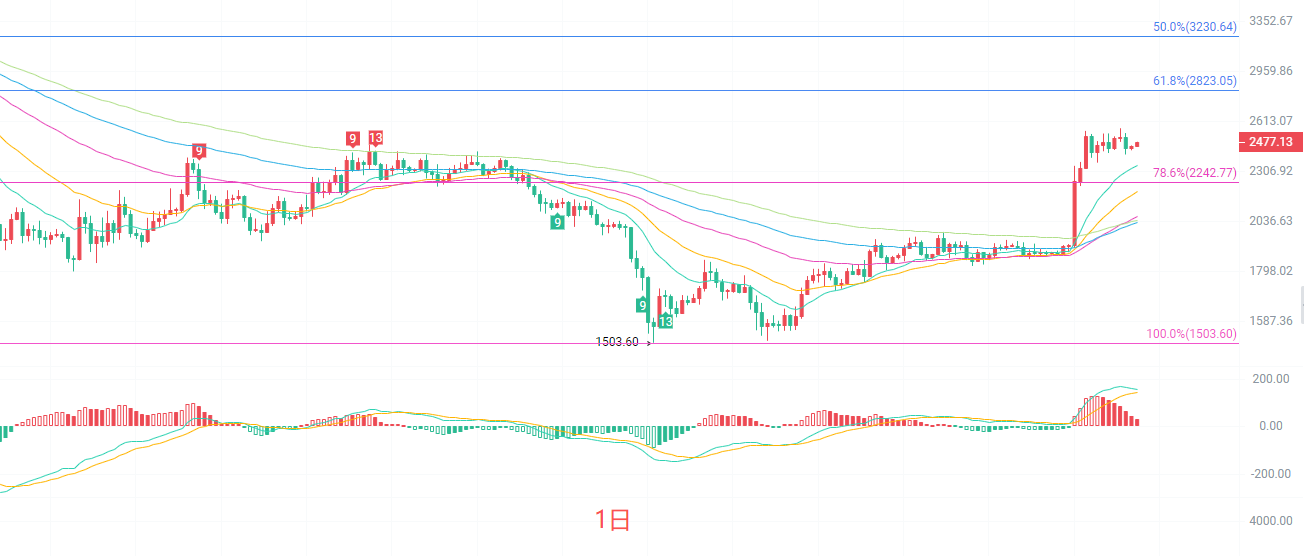
The daily K-line's strong rebound directly stands above multiple EMA moving average systems, with the 15, 30, and 60 periods all turning upward, providing price bottom support. The MACD maintains a bullish range above the zero axis, with red bars contracting, indicating that after continuous rising, bullish momentum is beginning to slow down. The Bollinger Bands are opening upward, with prices running close to the upper band, and the first resistance at Fibonacci 78.6% level in the 2422-2480 range, with further resistance near 2823. The key support lies at 2247, which is also the 78.6% pullback level. The overall trend on the daily chart has turned bullish, but there is a need for a pullback and correction after consecutive increases, making it unsuitable to chase highs directly; waiting for a support retest to reassess opportunities is advisable, while being cautious of the retracement risks brought by a high rush and decline.
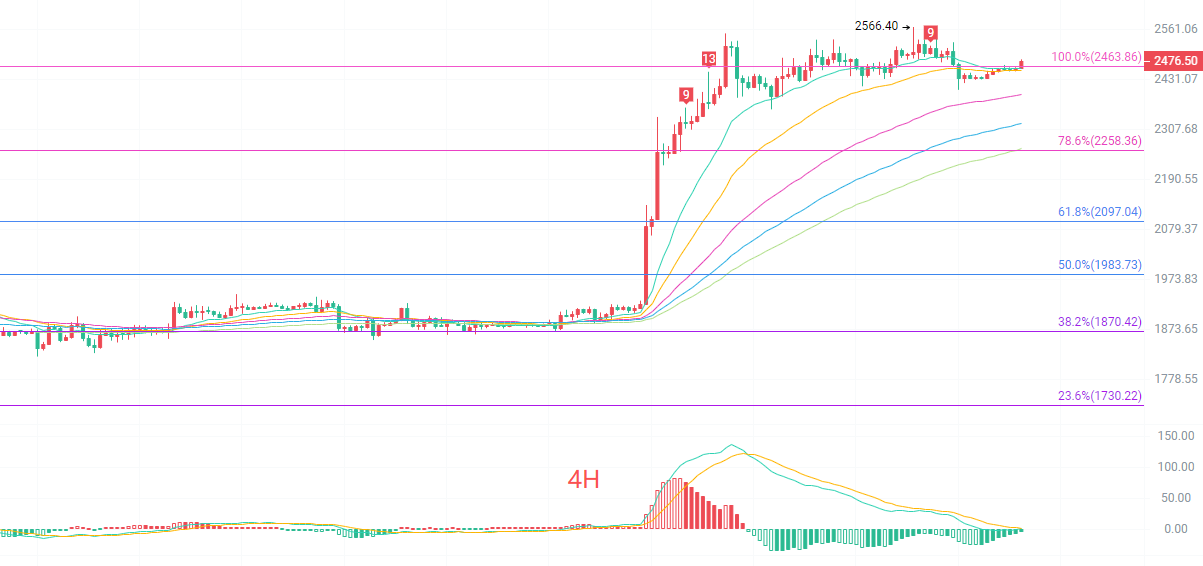
The four-hour K-line reached a high point of 2566 and then began to oscillate at a high level, unable to continue to refresh new highs in the short term. The price remains stable above all EMA moving averages, and the mid-term bullish structure has not been broken, but short-period indicators are beginning to show signs of a top divergence. The MACD's DIF is gradually converging downward towards DEA, and the red bars are disappearing, turning into green bars, indicating that bullish strength in the four-hour level is weakening and entering a consolidation phase. The Bollinger Bands are beginning to narrow; the upper band 2523 forms short-term pressure, while the lower band 2412 is nearby support. The four-hour chart has not directly reversed; it is part of high-level consolidation after a major rise, either oscillating to accumulate strength for further upward movement or retesting moving averages to repair indicators. At this stage, do not blindly be bullish; focus on observing the gains and losses of the 2412 support level. If it holds, the bullish structure remains; if it breaks, a deeper pullback will be initiated.
Short-term reference:
If the lower range of 2440 to 2410 does not break, go bullish, with a stop-loss of 40 points, targeting 2530 to 2620.
If the upper range of 2540 to 2560 does not break, go bearish, with a stop-loss of 40 points, targeting 2500 to 2450.
Specific operations should be based on real-time data from the market; more details can be consulted with the author. The release of the article may have delays, and the suggestions are for reference only; risks are to be borne by the reader.

Warm reminder: The above content is originally created by the author of this public account. Advertisements at the end of the article and in the comments section are unrelated to the author; please be cautious in discerning them. Thank you for reading.
免责声明:本文章仅代表作者个人观点,不代表本平台的立场和观点。本文章仅供信息分享,不构成对任何人的任何投资建议。用户与作者之间的任何争议,与本平台无关。如网页中刊载的文章或图片涉及侵权,请提供相关的权利证明和身份证明发送邮件到support@aicoin.com,本平台相关工作人员将会进行核查。