Dear teammates, today the market news is very lively. BlackRock's crypto ETF raised $230 million in 9 hours, and SATA bought $50 million worth of Bitcoin in a single day. With institutional buying so fierce, Bitcoin has nevertheless fallen below the $80,000 mark. This divergence signal is worth noting; institutions are buying while prices are dropping, which may indicate retail investors are panic selling or that larger funds are using the opportunity to offload. Meanwhile, news about the SEC restarting ICO regulations is also brewing, with the clarification of the regulatory framework likely to suppress speculation in the short term, but being long-term beneficial for compliant projects, although market sentiment is clearly cautious at this moment.
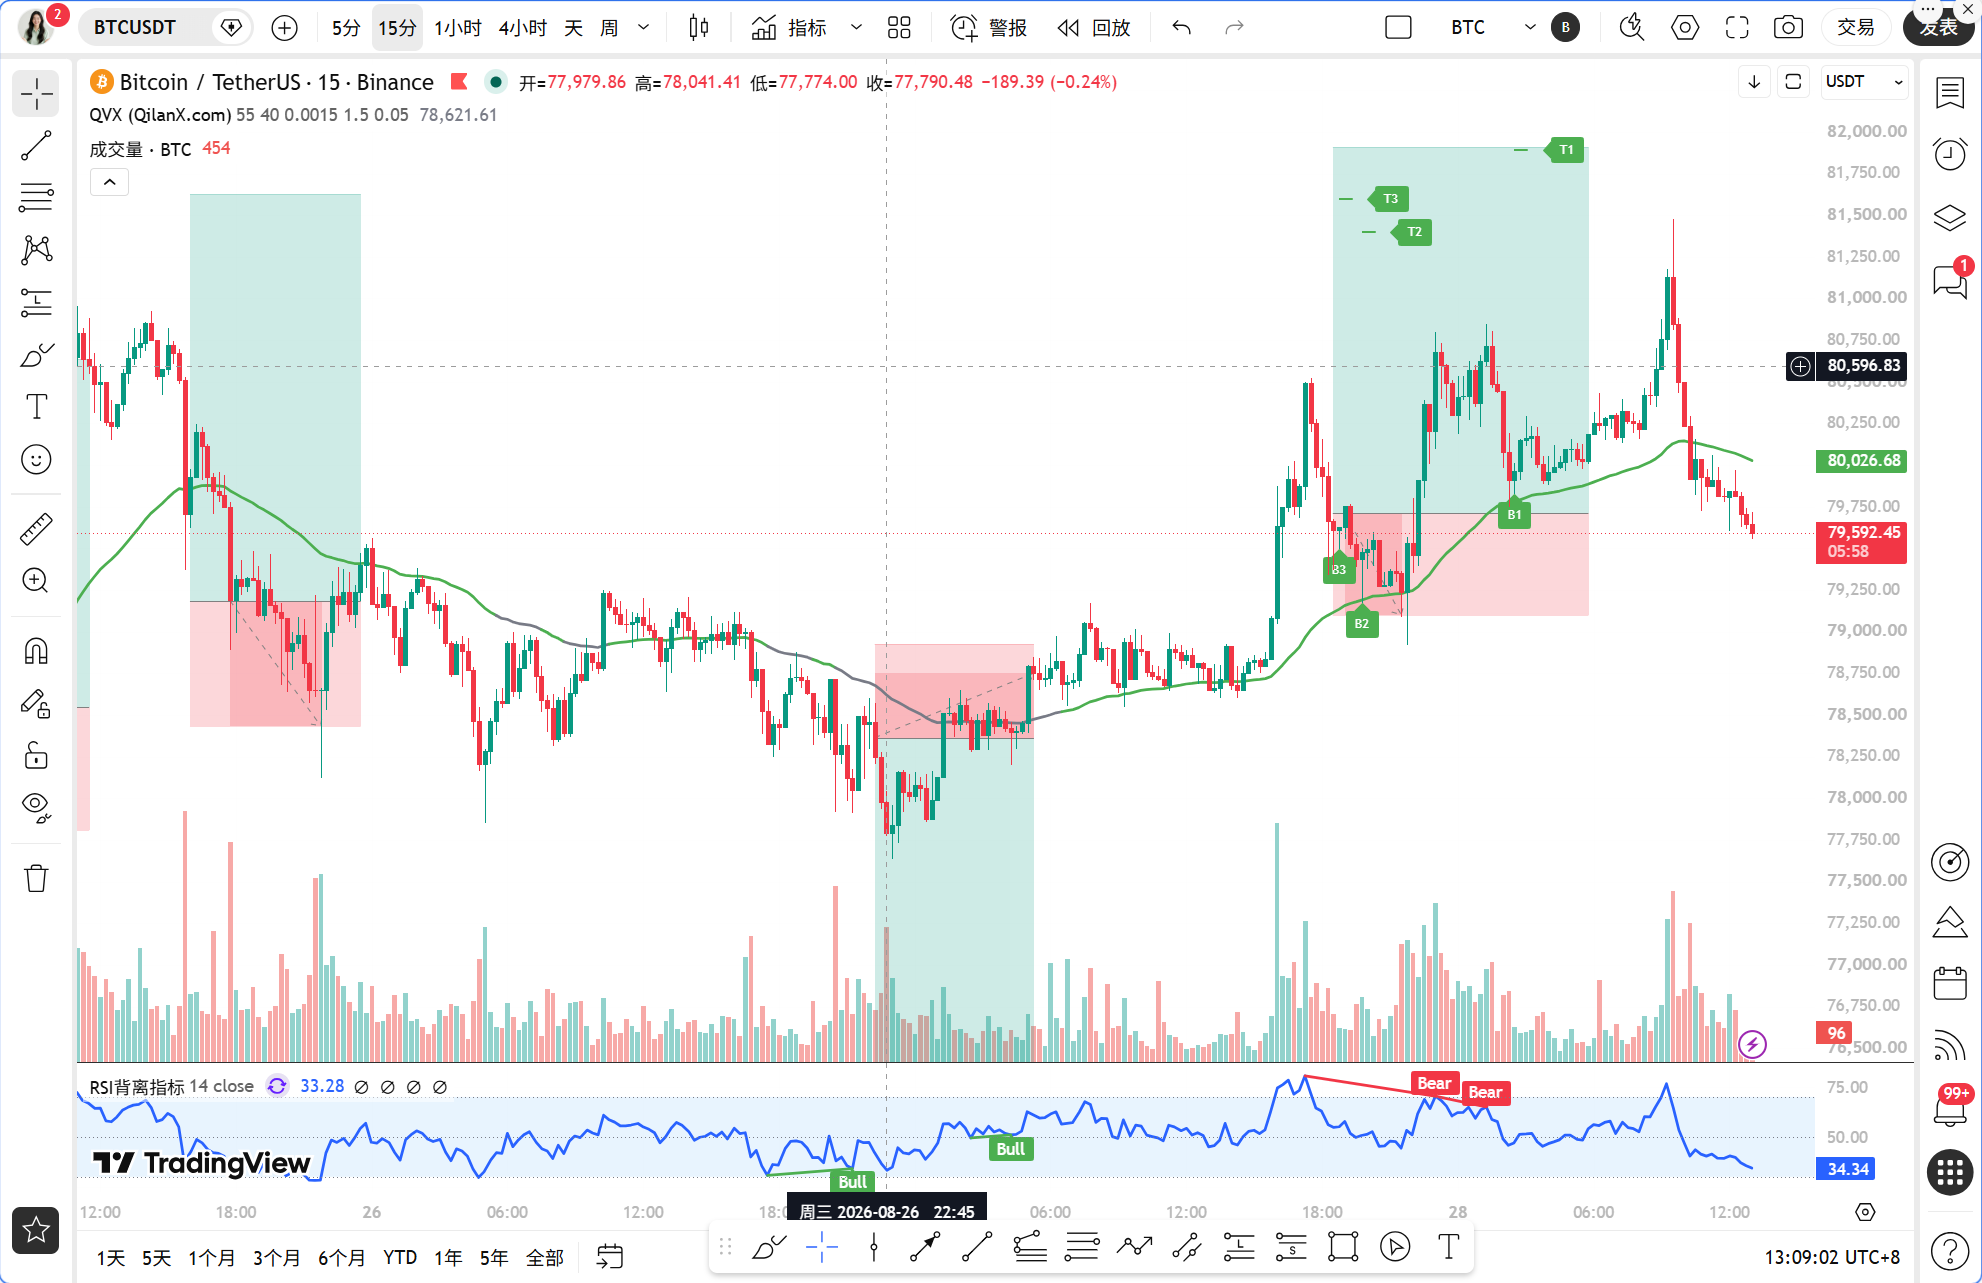
The current time is August 28, 13:09, and Bitcoin is quoted at 79,616 USDT, with a 24-hour increase narrowing to 1.07%. This position is very delicate, as it is less than $400 away from the $80,000 mark, yet it just cannot return, indicating that there is indeed heavy selling pressure above.
First, let's look at the larger timeframes. The daily MACD histogram is still at 1095.73, indicating bullish momentum, but the RSI has soared to 88.28, which is seriously overbought—trading long in this position is extremely risky. MA5 is at 79,284, MA10 is at 77,192, and the price remains above all moving averages, indicating the daily trend remains intact, but short-term pullback pressure is accumulating. The 4-hour MACD histogram is at -104.89, with both DIF and DEA turning down from high positions, and the RSI has dropped to 59.5, which is a normal pullback within a strong range. MA5 is at 79,977, MA10 is at 79,477, and the price is exactly caught between these two moving averages, making the direction unclear. The 1-hour MACD histogram is at -111.88, with DIF crossing below DEA and continuing to weaken, while RSI is only at 35.73, indicating shorts are dominant in the short term. EMA55 is at 79,468.82, and the current price is 79,616, just slightly above EMA55. The 15-minute RSI has dropped to 11.73, extremely oversold, indicating a potential technical rebound at any moment.
Let's verify it with the Qinglan TPV system. Over the past 8 hourly candlesticks, the closing prices greater than EMA55 are 8 out of 8, and the crossover count is 0, theoretically not meeting the oscillation threshold, but the current price is only 0.19% away from EMA55, which is typical line-adjacent volatility, significantly increasing the probability of oscillation. According to system rules, in line-adjacent volatility, do not actively go long or short, only provide a range. The long conditions require the price to close above EMA55 for 2 consecutive hourly candlesticks with support stabilization signals such as long lower shadows or bottom formations, and the MACD histogram must shorten for 2 consecutive periods or the RSI must rebound from the oversold zone. Currently, the 15-minute RSI has reached 11.73, increasing the probability of a short-term oversold rebound, but the 1-hour MACD histogram is still expanding, and the downward momentum has not exhausted, so the long conditions are not satisfied. The short conditions require the price to rebound to the 80,500 to 81,000 range and meet resistance, showing a top formation or long upper shadow on the hourly chart, along with RSI retreating from the overbought zone, allowing for a short entry, with a stop loss set above 81,500 and target at 79,000 to 78,500. If the price directly falls below 79,468 and closes below with 2 consecutive hourly candlesticks, one can go short according to the trend, targeting 78,500. If the price directly rises above 80,500 with increased volume, the short position becomes invalid, requiring confirmation after a pullback before considering a long position.
Risk Warning: The speech by Federal Reserve Chairman Waller tonight is the biggest uncertainty event, and it is recommended to control positions before the speech to avoid being heavily exposed overnight.
Follow Qinglan Crypto Classroom to grasp more trading opportunities! Visit the official website www.qinglan.org
📊 Qinglan TPV Trading Strategy Backtest Reference
🕒 Last Backtest Time 08-28 07:00:02
Total Analysis: 3729 Backtests: 3725 Accuracy Rate: 79.6% (2966/3725)
免责声明:本文章仅代表作者个人观点,不代表本平台的立场和观点。本文章仅供信息分享,不构成对任何人的任何投资建议。用户与作者之间的任何争议,与本平台无关。如网页中刊载的文章或图片涉及侵权,请提供相关的权利证明和身份证明发送邮件到support@aicoin.com,本平台相关工作人员将会进行核查。