Since mid-August, SOL has surged from about $74 to over $100, with an increase of more than 30% in a short period, briefly touching near $103. SOL is becoming one of the few mainstream assets in this cycle that has the triple support of price momentum, institutional funds, and ecological fundamentals. However, as the price rose above $100, market structure began to change. On one hand, ETFs and some long-term funds continue to increase their exposure to SOL, while on the other hand, some short-term funds have begun to take profits and even establish short positions in the $100—$103 region, indicating that SOL has transitioned from a simple upward trend to a discrepancy phase where bullish fundamentals coexist with short-term profit-taking.
Above $100, SOL is undergoing a real stress test
SOL maintained a bottom oscillation near $74 around August 17 and then launched a strong rebound, quickly breaking through the key psychological levels of $80 and $90, and testing the $102—$103 resistance zone twice on August 22 and 25. As of the close on August 26, SOL stabilized at $102.09, marking that the price has regained the key psychological and technical level of $100.
From a technical perspective, $100—$103 has become the core area of contention between bulls and bears. Given that this range has previously faced selling pressure multiple times, it is widely regarded as a strong resistance level in the short term. If SOL can effectively hold above $103 on the 4-hour candlestick level, it will open up upward potential extending to the $106—$110 range; conversely, if it falls below the $96—$97 defense line, it would indicate weakening buying support after the breakout, and the market may seek second support around $93—$95.
The $100—$103 range has formed a significant supply zone, with the market digesting the accumulated profits from the previous rapid increase through a time-for-space approach.
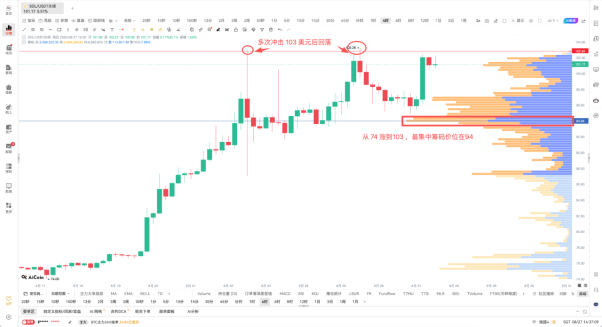
(AiCoin market data shows that SOL is currently in the key resistance area of $100—$103)
ETFs are becoming one of the most important sources of incremental funds in this round of increase
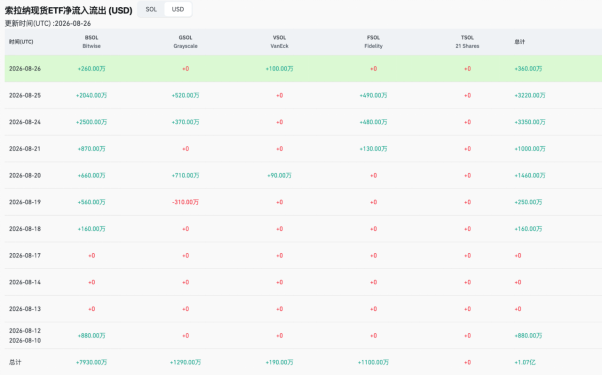
SOL's recent rise has a clear timing synchronicity with the ongoing influx of funds into the U.S. spot Solana ETFs.
As of August 24, the daily net inflow into the U.S. spot Solana ETF reached $33.5 million, the largest single-day net inflow since 2026. It has recorded fund inflows for five consecutive trading days, bringing the cumulative net inflow into the U.S. spot Solana ETF to about $1.22 billion.
Among them, Bitwise's BSOL still dominates. On August 24, BSOL had a daily net inflow of about $25 million, and since its launch, the cumulative net inflow has reached about $948.2 million, accounting for about 80% of the cumulative fund inflow into the U.S. spot Solana ETF.
Additionally, Bitwise disclosed that the fund inflow from the first two trading days of this week was about $45 million, bringing its management size close to $1 billion. Meanwhile, BSOL's daily trading volume reached approximately $108.65 million, setting a historical high for the product.
On-chain fundamentals are also strengthening SOL's long-term narrative
If the inflow of ETF funds answers the question of "who is buying SOL on the fund side", then Solana's recent on-chain network data provides a supportive logic from the perspective of "why buy SOL from a fundamental standpoint".
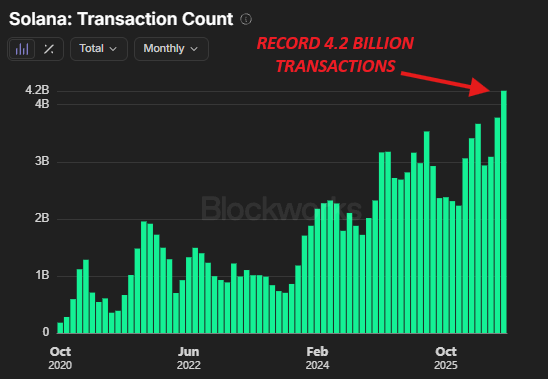
1. Non-voting transaction volume hits an all-time high, with real network demand strong
Monthly and weekly breakthroughs: Solana processed approximately 4.2 billion non-voting transactions in July, a year-on-year increase of about 13.5%, and a substantial growth of about 91% compared to December 2025, creating a historical monthly high. Entering August, from August 17 to 23, the single-week non-voting transaction volume further reached 1.318 billion, remaining above the 1 billion mark for several consecutive weeks.
Clarifying the data's significance: Compared to the total number of transactions (Total Transactions) that includes consensus costs for validators, non-voting transactions mainly encompass Token transfers, smart contract interactions, NFT/Meme minting, and DeFi transactions, which can more truly and noiselessly reflect actual economic activity (Real Economic Activity) at the end-user and application level.
2. Ecological diversification evolution: RWA and real-world asset accumulation The tokenization scale of real-world assets (RWA) on the Solana blockchain has approached $4 billion, showing a continuous expansion trend. This indicates that Solana's on-chain application scenarios are gradually shifting from early reliance on Meme coin trading to structured expansions into high-retention, high-value areas like RWA, native stablecoins, and institutional-class DeFi.
3. Meme ecology revival: Active liquidity and speculative attributes coexist Parallel to the application layer accumulation is the strong revival of the Meme market. As of the week of August 26, the on-chain spot trading volume of Meme coins on Solana surged to approximately $5.2 billion, setting a new single-week record since 2026 and reaching the highest level since November 2025.
Institutional long bets on Solana are further increasing
Another signal from the institutional level comes from DeFi Development Corp.
This Nasdaq-listed company currently holds about 2.3 million SOL, valued at about $208 million, and launched a real-time data platform called "State of Solana" on August 26 to track indicators such as the Solana market, staking, validators, yields, and ecological activity.
At the same time, the BankChain Alliance, composed of 39 state banking associations, announced the establishment of a bank-led blockchain network, planning to support financial applications such as tokenized deposits, stablecoins, and automated settlements, which provides potential institutional application space for high-performance public chains like Solana.
Moreover, the THORChain 3.20 upgrade has prepared relevant technical improvements for restoring Solana trading, further expanding interoperability between Solana and other chains.
These factors collectively constitute what differentiates SOL from mere Meme assets: it is simultaneously receiving attention from financial products, corporate asset allocation, stablecoins, DeFi, and infrastructure levels.
However, smart money has not reached a complete consensus
Even as ETF funds continue to flow in and on-chain ecological fundamentals remain strong, the long-term bullish logic is clear, yet on-chain derivative positions indicate that short-term leading funds have not reached a complete consensus on the market's direction, displaying obvious characteristics of "bull-bear confrontation" and "hedging trades".
1. Trend Bulls: High-leverage large accounts firmly hold positions
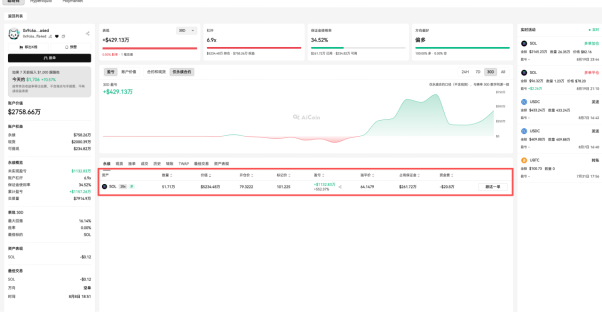
An on-chain address 0x9c6a...a4ed previously established a long position in SOL with 20x leverage (average opening price around $79.32) and realized an unrealized profit of about $11.63 million in 18 days.
Even after SOL broke the $100 barrier, this address has not chosen to take profits, indicating that some high-winning-rate, high-risk-tolerant swing funds remain firmly betting on the continuation of the trend.
2. Institutional Short Exposure: Market making and cross-asset hedging
Wintermute (market maker inventory and liquidity hedging): Leading market maker Wintermute's overall nominal short position on the Hyperliquid platform has risen to approximately $211.5 million, including about $17.63 million in SOL short positions.
Abraxas Capital (arbitrage and long-short hedging): Abraxas Capital also holds a large short position in crypto assets, with on-chain publicly available data showing its SOL short position is about $9.35 million (previously in a floating loss situation).
If you wish to further track such on-chain capital behaviors, you can directly obtain related data through the API: https://www.aicoin.com/zh-Hans/opendata , suitable for quantitative research or automated monitoring.
So, what stage is SOL currently in?
Considering price, funding, and on-chain fundamentals, SOL's current rise is not simply a short-term pulse driven by market sentiment: the ongoing attraction of institutional fund inflows into the spot ETF, along with resonating on-chain trading volumes, RWA accumulation, and Meme liquidity, provide substantial fundamental support for the price.
However, after experiencing a rapid rebound of over 30%, the selling pressure in the $100—$103 resistance zone is significant, and short-term capital discrepancies are severe, with some leveraged funds beginning to take profits or engage in derivative hedging.
Thus, a more accurate qualitative assertion at this moment is: the medium-term fundamental trend for SOL remains positive, but in the short term, it has entered a phase of high discrepancy for capital digestion.
If SOL can break through and hold above $103 with significant volume in the future, the market will start targeting around $110 and even higher; if it cannot effectively break through $103, whether $94—$98 can become a new strong support will determine whether this round of increase enters a high-level consolidation or experiences a deeper technical correction.
Join our community, let's discuss, and become stronger together!
Official Telegram community:
AiCoin Chinese Twitter:
Group chat - Wealth Group:
https://www.aicoin.com/link/chat?cid=10013
免责声明:本文章仅代表作者个人观点,不代表本平台的立场和观点。本文章仅供信息分享,不构成对任何人的任何投资建议。用户与作者之间的任何争议,与本平台无关。如网页中刊载的文章或图片涉及侵权,请提供相关的权利证明和身份证明发送邮件到support@aicoin.com,本平台相关工作人员将会进行核查。