You're just going to have to trust me on this...
But the data is all correct.
Bear with me...
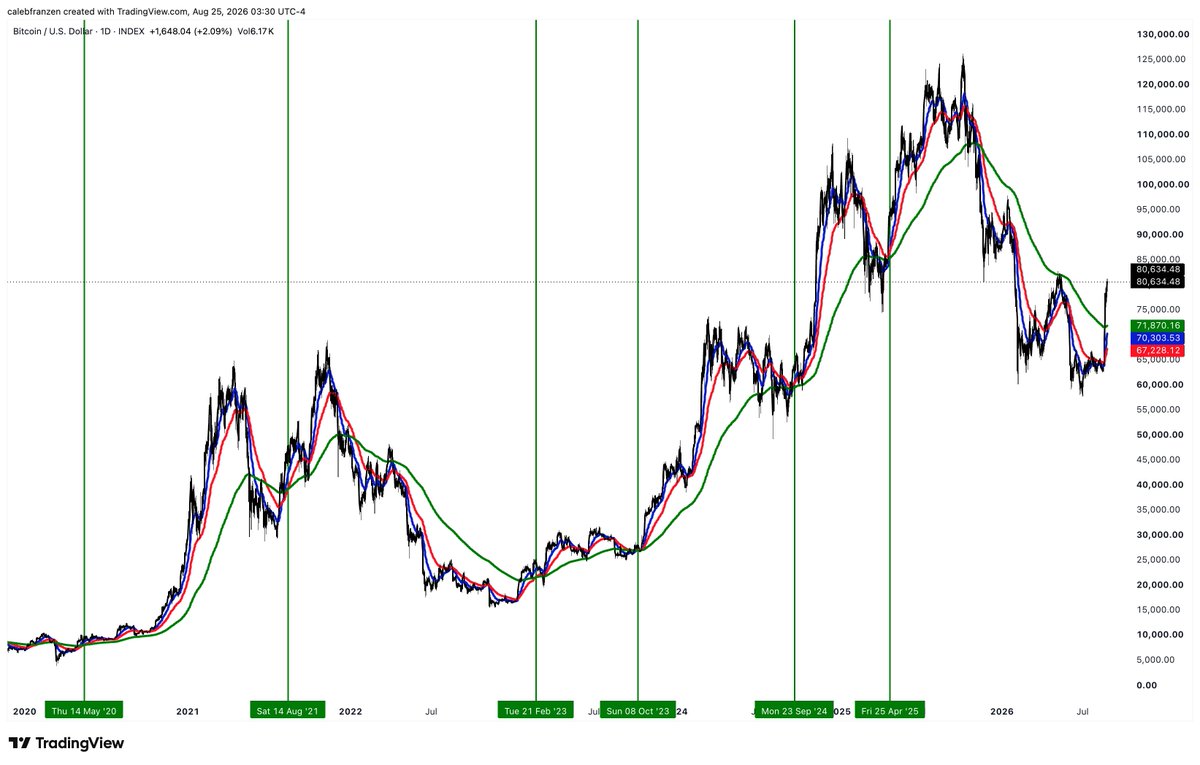
I'm using the:
🔵 21-day EMA
🔴 55-day EMA
🟢 200-day EMA
I've highlighted every single time since 2020 when:
The 21-day EMA is above the 55-day EMA and the 55-day EMA is above the 200-day EMA, but only AFTER the 21-day EMA traded below the 200-day EMA.
Why is this so significant?
It's uptrend confirmation.
By definition, if an asset is in an uptrend, the price of the asset will trade above its average price over XYZ timeframe.
We can take it a step further...
Uptrends should have a short-term average trade above a medium-term average, and both should trade above the long-term average.
That's what these 3 EMAs are accomplishing.
Right now, this bullish crossover hasn't occurred... yet!
Once it happens, you should pay attention.
Why?
The average 6-month return after this signal is +45.35%.
Only one of six cases had a negative 6M return, which was "only" -9.8%.
Do whatever you want with this information.
免责声明:本文章仅代表作者个人观点,不代表本平台的立场和观点。本文章仅供信息分享,不构成对任何人的任何投资建议。用户与作者之间的任何争议,与本平台无关。如网页中刊载的文章或图片涉及侵权,请提供相关的权利证明和身份证明发送邮件到support@aicoin.com,本平台相关工作人员将会进行核查。


