Brothers, let me ask you a question first: Recently, have you become confused by the Bitcoin market situation?
In just three days, Bitcoin jumped directly from 62800, violently rising close to the 80000 mark!
This wave of market activity can be said to be a historic short squeeze, combined with the newly implemented regulatory framework by the U.S. SEC, creating a double benefit that pushed the market to a new height.
Today, we will analyze from four core dimensions: market data, macro logic, on-chain signals, and Wyckoff structure. At the same time, we will answer the most concerned question of everyone: Is 57800 really the ultimate bottom of this bear market? And how exactly should we layout next?

First part, let’s look at the real-time market. In summary: The breakout confirmation is valid, but it is clearly overheating in the short term, so caution is necessary.
On August 21, Bitcoin peaked around 79000, and is currently oscillating in the 77000 range. This round has firmly stabilized at the key position of 72000 to 73000, which is the upper edge of the historical chip accumulation area from March 2024, as well as the core upward trend line at the weekly level.
Remember: this is not a false spike; it is a solid bullish candle maintaining its position, indicating an effective breakout.
However, short-term overheating signals have reached their peak. Currently, the funding rate has hit the highest record in the past 20 months; the last time this level was seen was when Bitcoin surged to 102000 in 2025.
Looking at market sentiment, the retail long-short ratio has soared to 2.22, while the whale's long-short ratio is only 1.47, indicating a clear divergence in sentiment.
The most exaggerated is the data; over the past 24 hours, the entire crypto market has seen over 3.3 billion dollars in liquidations, of which shorts account for 3 billion, making this one of the largest short squeeze events in crypto history. Here, I remind everyone: This extreme short squeeze market has limited sustainability for subsequent bullish buying; do not blindly chase high prices.
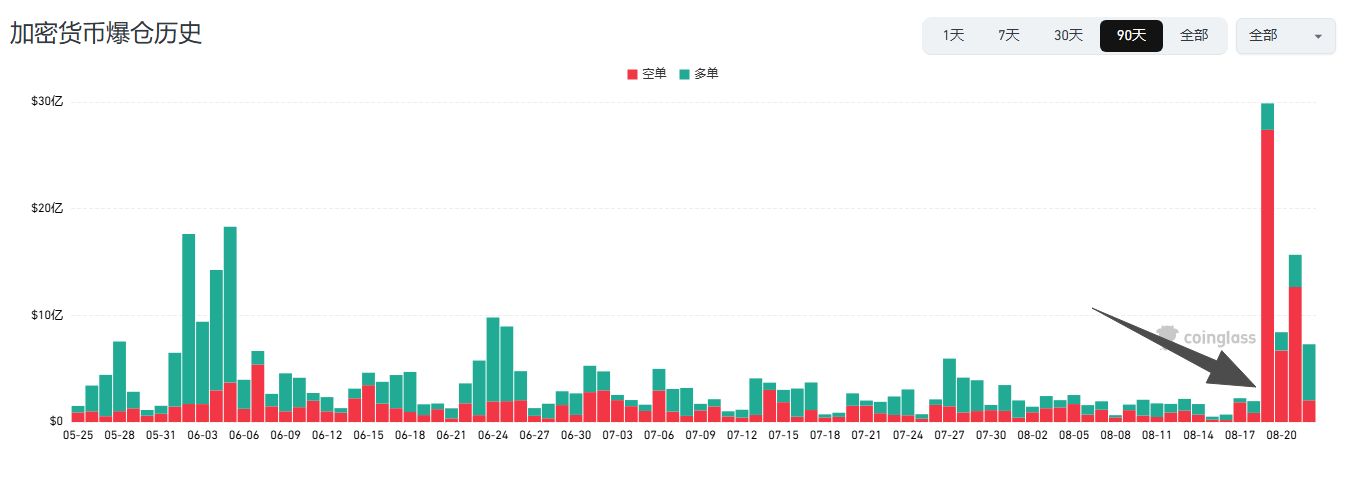
In the second part, we discuss the core logic. This wave of violent rise is not triggered by a single positive factor but is the result of three strong positive factors stacked together.
First, the U.S. raised the long-term treasury bond subscription size, increasing the single operation limit from 2 billion to over 4 billion dollars, which directly lowers long-term U.S. bond yields and releases ample liquidity for global risk assets, providing a macro foundation for the rise of Bitcoin.
Second, the U.S. SEC has officially implemented a customized regulatory framework for crypto assets, introducing a financing mechanism of up to 75 million dollars and conditional safe harbor rules. This means that the U.S. crypto market has completely bid farewell to the chaotic situation of "using enforcement instead of regulation" in the past, marking the beginning of a compliance era and giving the market the biggest reassurance.
Third, as we mentioned before, the epic short squeeze. The market strongly absorbed the 3 billion short positions, and after the price broke through key resistance, a positive feedback cycle of short stop-loss was triggered, causing prices to rise further, leading to a complete market surge.
The third part addresses the most concerning question: Is 57800 the true bottom of this bear market?
Let’s not beat around the bush; I will directly state my personal view. Considering macro, on-chain, and historical patterns from three dimensions, 57800 is very likely the ultimate effective bottom of this bear market.
Firstly, looking from the macro perspective, all conditions for a bear market bottom have now been met. The CPI and PPI data from July have both confirmed that inflation is continuing to weaken, and retail data is also cooling down, leading to increasing market expectations for a rate cut by the Federal Reserve in September.
At the same time, Bitcoin has built a strong support in the 65000 range. Various negative concerns that were previously worrying everyone have been fully digested by the market, reducing the price's sensitivity to negative news significantly, which is the most typical signal of a gradually solidifying bottom area.
Next, looking at crucial on-chain data, bottom signals have been completely realized. Currently, there are 3.57 million Bitcoins that have not moved for over ten years, accounting for 17.7% of the entire circulating supply. The total holdings of long-term holders are close to the historical peak, with only 58,000 left to reach that peak.
Simply put, market chips are extremely scarce, and both retail and major investors are holding back on selling.
More critically, regarding the behaviors of large holders, in the past 60 days, Bitcoin whales have cumulatively increased their holdings by 43,000 coins, valued at 2.75 billion dollars, completely ending the net selling trend that lasted for several months. The 30-day spot demand indicator has also quickly rebounded from deep negative values and is about to turn positive, indicating a full return of spot bottom-seeking demand.
Lastly, examining historical cycle patterns, Bitcoin's maximum retracement from the historical high of 126198 dollars in 2025 is nearly 50%, and the current bear market has been ongoing for 317 days. Compared to the average cycle of 383 days for bear markets in crypto, the downturn has lasted long enough. Coupled with the analysis from top institutions like Bernstein, the bottom range corresponds strongly with the position of 57800, solidifying the bottom.
In the fourth part, we use the professional Wyckoff accumulation structure to validate the bottom logic once again.
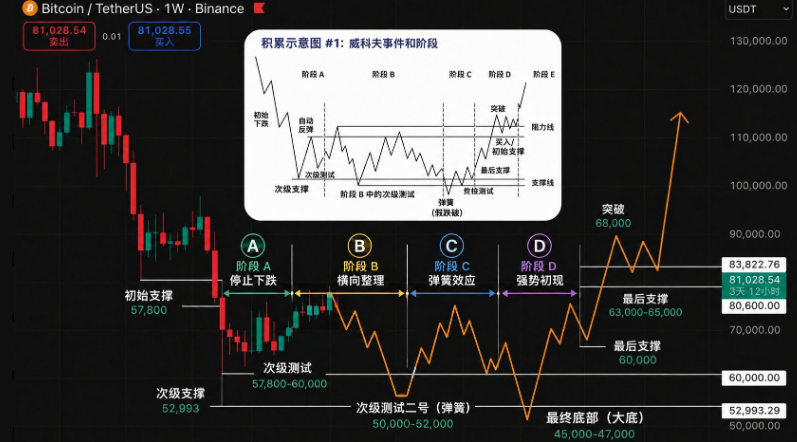
The entire movement perfectly fits the classic Wyckoff bottoming pattern:
Phase A stops falling: From February to April, the market oscillated between 60,000 and 70,000, with the 60,000 mark forming the ultimate support, completing the first stop of the decline.
Phase B sideways accumulation: From April to June, the market surged and subsequently dropped sharply to 57800, which is a typical secondary test specifically to validate the strength of the previous support at the bottom, which is also our core bottom for this round.
Phase C spring effect: From June 22 to now, the market has rebounded from 57800, making a run for the 80,000 mark, which is still ongoing. According to the Wyckoff structure, after the spring effect, there is a high probability of a retest for the ultimate test to confirm effective support.
Phase D breakout confirmation: This has not officially materialized yet; it requires a significant volume to stabilize above the 83000 to 83300 resistance mark, and a weekly closure must be completed before it can be considered as truly initiating a bull market. The previously anticipated deep bottom in the range of 50,000 to 52,000 does not seem to have much chance of being reached now.
The fifth part, which is also the most concerning: After the market rises, how will it retest? Please look at the diagram below:
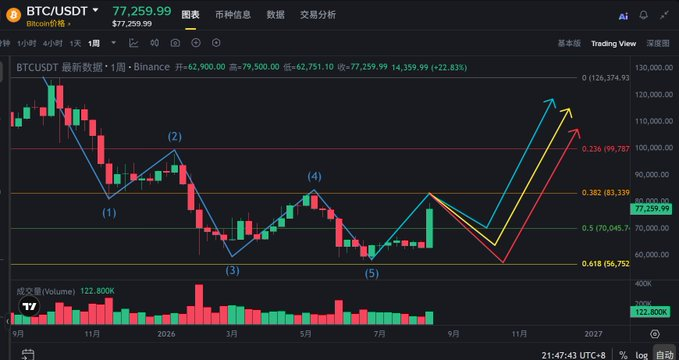
The first blue path has a 45% probability and is also the trajectory I personally favor the most.
The market slightly retraces to the 70000 to 70500 range, without breaking the previous low at 62751, quickly stabilizing on reduced volume. This is the strongest bullish trend; as long as the 70,000 mark is held, the bottom is thoroughly confirmed. Subsequent breakthrough at 83339 will allow for right-side entry, with stop-loss set below 68000, the first target being 99787 and the second target 113000. As long as the ETF continues to see net inflows and U.S. stock sentiment remains stable, this trajectory is basically secured.
The second yellow path has a 35% probability.
The market undergoes a phased correction, retracing to the 63000 to 63500 range, re-testing previous low support, forming a standard W double-bottom structure. This kind of movement usually corresponds to slight macro disturbances, such as hawkish comments from the Federal Reserve or short-term data fluctuations. The layout logic remains the same; upon breaking through 83339, enter accordingly, with a stop-loss below 61000, and the upper targets remain unchanged.
The third red path has only a 20% probability, which is an extreme retracement trajectory.
The market briefly fakes a breakdown, retracing to the 57800 to 58500 range, creating a trap for short positions but will not break the extreme support at 56752. This kind of movement can only occur with a significant decline in the U.S. stock market, escalating geopolitical risks, or intensifying institutional sell-offs. Once it quickly recovers above 62751, it will present an excellent bottom-buying opportunity, with a stop-loss placed below 56500.
Here, I have summarized all the key price levels; I recommend everyone save this:
83339, the formal breakout confirmation line of the bull market;
77097, the current market price;
70000-70500, the optimal retracement entry position;
63000-63500, the standard double bottom retracement position;
57800-58500, the extreme bottom retracement position;
62751, the last defense line for bulls;
99787, 113000, the core target levels for this bull market.
Lastly, let me mention the three necessary conditions for the bull market to start; none can be omitted.
First, the weekly level effectively stabilizes above 83339, completing the Wyckoff phase D breakout;
Second, continuous net inflows of ETF funds must occur to eliminate one-day wave patterns;
Third, stablecoin inflow back into exchanges must happen, allowing incremental retail funds to enter.
Currently, the first condition is being validated, the second is slowly recovering, and the third is still awaiting signals.
In summary: I personally prioritize the blue path with slight retracement, not chasing highs, nor guessing tops, but patiently waiting for opportunities. If it stabilizes on a retracement at 72000-73000, one can try to go long with a small position; a reduced volume retracement around 70000 is the highest-quality entry opportunity for this round, with a unified stop-loss placed below 68000.
Once the subsequent volume stabilizes above the 83300 mark, it can be thoroughly confirmed that a new round of bull market has officially begun.
The end of the bear market is the starting point for the bull market. You must seize this opportunity in this cycle!
Important Notification: The last wave of entry opportunity
Today, we are releasing 20 membership discount spots for August. The first phase of Bitcoin’s start has already ignited, winning at the starting line; if you missed it, please follow the subsequent steps closely!
Join the super member/group via the new contact channel: Seagull, which can be directly downloaded from major app stores, search ID: 9225075 to find me.
Valuable content takes effort; please like, share, and follow for synchronized operations.
Market review does not constitute investment advice; cryptocurrency is highly volatile, and contract trading carries extreme risks, please manage your positions reasonably.
WeChat Official Account: Big Bull Says Market
免责声明:本文章仅代表作者个人观点,不代表本平台的立场和观点。本文章仅供信息分享,不构成对任何人的任何投资建议。用户与作者之间的任何争议,与本平台无关。如网页中刊载的文章或图片涉及侵权,请提供相关的权利证明和身份证明发送邮件到support@aicoin.com,本平台相关工作人员将会进行核查。


