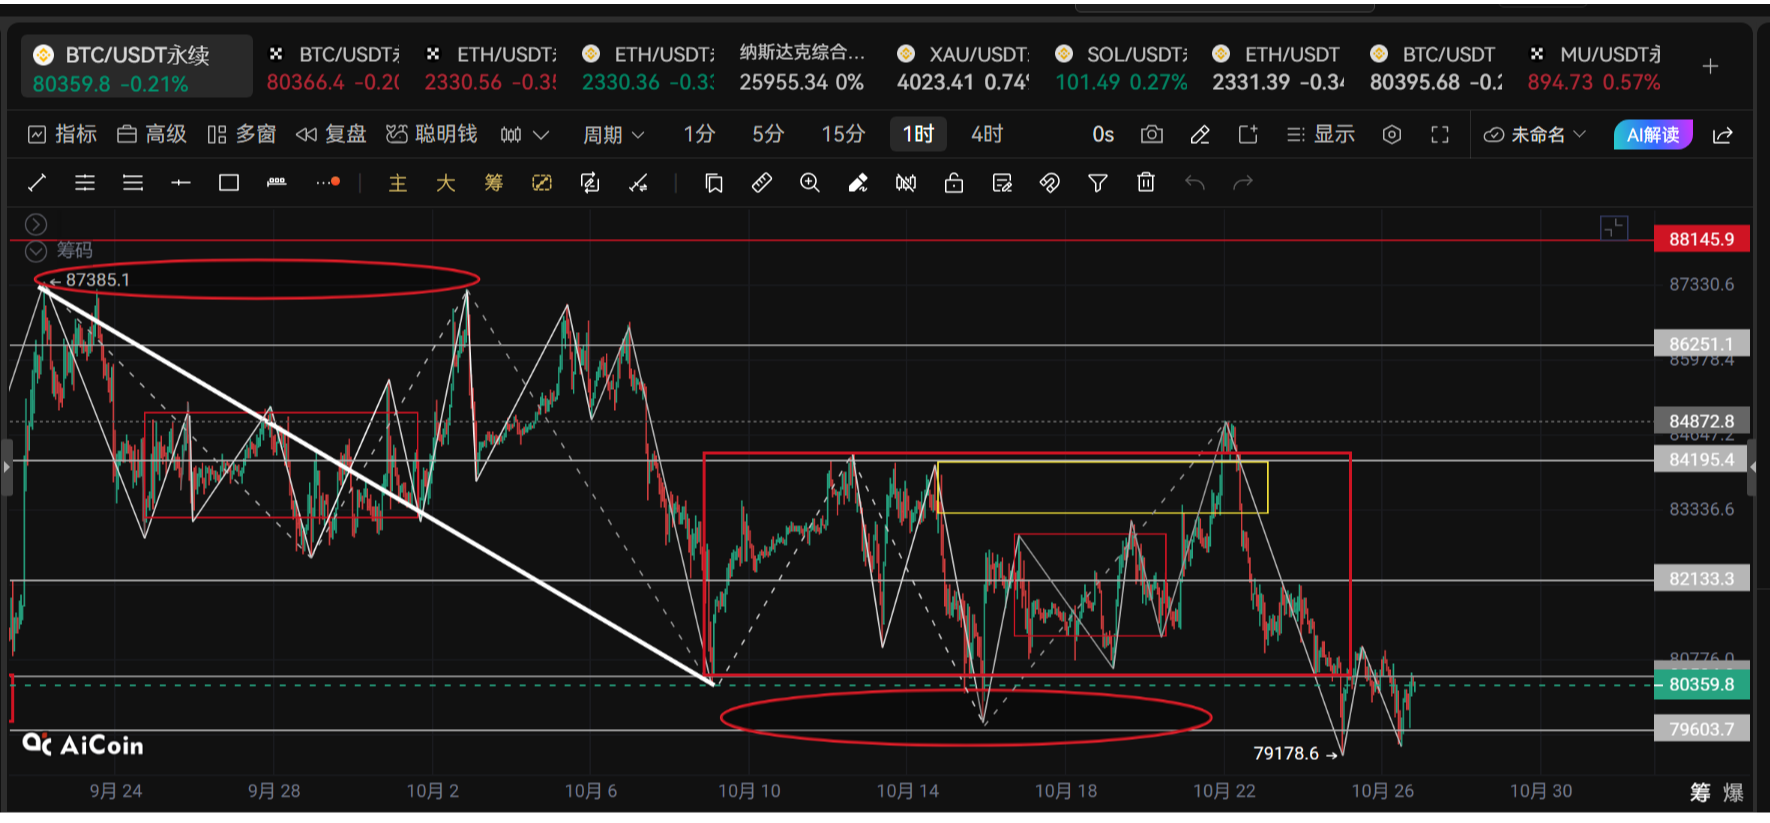
On Tuesday, Bitcoin rose by 645 points, increasing nearly 1500 points. The previous text mentioned that the price would inevitably rise, and the overnight surge accurately reached the target. So how do we see today? We can look at the following analysis.
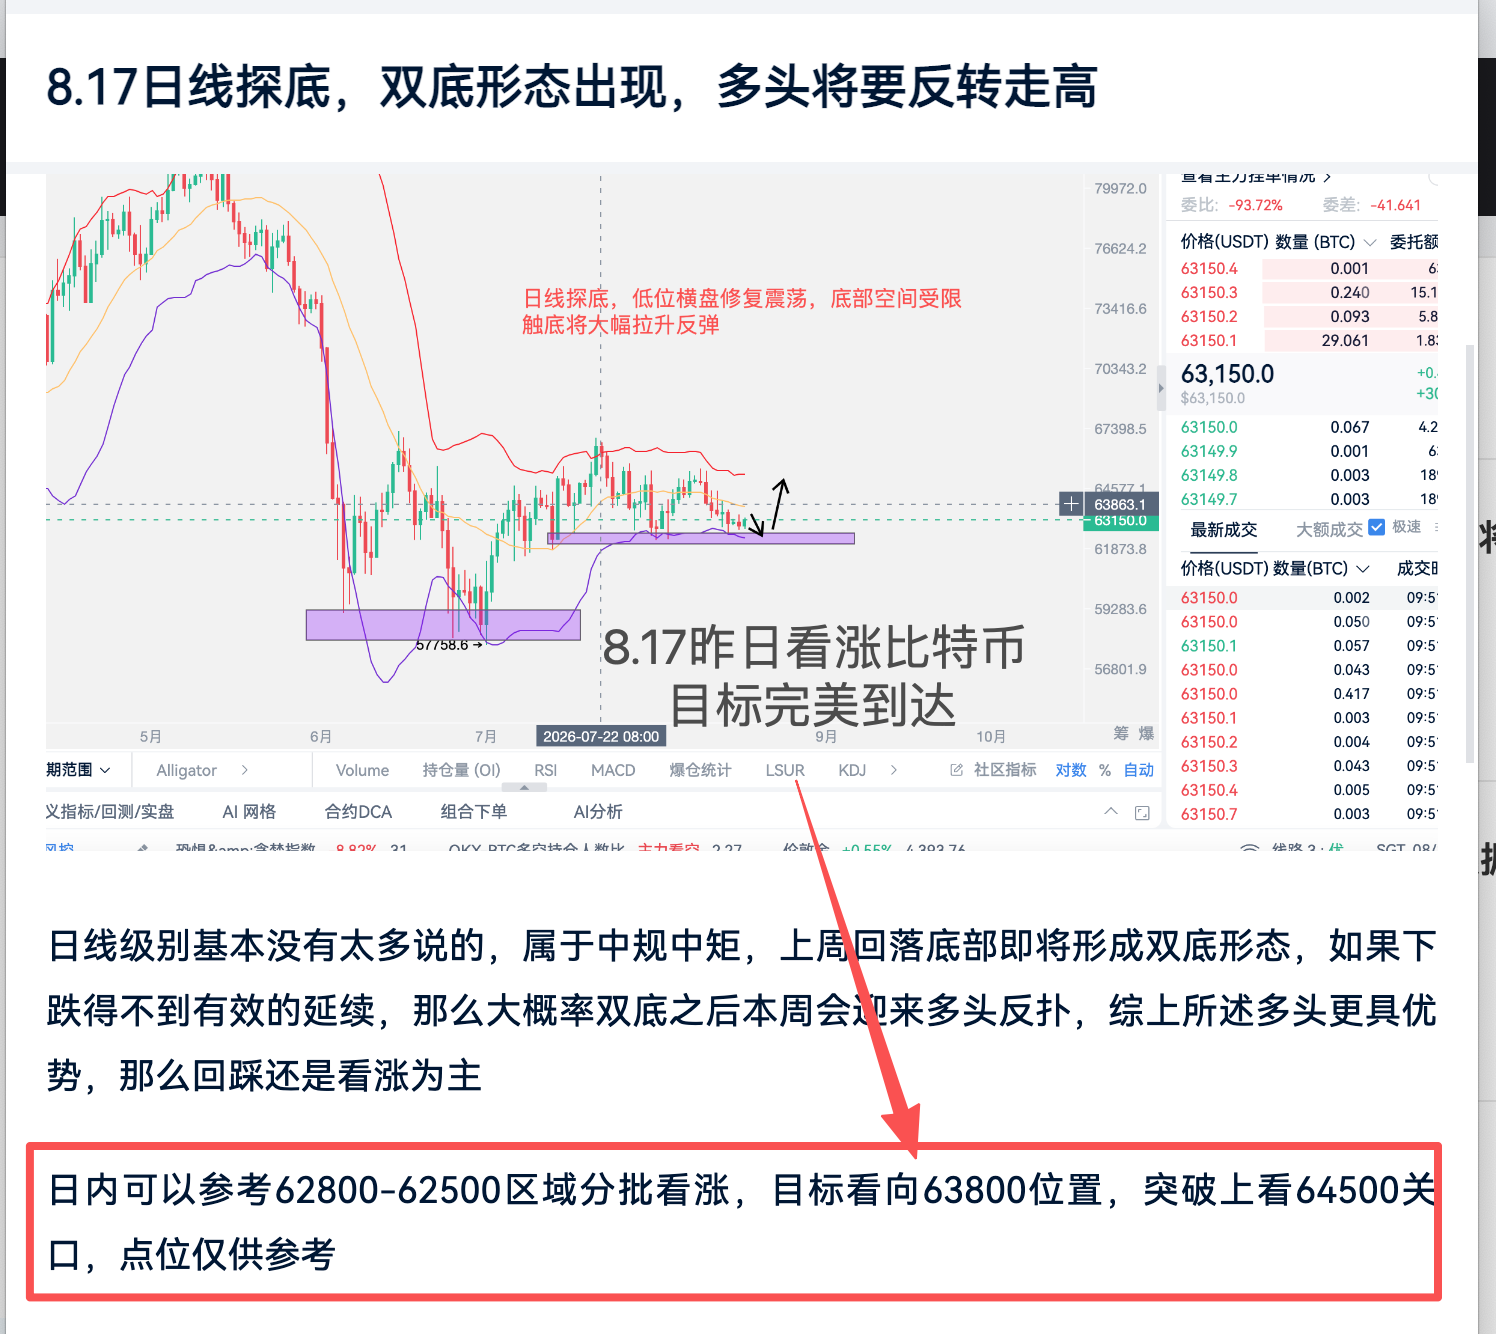
The four-hour K-line level shows six consecutive upward candles, breaking through the upper Bollinger Band channel. After peaking, it has produced a bearish candle. Everyone must not think this is a signal of reversal and decline. In fact, this is a normal pullback after the rise. Only after stabilizing the pullback within the upward channel can there be a better continuation of the rise. Therefore, we can consider the middle line as the current support point, and if it pulls back near this position, one can consider entering bullish.
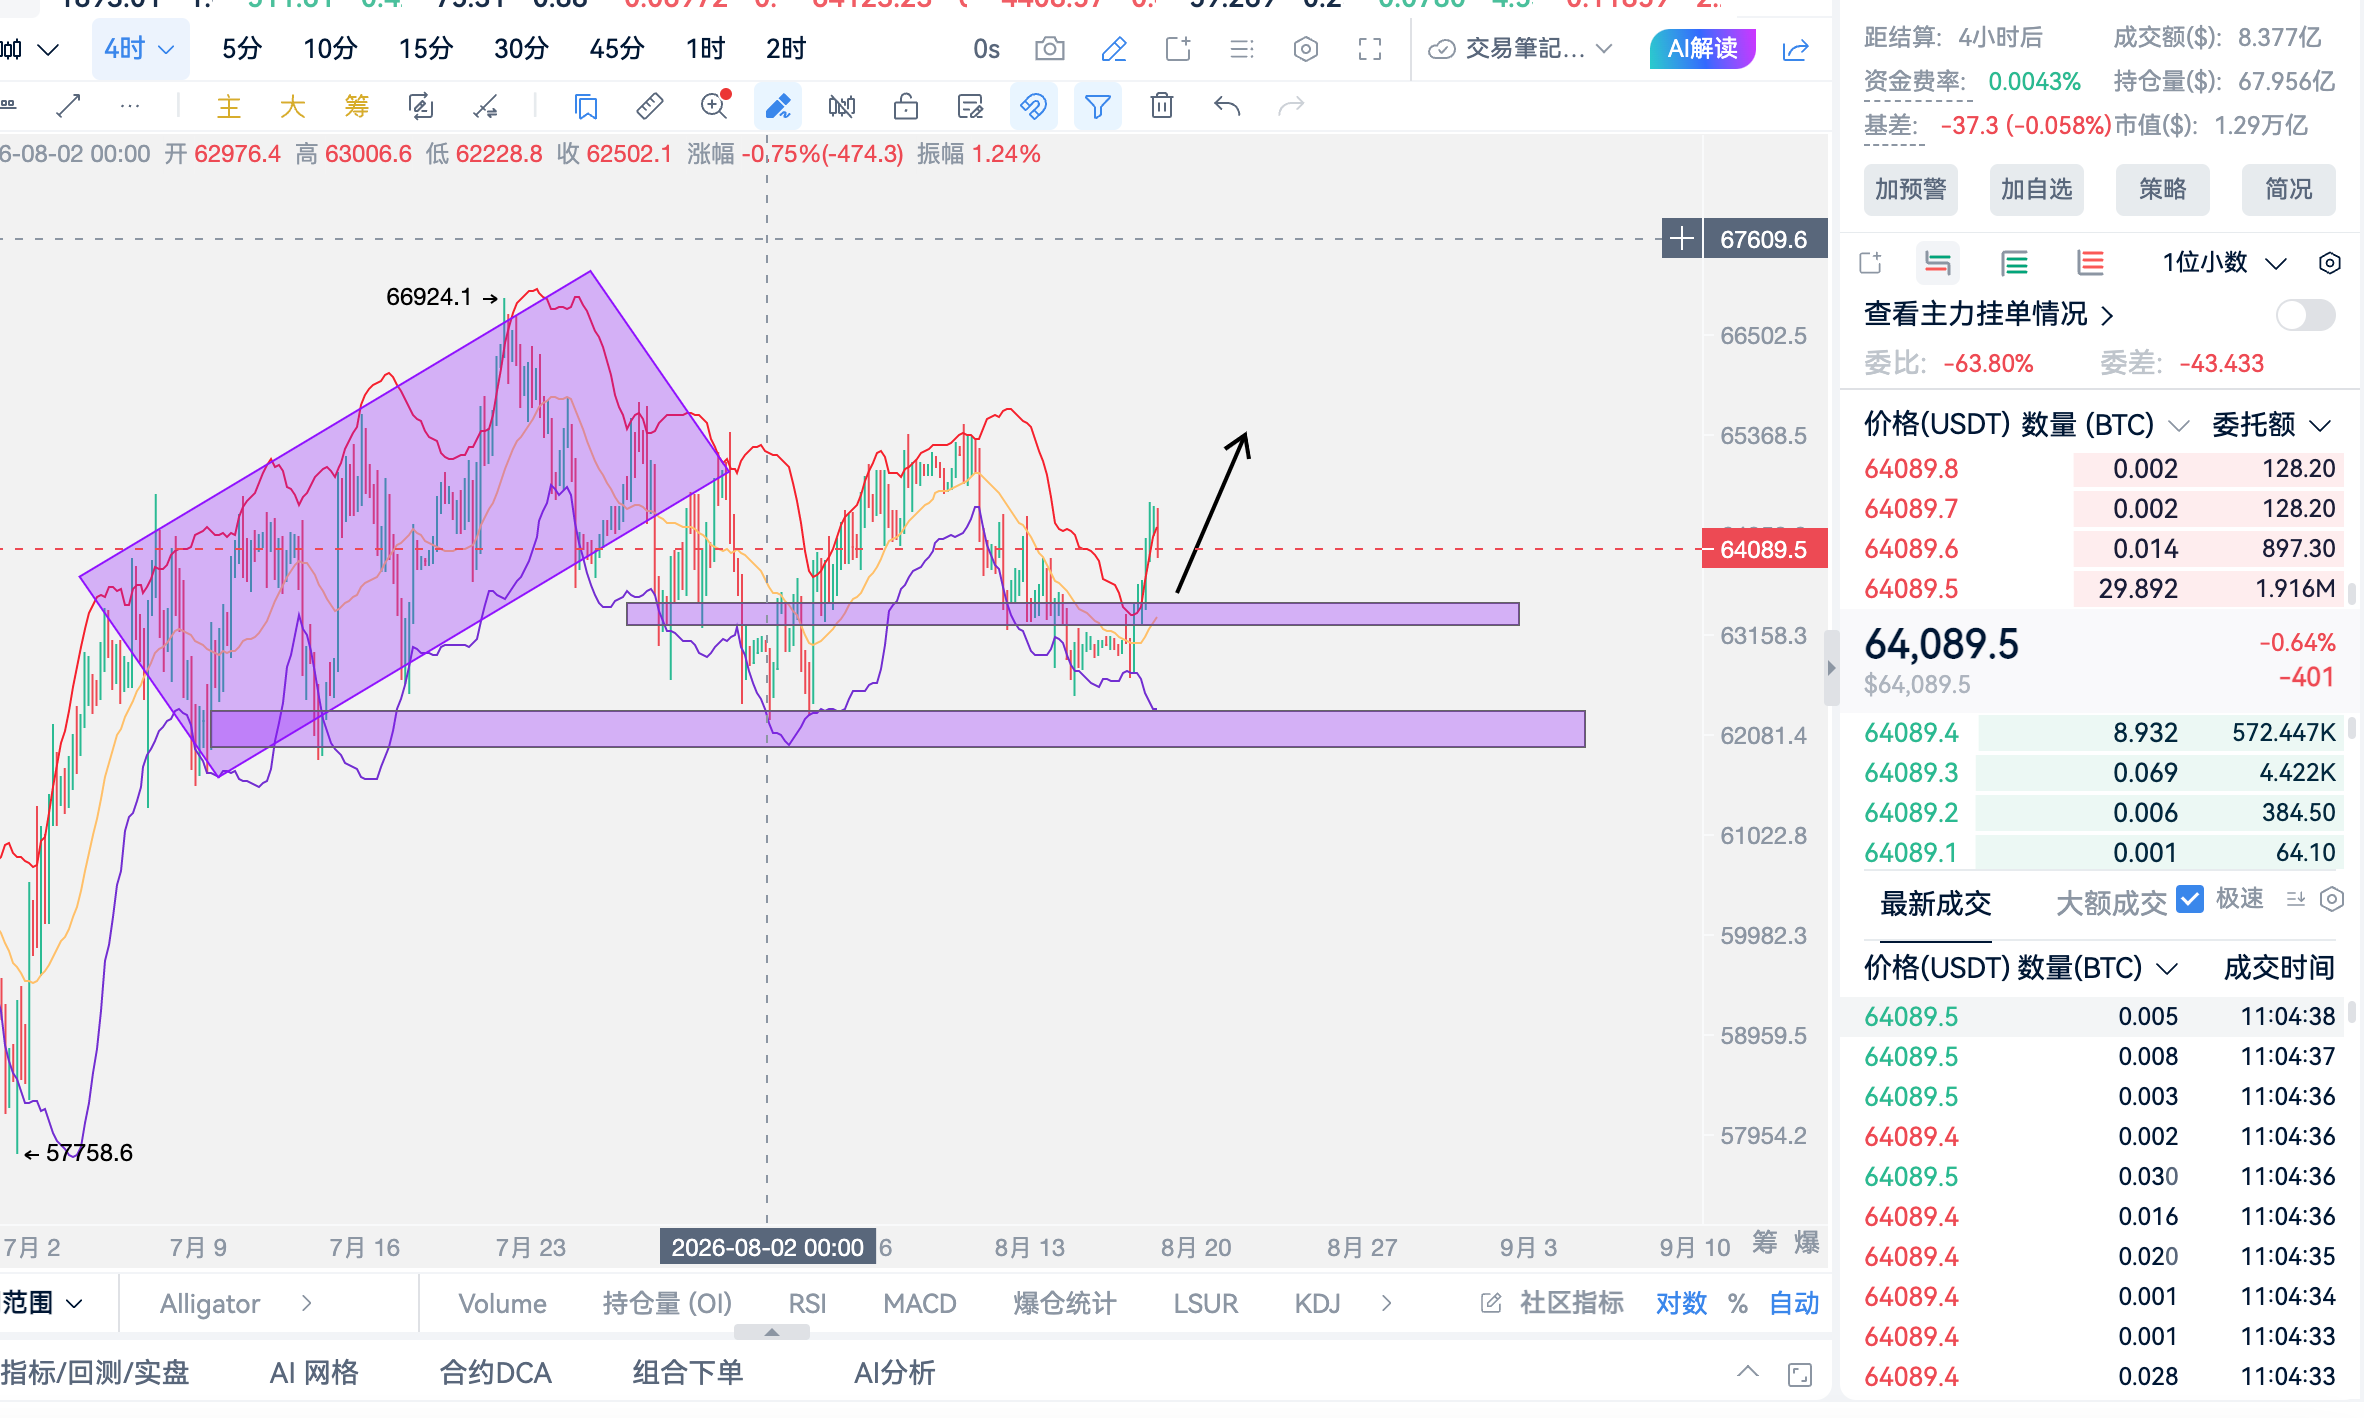
The daily level has also formed a large bullish candle, recovering the drop space from last week. It is about to touch the upper line and shows a bearish candle. The auxiliary indicator MACD is gradually shifting from bearish to bullish, and the pre-market signals indicate that the bulls hold the dominance. The pullback still maintains a bullish outlook.
It is recommended to look for bullish positions in the 63800-63500 area in batches, targeting near the 65000-65400 points, with the points provided for reference only.
Follow the official account, to ease worries, only Jiang Wei. A treasure analysis blogger with max emotional value, sharing trading education for free, bringing stability and clear guidance in the restless trading market. With experience spanning three bull and bear cycles and years of trading practice, specializing in naked K, trends, Dow Theory, Gann, harmonics, Chan Theory, wave theory, and other technical analyses, gathering into unique personal insights.

免责声明:本文章仅代表作者个人观点,不代表本平台的立场和观点。本文章仅供信息分享,不构成对任何人的任何投资建议。用户与作者之间的任何争议,与本平台无关。如网页中刊载的文章或图片涉及侵权,请提供相关的权利证明和身份证明发送邮件到[email protected],本平台相关工作人员将会进行核查。