Crypto Circle Academician: On August 18, Bitcoin (BTC) is in a tug-of-war within a box, with undercurrents flowing. How to grasp the opportunity for Bitcoin to break through! Latest market analysis
Bitcoin is currently priced at 63100, unable to rise or fall, creating a back-and-forth struggle. Watching the market with its up-and-down spikes, going long fears a sudden dump, and going short is concerned about a direct rally breakout, repeatedly getting stopped out by market swings. Most retail investors are stuck in this oscillating range, trading back and forth, chasing highs and cutting losses. Clearly, the direction is generally correct, but the result is continuous small losses.
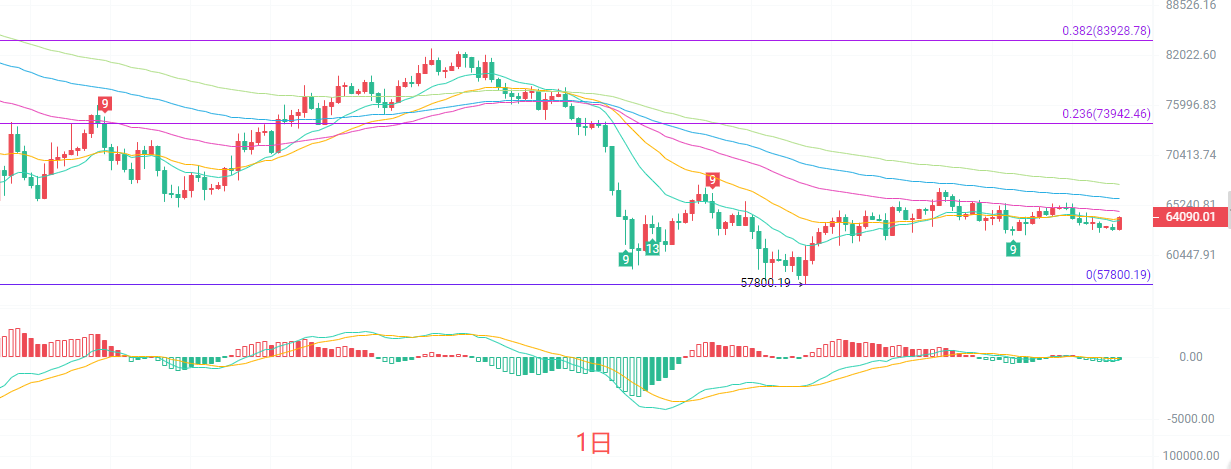
The daily candlestick price is running below the mid-term EMA moving averages, with EMA15 and EMA30 forming an upper pressure zone. The Bollinger Bands are overall tightening, with the upper and lower bands continually narrowing, indicating that a large-scale reversal window is approaching. The MACD indicator's DIF and DEA are bonded below the zero axis, with long and short forces in a balanced state, showing no clear trend expansion. The key resistance zone above is around 65200-65800, while the core support below is at 62400-62600. As long as the daily line does not effectively stabilize above the moving averages, the overall trend remains biased towards weak oscillation. A breakout above 65800 would open upward space; if it breaks below the 62400 support, a new round of downward movement will begin. Currently, the daily market should be treated with an oscillation mindset.
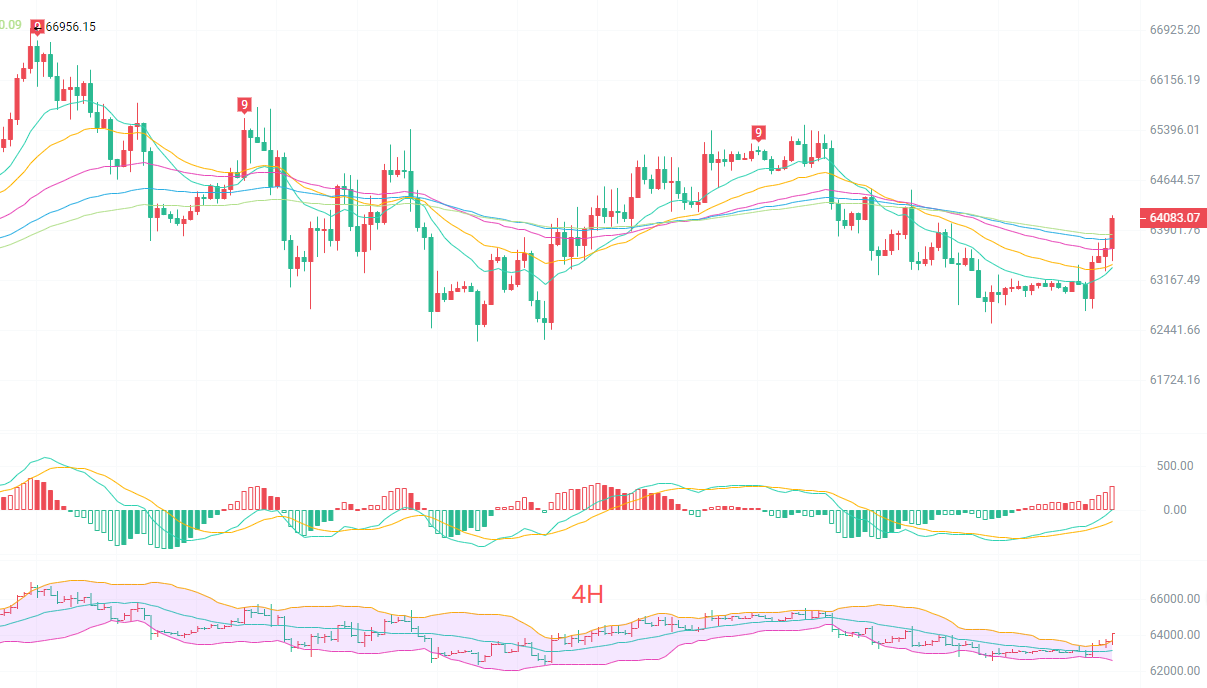
The four-hour candlestick price has re-established itself above the short-term EMA15 moving average, but the mid-to-long-term EMA30 and EMA60 are still moving sideways. The Bollinger Bands channel is running horizontally, with prices fluctuating around the middle band. The 4-hour MACD indicator's golden cross points up, with red bars gradually increasing in volume, showing slight short-term bullish momentum, but there is significant pressure from the moving averages above. The previous high of 65400 has become a strong short-term resistance, with support below at 63200. The 4-hour period is characterized by a range repair rebound, not a reversal upward. During the rebound process, volume does not continue to expand, raising doubts about the sustainability of the bullish trend. If the rebound faces obstacles, there is still a risk of retreat. In the short term, it is only suitable for quick in-and-out trades and not for holding long positions, and one should not blindly chase highs.
Short-term trading ideas for reference:
Northbound trial entry point at 63400 to 63000, with a stop loss of 500 points, targeting 64600 to 65200.
Southbound trial entry point at 65000 to 65400, with a stop loss of 500 points, targeting 63800 to 63200.
The specific operations should be based on real-time data from the market. For more information, feel free to consult the author. There may be delays in article publication; the suggestions are for reference only, with risks borne by the reader.

Friendly reminder: The above content is created solely by the author of the official account. The advertisements at the end of the article and in the comment section are unrelated to the author. Please discern carefully, and thank you for reading.
免责声明:本文章仅代表作者个人观点,不代表本平台的立场和观点。本文章仅供信息分享,不构成对任何人的任何投资建议。用户与作者之间的任何争议,与本平台无关。如网页中刊载的文章或图片涉及侵权,请提供相关的权利证明和身份证明发送邮件到support@aicoin.com,本平台相关工作人员将会进行核查。