Li Ying chat coin: 8.17 Bitcoin (BTC) and Ethereum (ETH) latest market analysis and operational advice
The current price of Bitcoin is 63000, taking a close look at the current market, although the price is still hovering around 63000, that kind of waterfall-like crash feeling is already gone. The current market is like a seriously ill person beginning to recover, the MACD indicator shows a divergence where DIF and DEA have not followed the new lows, and the bearish strength has already exhausted. The price is currently operating between the lower track of 62991 and the middle track of 63071, and the Bollinger Bands are beginning to contract and flatten. This indicates that volatility is decreasing, and a change in trend is imminent. Once the price can effectively stabilize above the middle track of 63071, it confirms that the short-term trend has shifted from weak to strong, which is a very good right-side entry signal.
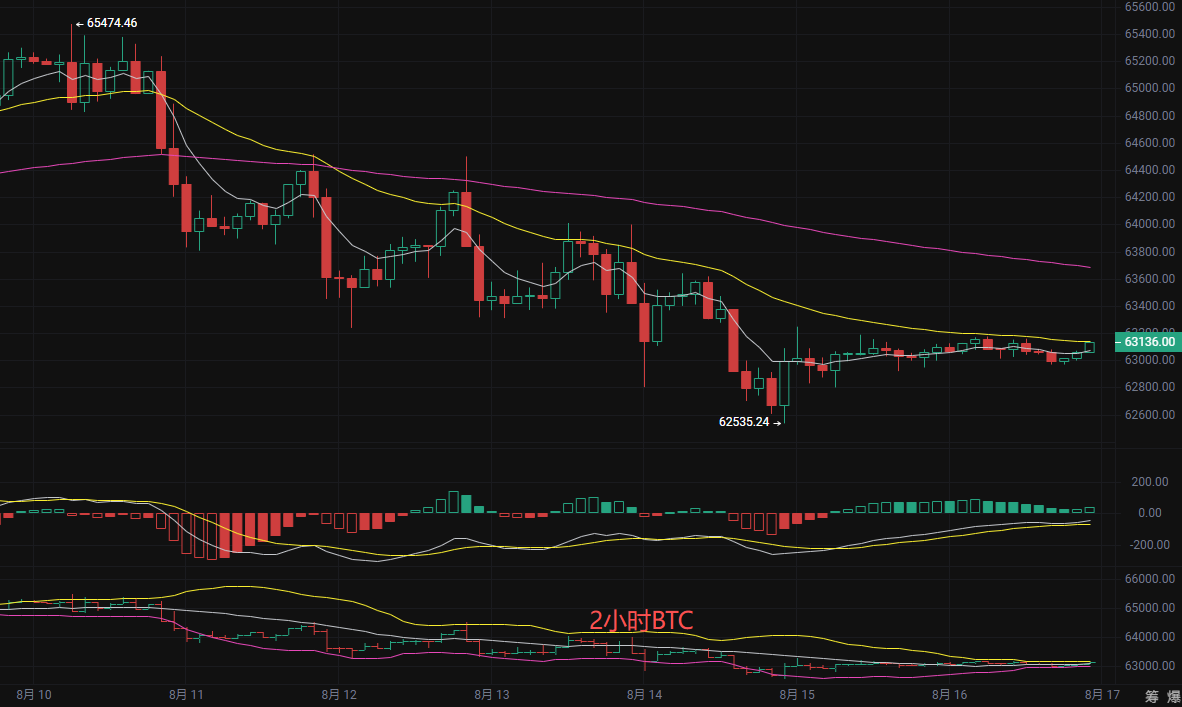
Today's Li Ying price prediction
Open a short at 64000-64400, stop loss 500 points, target 63500 aiming for 63000
Open a long at 62500-63000, stop loss 500 points, target 63500 aiming for 64000
Ethereum analysis
The current price of Ethereum is 1884, this market is like a spring, the longer it is compressed, the greater the force when it rebounds or crashes down. From the chart, the EMA moving average system shows that the long-term EMA120 is forming resistance at 1887, and the entanglement of the three lines indicates an unclear direction. The MACD indicator shows a weak golden cross for DIF and DEA below the zero axis, which is a sign of weak oscillation. The Bollinger Bands are clearly tightening, with the upper track at 1885 and the lower track at 1877, the price is running closely along the middle track, and the volatility is compressed to the extreme, usually indicating an impending change in trend. The current price is near the middle track of the Bollinger Bands, if it can stabilize at the middle track and break out above the upper track with volume, then the short-term is bullish; conversely, if it breaks below the lower track, it may open a new round of decline.
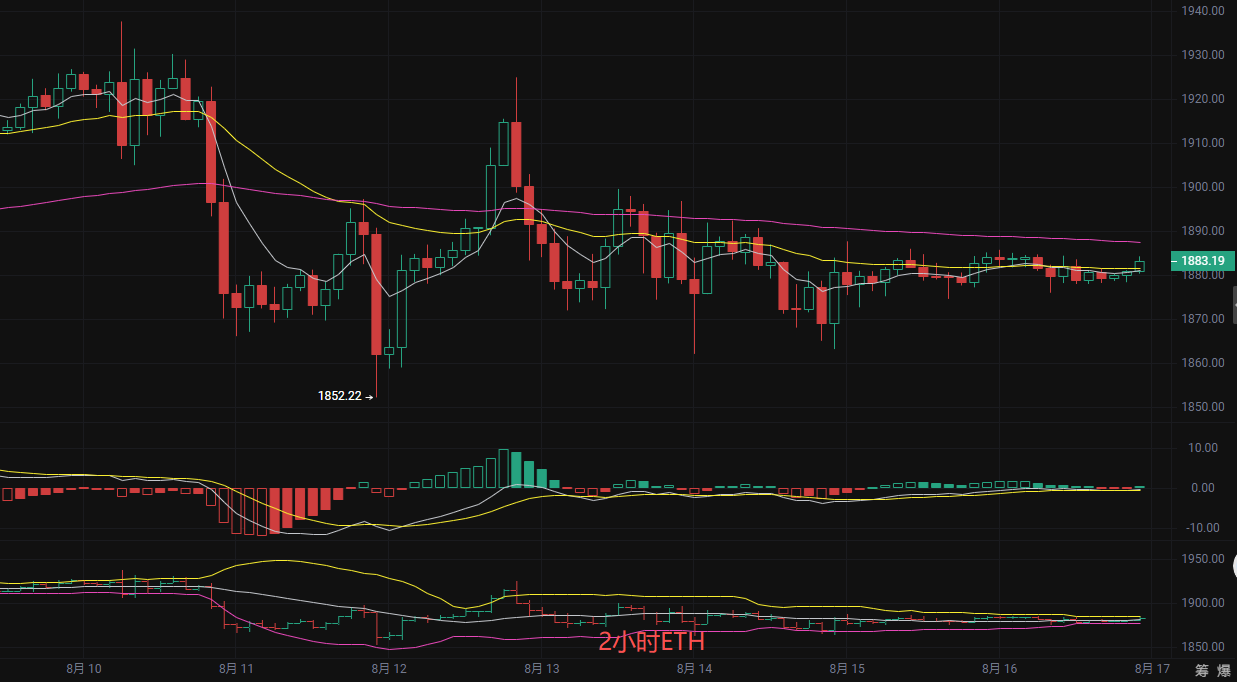
Latest price reference
Buying point 1875-1860, stop loss 1840, target 1900 aiming for 1920
Selling point 1910-1915, stop loss 1930, target 1890 aiming for 1870
The above content is exclusively original by Li Ying, please indicate the source when reprinting! The publication of articles is subject to delays, the market changes rapidly, and the above suggestions are for reference only, risks are borne by the reader.

Warm reminder: The above content is solely created by the author on Weibo, the advertisements at the end of the article and in the comments section are unrelated to the author, please be cautious in distinguishing, thank you for reading.
免责声明:本文章仅代表作者个人观点,不代表本平台的立场和观点。本文章仅供信息分享,不构成对任何人的任何投资建议。用户与作者之间的任何争议,与本平台无关。如网页中刊载的文章或图片涉及侵权,请提供相关的权利证明和身份证明发送邮件到support@aicoin.com,本平台相关工作人员将会进行核查。