Crypto Circle Academician: On August 17, the battle over Bitcoin (BTC) moving averages intensifies, deeply analyzing the current long and short dilemma of Bitcoin! Latest market analysis
The current price of Bitcoin is 63100. Many friends have recently watched BTC fluctuate back and forth, unable to hold their positions. They want to chase after a small rise and panic sell on a slight drop, getting hit repeatedly. The market has not established a clear trend. Most of the time, it has been a grinding sideways movement, watching the K-line spike up and down, with many people getting stopped out back and forth. The current price is 63110, a position that hovers up and down, afraid to chase the high in case of a fall, and worried about bottom fishing in case of further decline. Many people always hope to seize a big market movement but overlook that frequent trading is the most taboo in a volatile market.
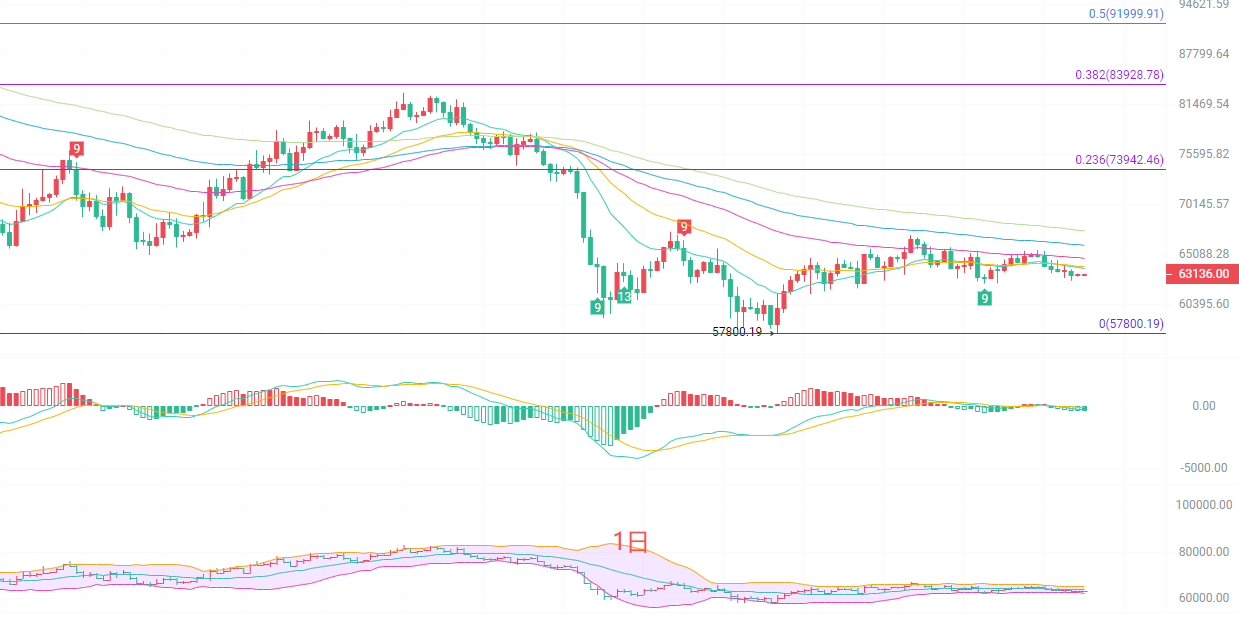
The daily K-line is running below the EMA15 and EMA30 moving averages, with the medium and long-term moving averages still diverging downwards. Around 64700 above is strong resistance at EMA60. The Bollinger Bands are narrowing, and market fluctuations are gradually converging, with the upper band at 65244 and the lower band support at 62469. The MACD indicator’s DIF and DEA are intertwined below the zero axis, with long and short forces relatively balanced and no clear trend signal present. The key support below at 57800 is the previous low. If this position is held, there is still a chance for a rebound and repair at the daily level; once it effectively breaks below, it will open up deeper downward space. Currently, the daily line has not formed a breakout structure, still treating it with a range-bound mindset without subjective predictions of one-sided rises and falls.
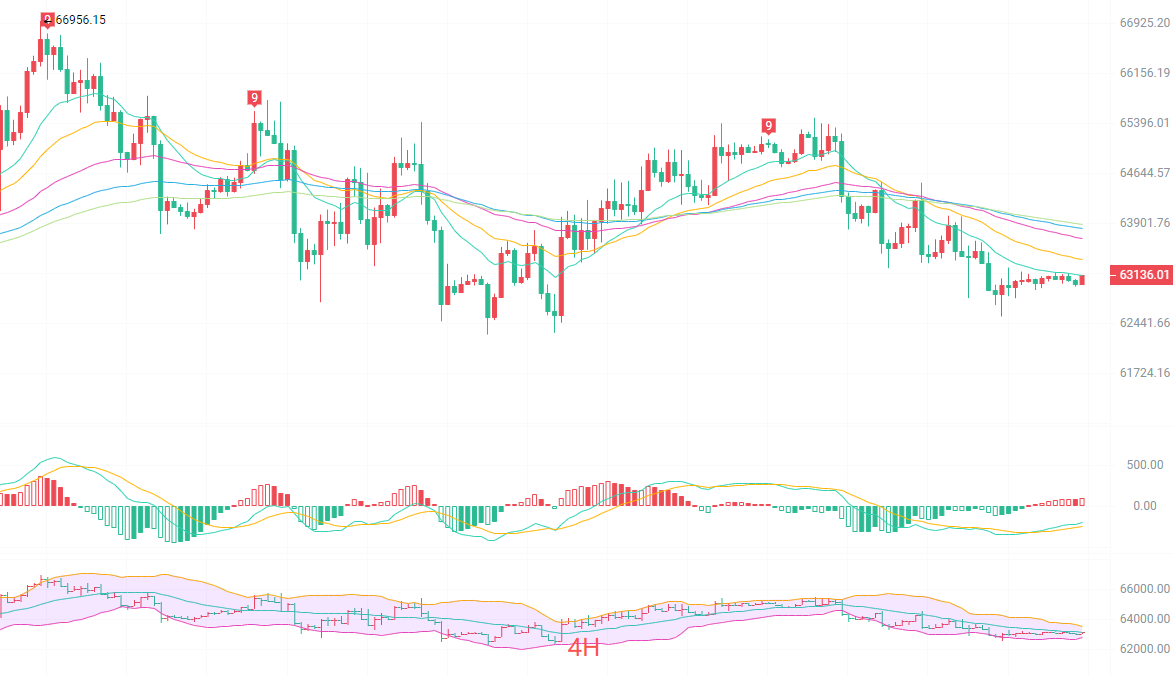
The four-hour K-line is entangled around the mid-term and short-term EMA moving averages, pulling back and forth repeatedly. EMA15, EMA30, and EMA60 are entwined with each other, indicating that the four-hour chart is in a consolidation phase. The Bollinger Bands are continuously narrowing, compressing the range to an upper band at 63496 and a lower band at 62771, with further shrinking space for fluctuations. The four-hour MACD has crossed golden above the zero axis and is turning upwards, with the red bars slightly expanding, showing that bulls have weak counterattack momentum, but the upward force is insufficient. The first resistance above is around 63500 at the upper band of the Bollinger Bands, with strong resistance at 64000; below, short-term support is at 62700 at the lower band of the Bollinger Bands. The four-hour chart is unlikely to break out significantly before a volume increase, and it is most likely to continue maintaining a range-bound fluctuation, waiting for a significant volume to determine the direction.
Short-term trading ideas reference:
Northbound entry points at 62800 to 62500, stop loss 500 points, target looking at 63500 to 64500
Southbound entry points at 64000 to 64500, stop loss 500 points, target looking at 63200 to 62800
Specific operations should be based mainly on real-time data from the market. For more detailed information, you can consult the author. There may be a delay in article publication; it is suggested for reference only, with risks borne by the individual.

Warm reminder: The above content is solely created by the author on the official account. The advertisements at the end of the article and in the comments section are unrelated to the author, so please discern carefully. Thank you for reading.
免责声明:本文章仅代表作者个人观点,不代表本平台的立场和观点。本文章仅供信息分享,不构成对任何人的任何投资建议。用户与作者之间的任何争议,与本平台无关。如网页中刊载的文章或图片涉及侵权,请提供相关的权利证明和身份证明发送邮件到support@aicoin.com,本平台相关工作人员将会进行核查。