Academician of the Currency Circle: Dissecting the Oscillation Dilemma of Ethereum (ETH) on 8.16: How to Break Free from the Cycle of Losses under Bull and Bear Struggles! Latest Market Analysis Reference
The current price of Ethereum is 1883. Most people in the market trade Ethereum, often getting their mentality shattered by back-and-forth price swings, chasing prices when they rise and panicking when they fall, repeatedly hit by the strategy of buying high and selling low. Many friends only focus on the price fluctuations, ignoring the resonance relationship between the long-term and short-term cycles, frequently trading on short-term movements, blaming the market for not providing opportunities when they incur losses. Currently, ETH is stuck around 1884, with intense bull and bear struggles and no clear one-directional movement.
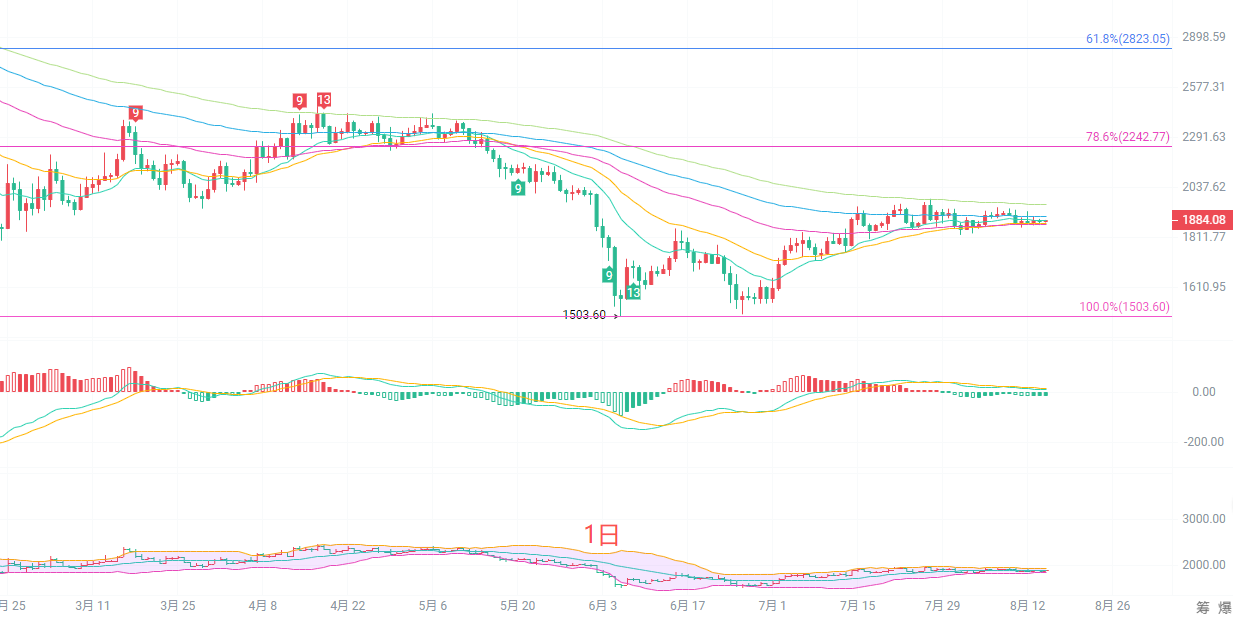
The daily candlestick is in the repair rebound phase after a decline. The price has stabilized above the EMA15 average line, and short-term rebound momentum still exists, but the medium to long-term EMA60 and EMA90 average lines are still forming heavy resistance above, with a significant pressure level near 2242. The MACD indicator is running below the zero axis, with the red bars slightly shrinking, and the rebound strength is gradually weakening; the Bollinger Bands are narrowing, indicating that the market is entering a converging oscillation range. The key support below is at 1846. If the price drops below this position, the current rebound is likely to be declared over, and it will test the previous low of 1503 again. The daily level has not shown a clear reversal structure and can only be defined as a rebound repair in a downtrend; the overall bearish pattern has not been completely reversed.
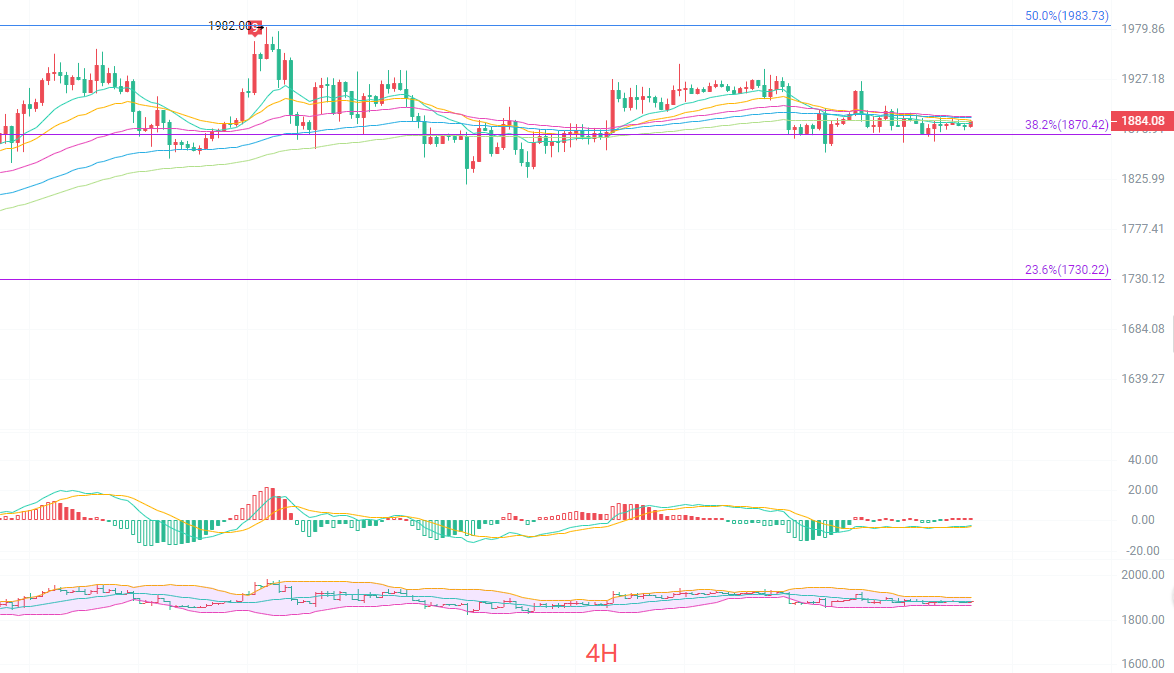
The four-hour candlestick is operating near multiple EMA average lines, with the averages intertwining, representing a balance of bull and bear forces, with no clear trend. The Fibonacci 38.2% level at 1870 acts as a short-term dividing line for strength and weakness, and the current price is hovering just above this level. The MACD is oscillating around the zero axis, with insufficient bull and bear momentum; the Bollinger Bands are extremely narrow, indicating that a direction is likely to be chosen soon. The resistance above is at 1983, and the support below is at 1730. A breakout above 1983 will open up upward space, while a drop below 1730 will initiate a new downward round; at this stage, it is advisable to adopt a oscillation approach without prematurely predicting a one-sided trend.
Short-term Reference:
For a downward test entry point between 1875 and 1855, with a stop loss of 50 points, and a target looking at 1940 to 1980.
For an upward test entry point between 1970 and 1990, with a stop loss of 50 points, and a target looking at 1910 to 1880.
The specific operation should be based on real-time market data; for more detailed information, you can consult the author. There may be a delay in the publication of the article, and it is advised for reference only, with risks borne by the reader.

Warm Reminder: The above content is created solely by the author of the public account. The advertisements at the end of the article and in the comments section have no relation to the author; please discern carefully, and thank you for reading.
免责声明:本文章仅代表作者个人观点,不代表本平台的立场和观点。本文章仅供信息分享,不构成对任何人的任何投资建议。用户与作者之间的任何争议,与本平台无关。如网页中刊载的文章或图片涉及侵权,请提供相关的权利证明和身份证明发送邮件到support@aicoin.com,本平台相关工作人员将会进行核查。