Recently, the volatility in the market has clearly decreased. When the market was active previously, the daily ATR could reach around 2,500, but now it has dropped to around 1,200—1,300, with the fluctuation range nearly halved.
This is also one of the important reasons why Bitcoin has not shown a clear trend recently.
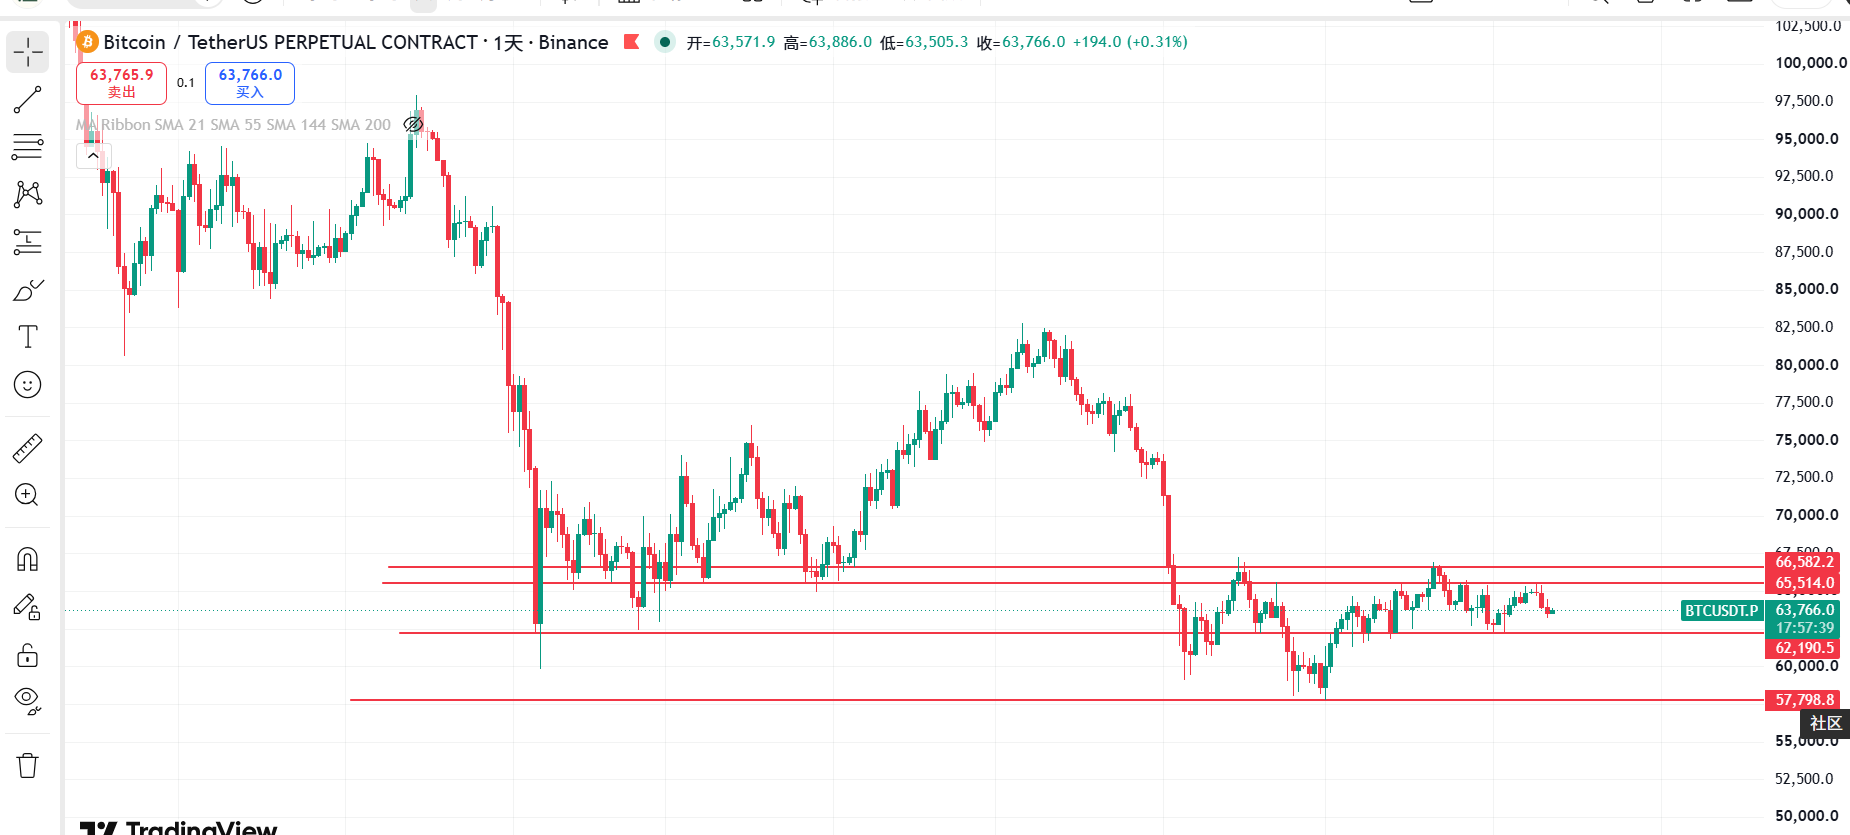
Looking back, when Bitcoin fell to around 57,000 and formed a double bottom, the market presented a relatively clear buying opportunity. Subsequently, the price gradually recovered, while the core area we have been emphasizing for the past two months is between 65,800—66,000 and 63,200 on the weekly chart.
Now looking back, the price has been fluctuating within this range for about six weeks.
In other words, the market has consumed a lot of time in a very narrow weekly range. Once this range truly breaks, it is likely that there will be a trend that follows the market.
The current issue is not to guess the direction, but to wait for the market to provide the answer.
CPI Approaches, Short-term Volatility May Amplify
The U.S. CPI data will be released tonight at 8:30 p.m.
For Bitcoin, the importance of CPI is not just the data itself, but how it may further influence the market's expectations about the Federal Reserve's interest rate policy for the year.
Before the data is released, macro uncertainties still exist, so short-term volatility may show significant amplification.
Therefore, during today's trading, special attention is needed; do not directly judge that the larger trend has completed a reversal just because of a short-term spike or drop.
Hourly Chart: 63,800 Becomes First Pressure Level
From the hourly perspective, around August 10, the price surged to approximately 65,400 and then fell back, followed by a period of fluctuating decline.
On the evening of August 11, after the price broke below the 64,000 support level, the short-term clearly entered a weak phase.
Around 3 a.m., the price touched a low of 63,200.
This position is not unfamiliar.
Previously, the area around 63,800 was a position fiercely contended by the market, while 63,200 is the next important support level.
After this rapid drop to 63,200, the price did not close at the lowest point, indicating that there is indeed some support in this area.
However, the problem is very apparent:
Though 63,200 showed support, it did not change the weak hourly structure.
The price then rebounded to around 63,800, but both attempts failed to break through effectively.
Therefore, the first pressure above in the short term remains at 63,800, with further resistance at 64,200.
As long as these two levels are not reclaimed, the hourly chart should continue to be viewed from a bearish standpoint.
4-Hour Chart: Downward Structure Has Opened
The changes at the 4-hour level are more evident.
Previously, the market was moving very slowly, with numerous 4-hour candlesticks showing upper and lower shadows. Despite the price frequently fluctuating, most closing prices managed to stay within the sideways range.
This state lasted for quite a long time.
The real turning point came on the evening of August 10.
From this point onwards, the price ended the previous slow recovery phase and began to run downward consecutively.
Currently, the 4-hour chart has formed a clear downward segment, and each rebound has failed to retake the previous key position.
There was no reclaiming of key pressure after the first round of declines, and the same goes for the second round.
Thus, from a structural viewpoint, the 4-hour chart remains in a bearish trend.
Currently, there are lower shadows appearing around 63,200, indicating some support here, but mere support is insufficient to change the trend.
What really needs attention are the 63,800 and 64,200 levels.
If the price can reclaim 64,200, the bearish judgment on the 4-hour chart will significantly weaken.
Conversely, if 63,200 is effectively breached again, the downward space may further open up.
Daily Chart: Three Consecutive Bearish Candles After Failed Rally
The daily chart also shows significant signs of weakening.
On August 9, the price peaked around 65,400, but failed to hold, ultimately retreating after the spike.
Subsequently, three consecutive daily bearish candles appeared.
On August 11, the price touched a low of 63,200, closing near 63,572.
This indicates that the upward recovery formed in early August has significantly slowed down and is beginning to show structural damage.
From the perspective of Fibonacci, the upward recovery that started around 62,200 has now dropped back to multiple key retracement levels.
The 0.382 position was previously breached and then reclaimed, indicating that there is still some support here.
However, the 0.5 and 0.618 positions have been clearly breached.
Therefore, the market can no longer be simply understood as a typical high-range fluctuation.
The upward structure has been damaged, but whether it further evolves into a larger-scale downward move still needs confirmation.
Especially at 63,200.
Whether this position can form a new daily support will determine whether the subsequent market can repair itself.
Weekly Chart: Large Range Still Has Not Broken
At the weekly level, one should not be overly pessimistic or overly optimistic at this point.
After the price peaked around July 20, it underwent several weeks of sideways consolidation.
The market then began to recover from around 62,200, with a peak rebound to approximately 65,400.
This week, the price has once again moved downward, withdrawing a considerable portion of the previous week’s recovery.
However, today is only Wednesday, and there is still a long time until the weekly close.
Therefore, one cannot simply judge that a new round of breakout has occurred based on two to three days of decline.
The most important areas on the weekly chart remain unchanged:
Focus below on 63,200, above on 65,800—66,000.
As long as this large range hasn’t truly broken, the weekly level is still in a range-bound oscillation.
Open Interest: Decline is Not Just Due to Long Positions Exiting
Looking at the trading volume and open interest again.
Since the 11th, as the price gradually declined, open interest has not significantly decreased, but instead has increased.
This indicates that the current decline is not entirely due to long positions being closed.
Price declining and open interest increasing means there are new positions entering the market.
From the current structure, the probability of new short positions is greater.
However, after the price touched 63,200, open interest increased again, while the price started to show some recovery.
This means there are also new long positions forming around 63,200.
Therefore, the market is not simply de-leveraging now, but has entered a new phase of competition between long and short positions.
In simple terms:
New shorts are coming in during the decline, while there is also support at lower levels.
This is why, although 63,200 is key, the price has not directly accelerated downwards continuously.
If the price further tests 63,200 while trading volume significantly increases and open interest continues to rise, and short positions remain predominant, then should this level be effectively broken, the downward space may expand significantly.
Moving Averages: Short-term Weakness, Mid-term Still Has Defense
The daily MA system has also undergone clear changes.
Previously emphasized MA20 has gradually shifted from support to resistance.
At the same time, the price has operated below the 5-day and 7-day moving averages for two consecutive days.
This indicates that the recovery structure after re-establishing the moving averages in early August has been disrupted.
However, there is still a relatively important defense level:
MA60 is approximately around 63,500.
Thus, the current moving average structure can be summarized as:
Short-term moving averages have turned weak, while mid-term MA60 still provides support.
Therefore, 63,500 and 63,200 should not be completely ignored.
If the 4-hour chart effectively breaks below 63,500, and continues below 63,200, then attention will need to shift to the 62,000 price area.
Bollinger Bands: 4-Hour Chart Has Expanded, Daily Chart Still Very Narrow
The signals provided by Bollinger Bands are currently quite interesting.
The Bollinger Bands at the daily level remain very narrow, with overall volatility in a sharply contracted state.
This is consistent with the recent decline in ATR.
However, the 4-hour chart shows a significant difference.
The 4-hour Bollinger Bands are continuing to expand, with the price starting to release volatility downward from above 65,000.
In other words:
The short cycle has already opened up volatility, and currently it is opening downward.
But the daily level has not yet synchronized into wide fluctuations.
So even if the 4-hour chart continues to tilt bearish, it cannot be simply assumed that a significant drop will occur immediately on the daily chart.
The daily volatility is too low, which still restricts the sustained capacity for shorts.
EMA: Rebound Faces Pressure Above 64,000
From the EMA structure, the hourly chart is currently stabilizing slightly, with the price temporarily gaining support near 63,700.
However, the 4-hour and daily charts remain bearish.
Attention is needed around the 64,000 area on the 4-hour EMA12, while the daily EMA12 is around 64,200.
Therefore, if the price wishes to effectively recover from the downward trend, it will need to reclaim these fast-moving averages layer by layer.
Short-term rebounds to 63,800 do not signify a trend reversal.
Even rebounds to around 64,300—64,400 will still face significant pressure.
What can truly change the current weak structure is effectively reclaiming above 64,200.
MACD: Daily and 4-Hour Charts Have Synchronized Weakness
In terms of MACD, the daily chart has shown significant changes.
After three consecutive bearish candles, the daily MACD bearish energy began to amplify and formed a death cross.
The 4-hour chart is also in a death cross state, and bearish momentum is still being released.
This indicates that the current decline is not merely a short-term adjustment at the hourly level, but has begun to transmit towards larger cycles.
Currently, the hourly chart shows a gold cross below the zero axis.
This indicates that there is indeed a demand for short-term recovery after 63,200.
However, it is necessary to note:
The hourly gold cross currently cannot change the momentum direction of the 4-hour and daily charts.
Thus, the current rebound is more suitably understood as a recovery during the downturn, rather than a trend reversal.
DMI and RSI: All Three Timeframes Lean Bearish
Regarding DMI, the hourly MDI is above the PDI, with an ADX of about 27, indicating a bearish dominance.
The 4-hour chart also shows bearish dominance, with an ADX rising to about 33, indicating that the 4-hour downward trend is strengthening.
The daily chart is also showing some degree of bearish expansion, with the ADX seeing an increase.
Although the trend strength on the daily chart has not reached an extreme level, the direction is evidently leaning bearish.
RSI exhibits a similar situation.
The hourly, 4-hour, and daily RSIs are all currently below 50.
This suggests that the weakness is not merely confined to the hourly chart, but has expanded to the 4-hour and daily charts as well.
On the other hand, however, the 4-hour and daily RSIs have not yet entered extreme oversold territory.
Therefore, while it currently leans bearish, it cannot be directly understood as having reached an extreme low.
ATR: The Real Problem is the Low Volatility
ATR is currently a very noteworthy piece of data in this market.
The 4-hour ATR is currently around 420.
Calculating at the price of around 63,700, the normal fluctuation range can still cover around 63,800, 64,100, and even 64,200.
Thus, these positions may all be touched in the short term.
However, special attention is needed:
Touched does not equal held.
What truly deserves attention is the daily ATR.
The current daily ATR has dropped to around 1,300, and since February of this year, it has been at a very low level.
This indicates that the normal fluctuation range of a daily candlestick is significantly narrowing.
Thus, even though the technical aspects are leaning bearish now, the daily volatility has not fully opened up, which also limits the probability of a significant one-sided drop occurring directly.
Reorganized Key Positions
Combining candlesticks, moving averages, Fibonacci, Bollinger Bands, EMA, MACD, DMI, RSI, and open interest, the key positions can currently be simply summarized.
First Pressure Above: 63,800
This is the position that the hourly chart has repeatedly been unable to break through.
Second Pressure Above: 64,200
This is a very critical boundary between longs and shorts today.
If the 4-hour chart can effectively reclaim 64,200, then the current bearish judgment needs to be reassessed.
First Support Below: 63,500—63,400
This area is a resonance zone formed by MA60, Fibonacci, and multiple technical structures.
Core Support Below: 63,200
This is currently the most important short-term defense level.
Once 63,200 is effectively breached, while trading volume and open interest rise, the probability that bearish positions will continue to expand will significantly increase.
Comprehensive Judgment: Center of Gravity Still Leans Downward
Considering all current cycles and indicators, I personally still believe that today's market center of gravity is leaning downwards.
The first target remains to test 63,200.
If the price approaches 63,200 again and shows obvious support, a short-term rebound may occur for repair.
However, if the rebound fails to break through 63,800 and 64,200, then this rebound should be understood more as a technical recovery in the downward process rather than a trend reversal.
Conversely, if 63,200 fails to test again, and the 4-hour chart effectively closes below while trading volume increases and open interest continues to rise, then the focus may shift further down to around 62,500.
Therefore, the positions that will be most worth observing in the next 1—3 days are:
Above: 63,800, 64,200
Below: 63,500, 63,200
Of which, 64,200 determines whether the current bearish judgment fails, while 63,200 determines whether the downward space opens further.
The biggest characteristic of the current market remains: volatility is very low, but the structure is changing.
Therefore, what is needed now is not to predict that the market will either rise or fall, but to wait for key positions to be truly broken before following the market direction provided.
Daily sharing of real-time trading strategies, providing free open position diagnostics, ideas for recovery, and market practical content. Scan the code to follow the public account and get exclusive addition methods!

免责声明:本文章仅代表作者个人观点,不代表本平台的立场和观点。本文章仅供信息分享,不构成对任何人的任何投资建议。用户与作者之间的任何争议,与本平台无关。如网页中刊载的文章或图片涉及侵权,请提供相关的权利证明和身份证明发送邮件到support@aicoin.com,本平台相关工作人员将会进行核查。