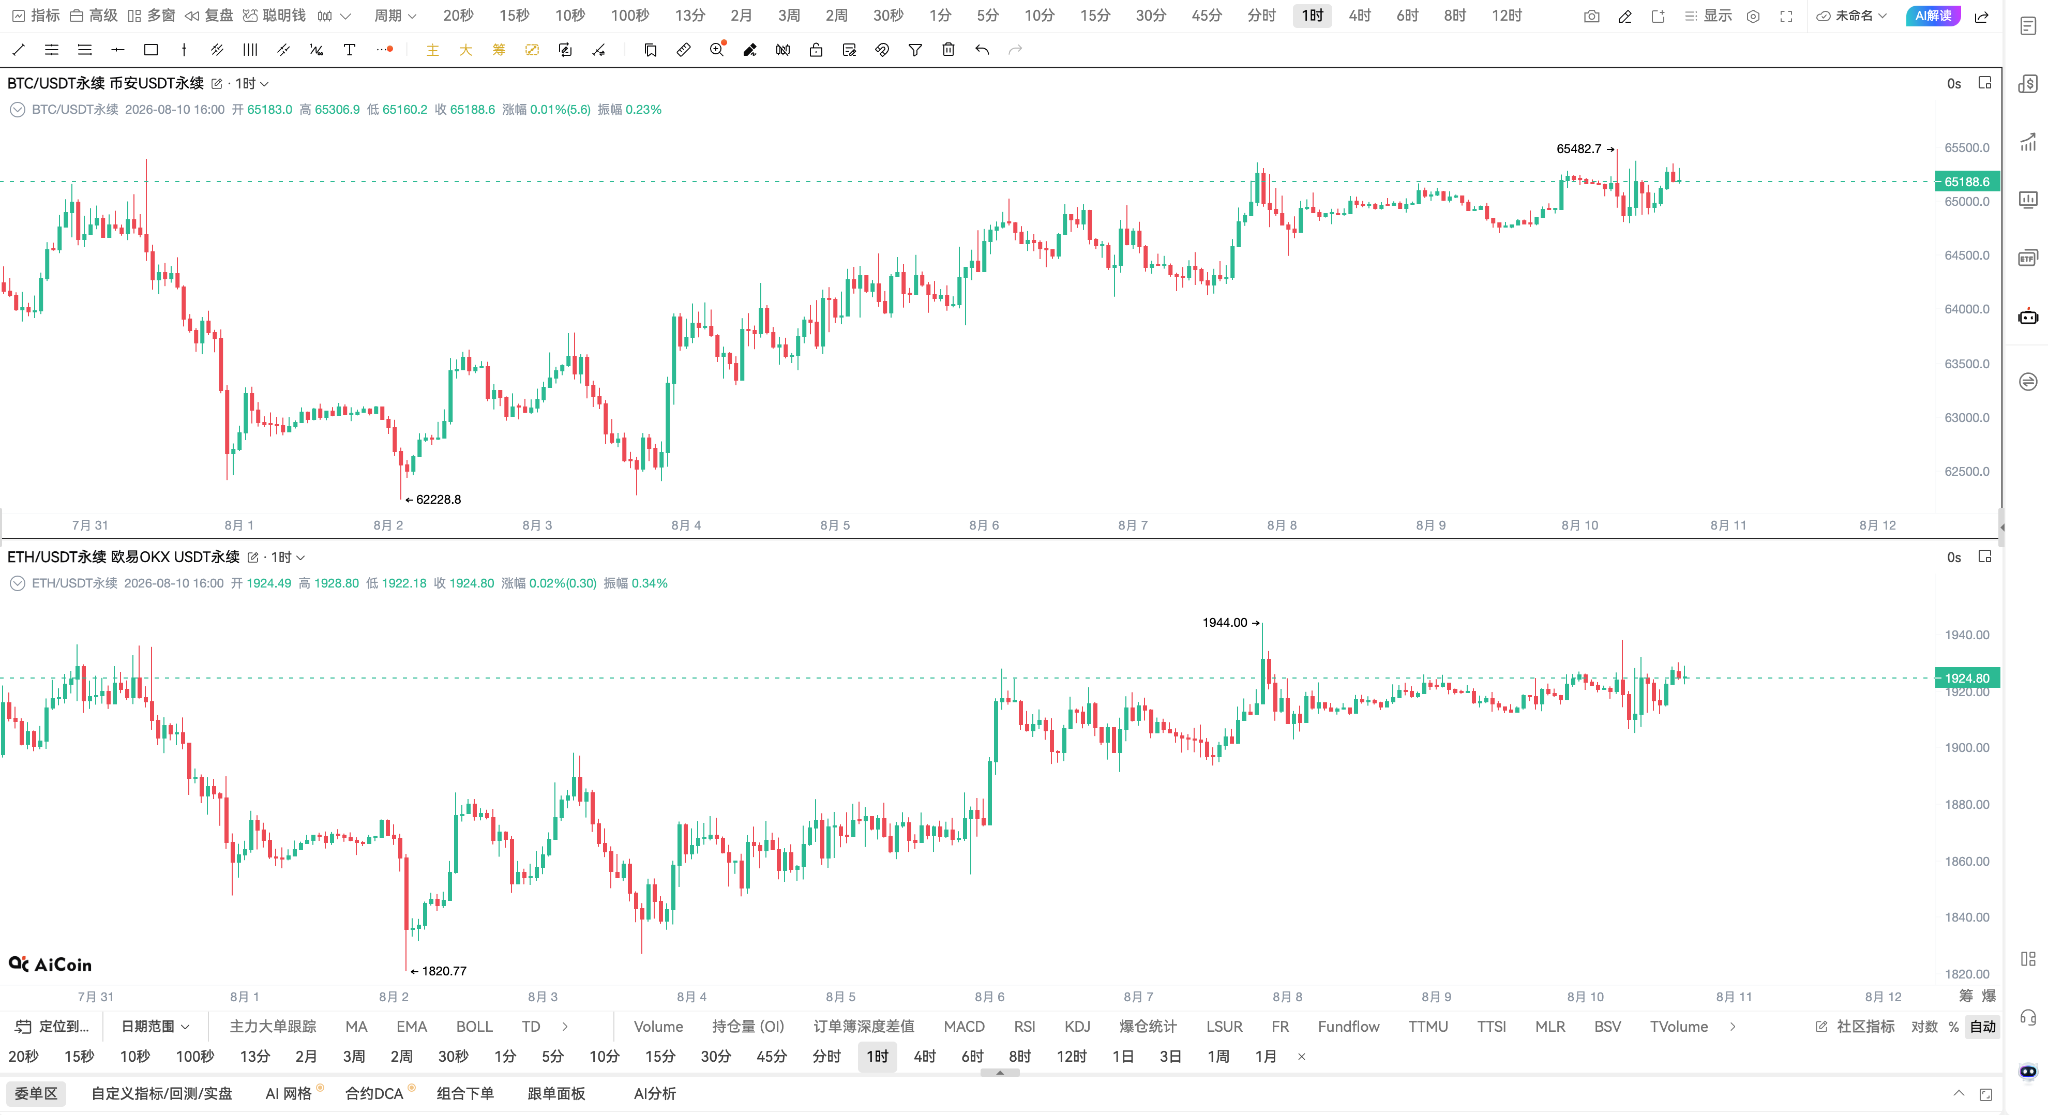
In the past 24 hours, the cryptocurrency market has given a rather divided signal: the prices have remained almost unchanged, yet funds are continuously pouring in.
As of AiCoin August 10, 16:00 (Singapore time), BTC is at 65,187.52 USDT, up 0.58% in 24 hours, but has cumulatively risen 4.17% in the past 7 days; ETH is at 1,924.29 USDT, up 0.37% in 24 hours, with a cumulative increase of 4.37% over 7 days. Both major assets are in a technical state of "short-term sideways movement, with a slow upward trend on the weekly chart."
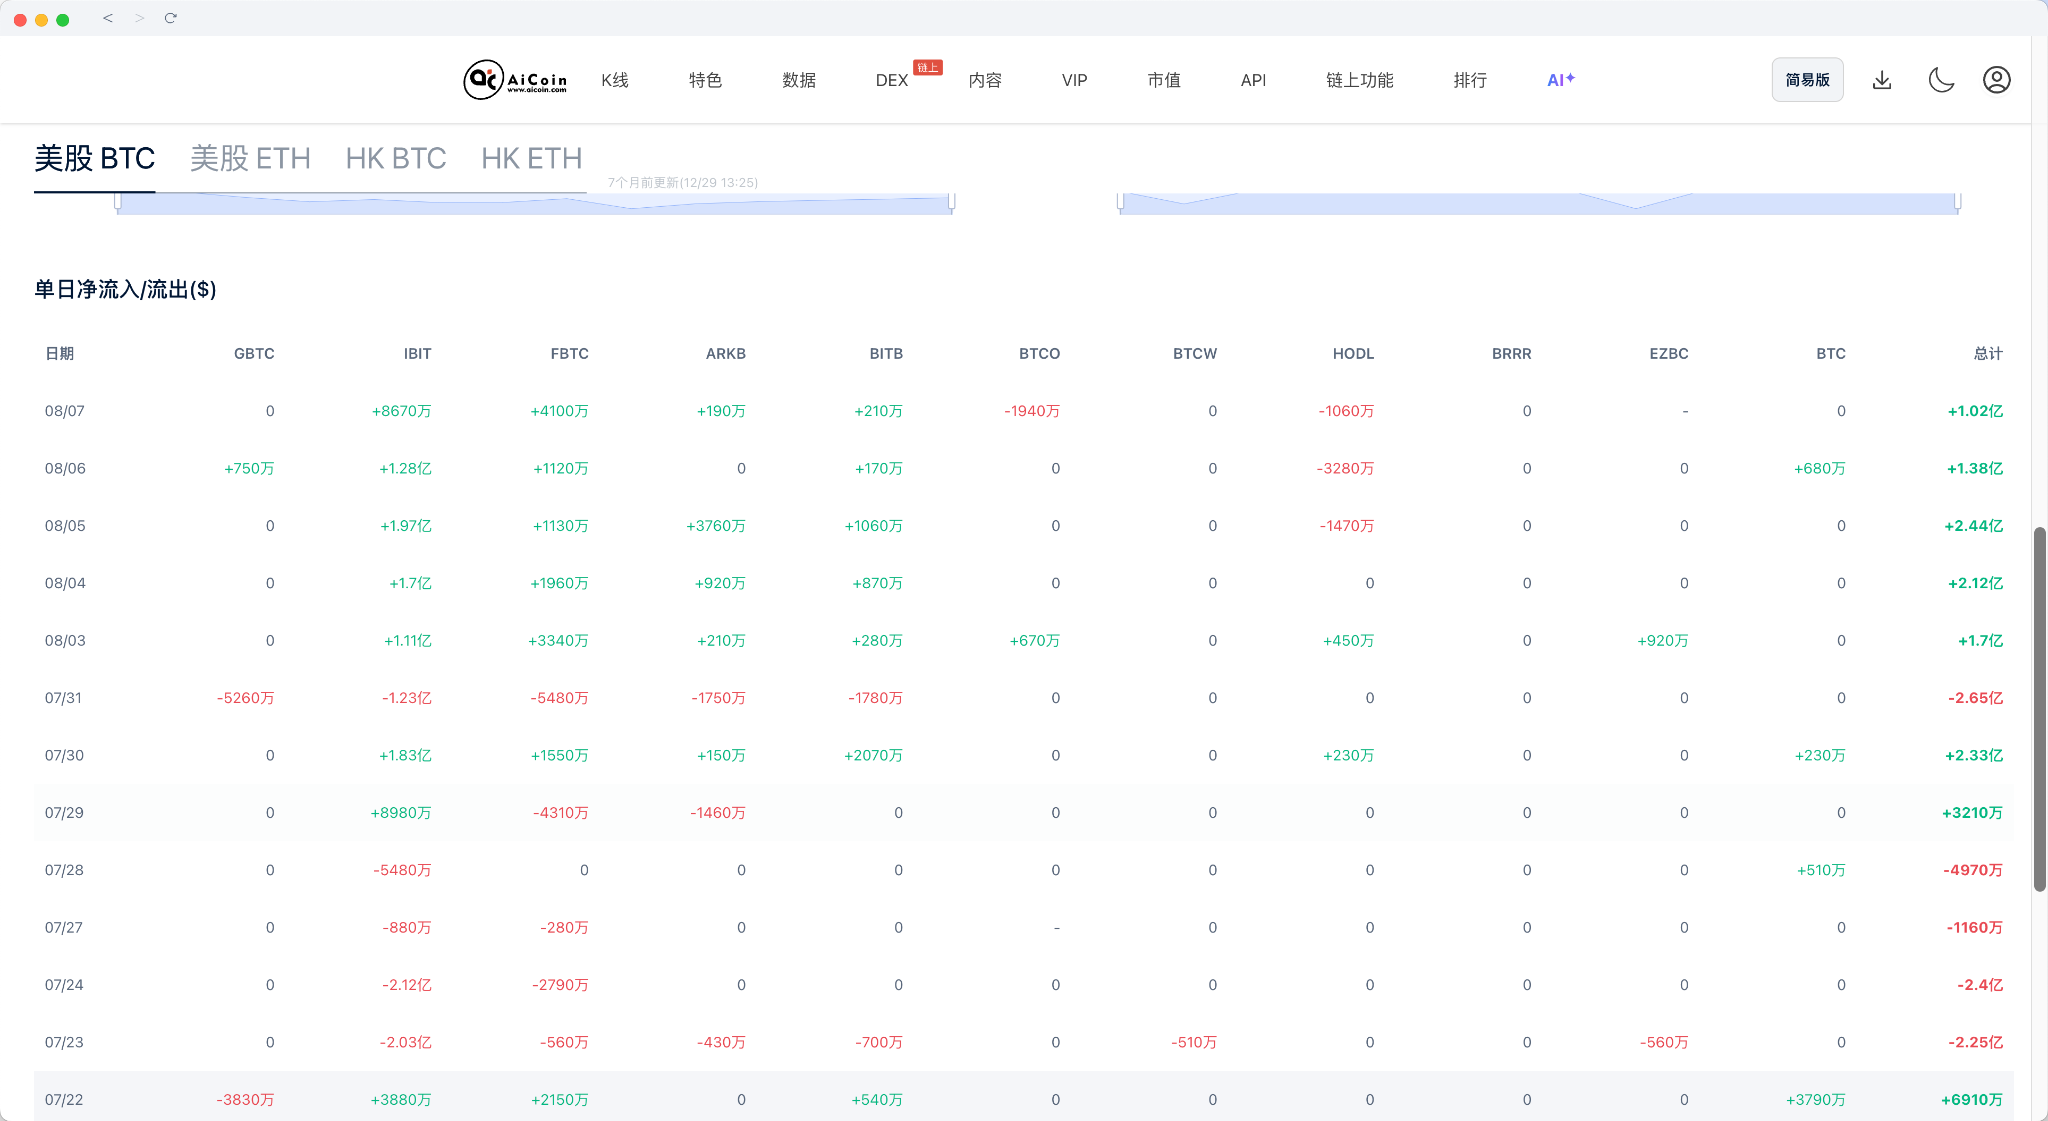
Behind this seemingly bland market, there are strong signals from the funding side: BTC spot ETF weekly cumulative inflows reached 866 million dollars, hitting the highest level since mid-April this year, with BlackRock's IBIT being the main source of capital.
On one hand, institutional funds continue to enter through the ETF channel, while on the other hand, the SEC’s regulatory advancements are delayed, and expectations of interest rate hikes from the Bank of Japan are increasing, creating macro pressure. Both bulls and bears are fiercely contending at the critical position of 65,000 US dollars, as the market waits for the next catalyst that could break the balance.
1. Funding: 866 million dollars inflow hits new high since April, institutions still chasing higher
Recent data from August 9 shows that last week’s net inflow for BTC spot ETF reached 866 million dollars, marking the highest weekly level since mid-April this year, with BlackRock's IBIT holding the largest share.
The most noteworthy aspect of this data is not "how much the ETF has inflowed," but rather:
BTC is now around 65,000 US dollars, yet institutional capital has not shown a significant retreat from high positions. In comparison, net inflows in mid-July once fell below 200 million dollars, while the nearly 900 million dollars in the first week of August indicates traditional compliant capital’s acceptance of the current price level is significantly higher than at any point in July.
Meanwhile, Strategy’s holdings actions show some differentiation.
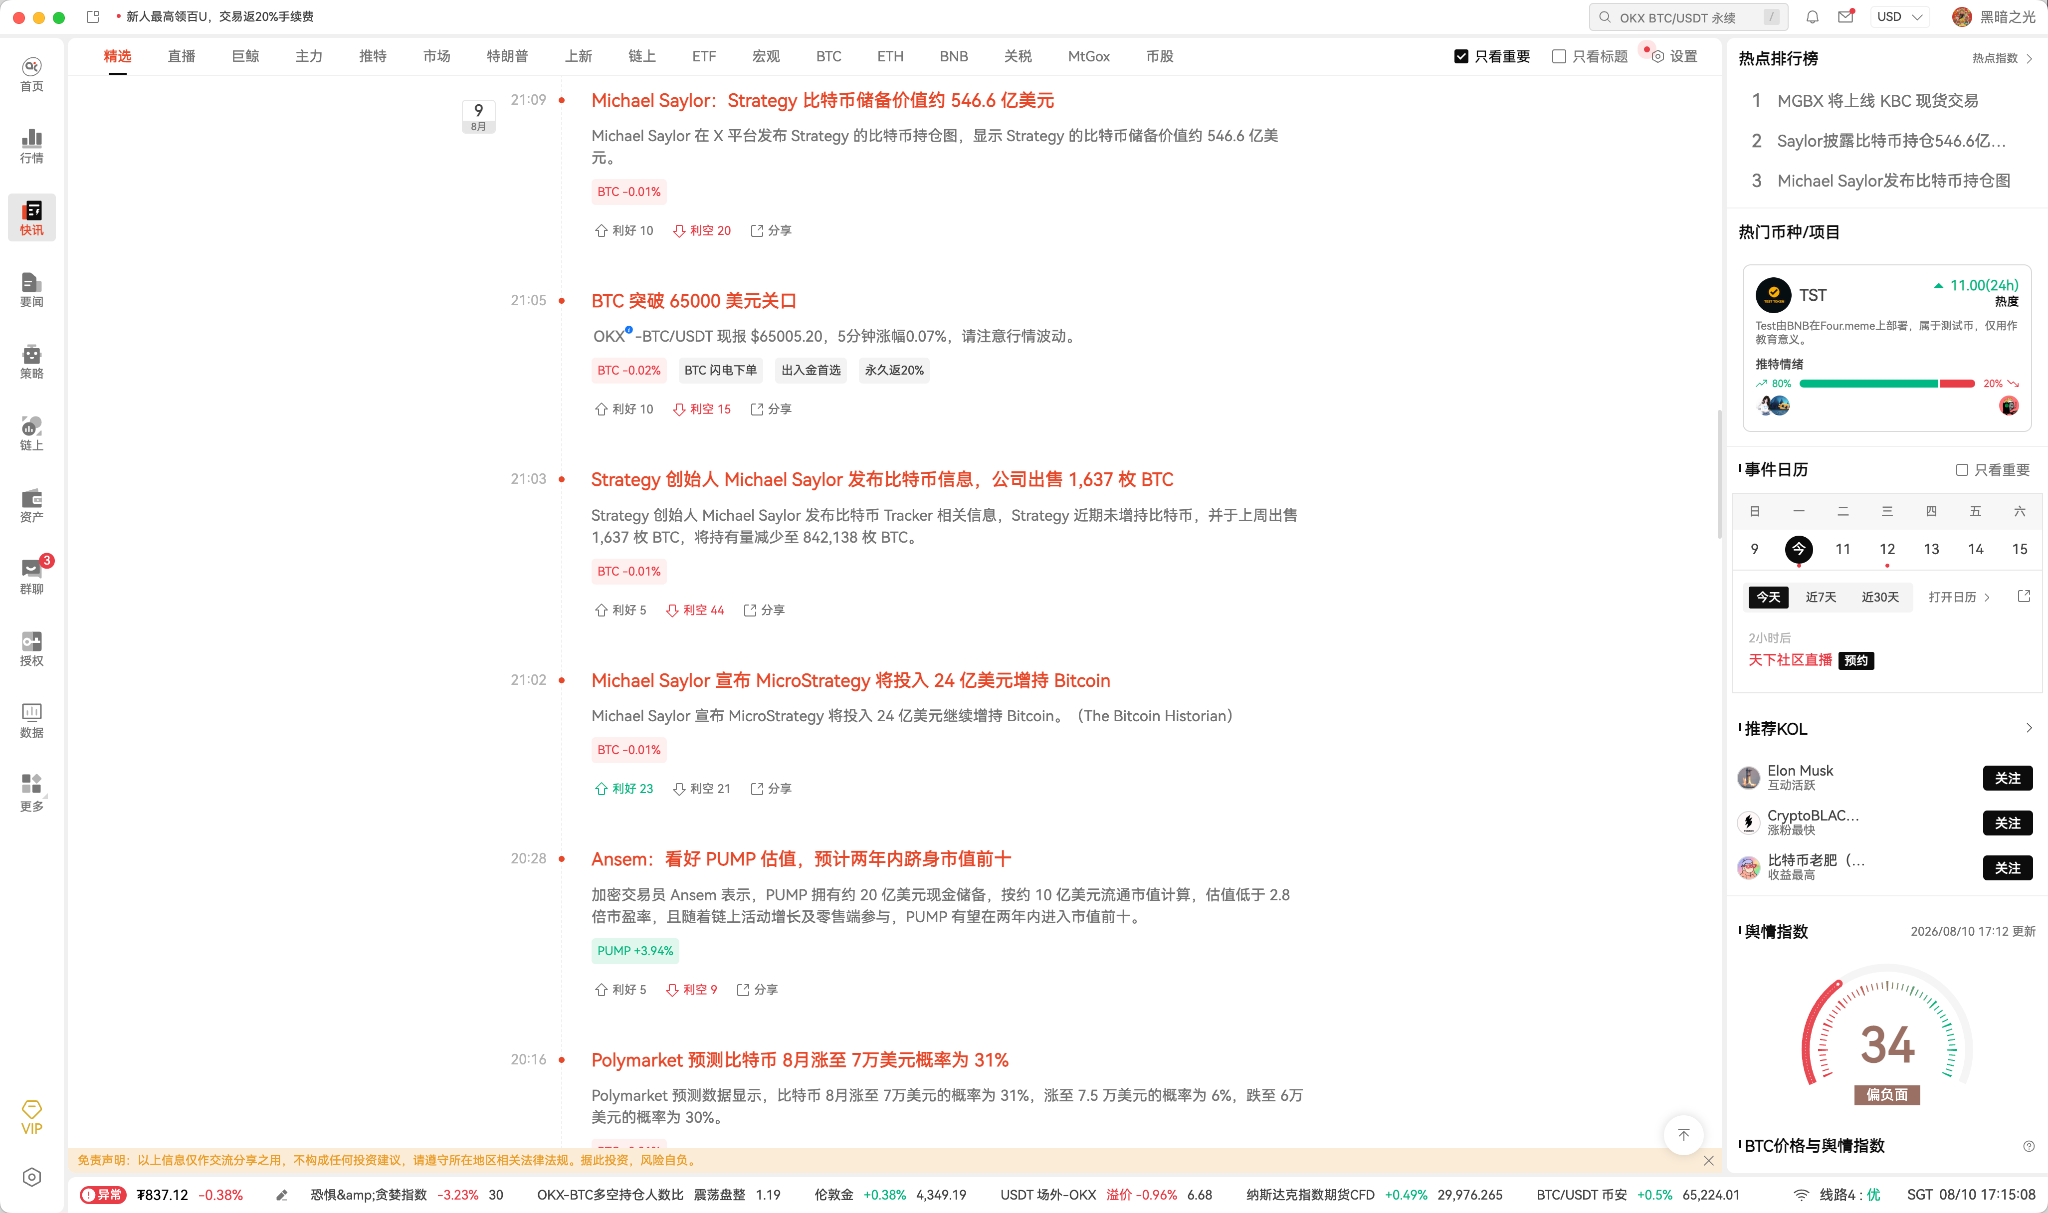
Strategy reduced its holdings by 1,637 BTC last week, worth over 102 million dollars, bringing its total holdings down to 842,138 BTC; however, Michael Saylor simultaneously announced a commitment to invest 2.4 billion dollars for further accumulation. On the surface, this appears to be a conflict of "selling + buying," but when time windows are broken down, Strategy’s sale is more of a tactical adjustment in line with the ATM issuance rhythm. The real directional guidance comes from Saylor's new 2.4 billion dollar commitment — this being the second large-scale increase declaration within the year of 2026, carries a significance far greater than the technical disturbance of selling 1,637 BTC in a single week.
2. Regulatory: CLARITY Act delayed until fall, Grayscale withdraws ADA/HBAR/DOT trust ETF
In contrast to the strong funding side, regulatory progress has noticeably slowed recently.
1. CLARITY Act postponed to fall
The U.S. Senate failed to advance the CLARITY cryptocurrency market structure bill before recess, with relevant voting postponed until fall.
However, it is noteworthy that: BTC still remained above 65,000 US dollars after the news was released, indicating the market has formed a consensus that "delay but will eventually pass," and the delay itself has become a potential favorable catalyst.

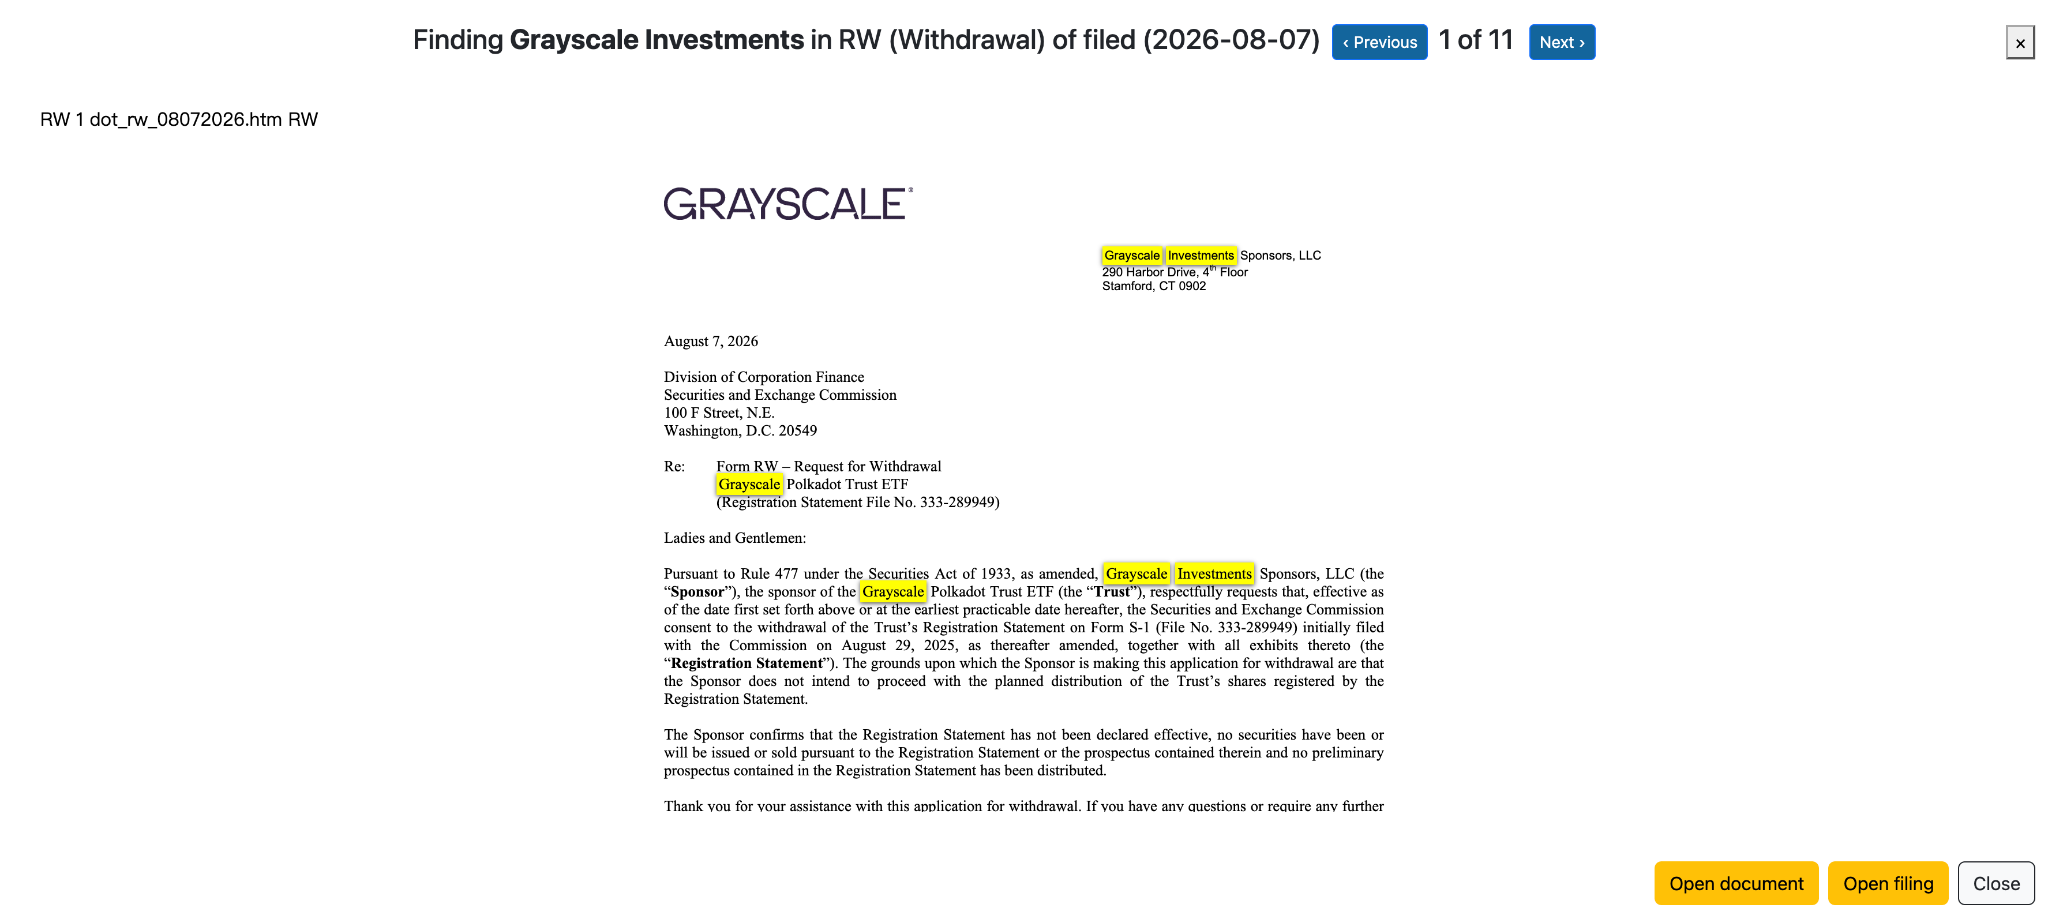
2. Grayscale withdraws ADA, HBAR, DOT ETF applications
On the other side, Grayscale withdrew ETF applications related to Cardano (ADA), Hedera (HBAR), and Polkadot (DOT), marking the largest batch of withdrawals from Grayscale so far in 2026, directly affecting the compliance channel expectations for these three mainstream altcoins.
When viewing these two events together, it can be found that U.S. compliant funds are currently forming a very clear priority:
BTC / ETH is the core asset, mainstream Altcoins are secondary, while the compliance channels for small and medium market cap assets are still fraught with uncertainty.
This also explains why BTC and ETH have seen a significantly stronger capital reception compared to certain altcoins recently.
3. Macro: Non-Farm -23,000 + Japan September rate hike probability at 66%, dollar liquidity squeeze is brewing
The U.S. July non-farm employment decreased by 23,000, yet the unemployment rate fell to 4.1%, while data from May and June was revised downwards. This rare combination of negative employment growth and declining unemployment rate directly weakens economic expansion momentum, forcing the market to reassess recession risks and strengthen expectations for accelerated rate cuts.
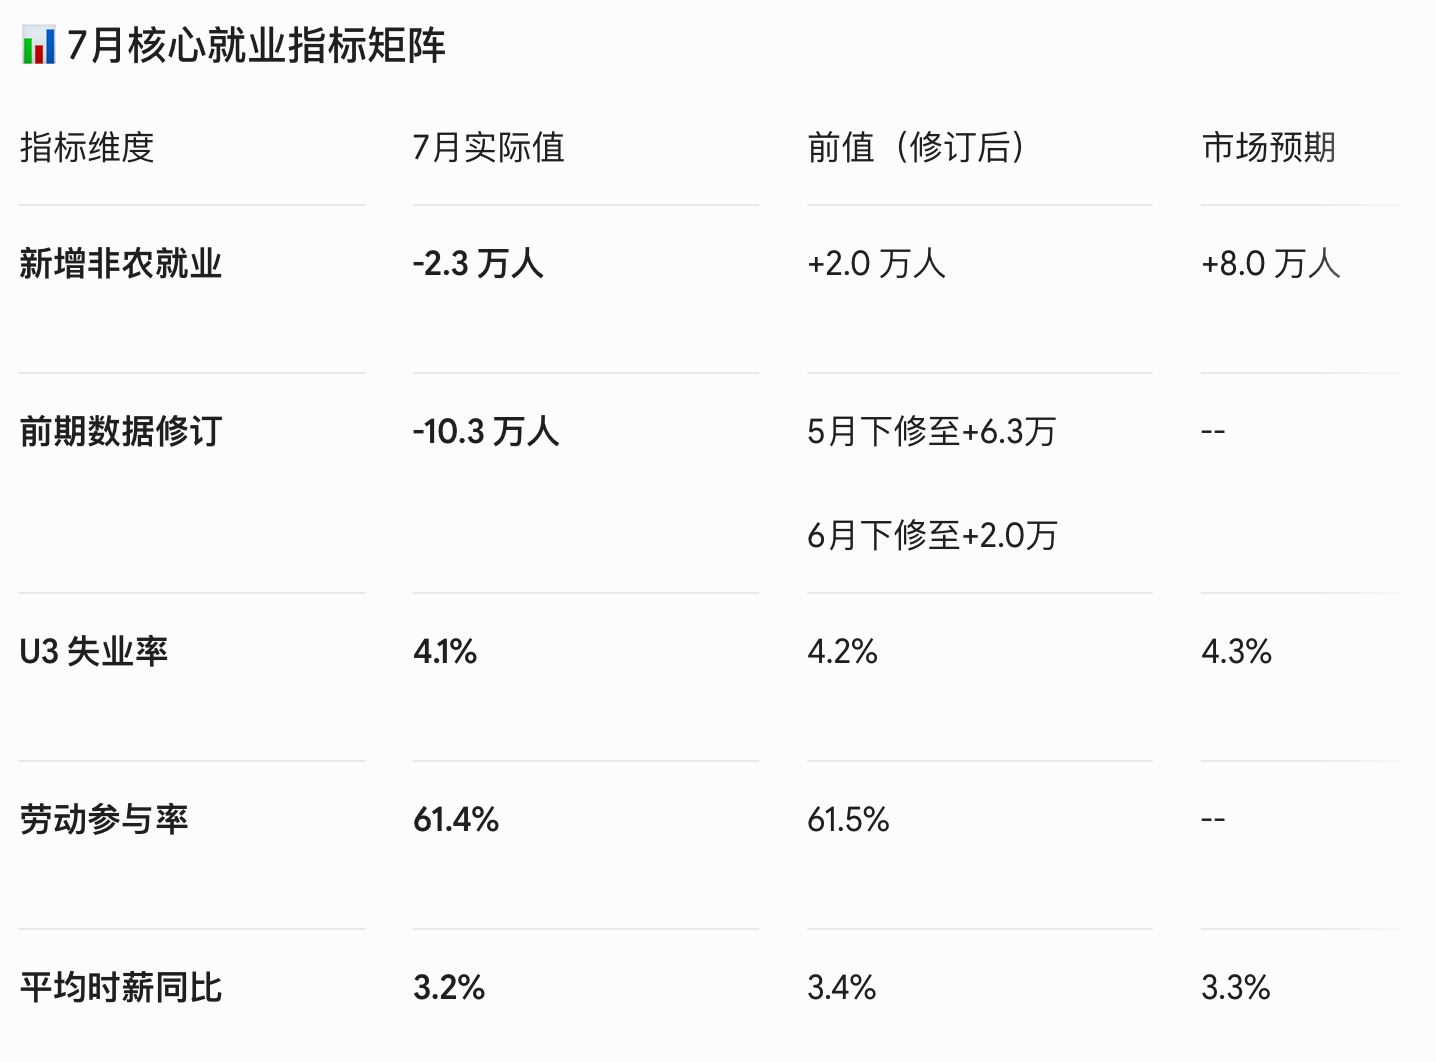
Looking only at the U.S. aspect:
Weakening employment → Increasing economic growth pressure → Rising rate cut expectations → Risk assets gaining liquidity support.
Theoretically, this should be a positive factor for BTC.
However, simultaneously signals from the Bank of Japan are turning hawkish:
The market-implied probability of a September rate hike has surged from 30% at the end of July to 66%, with the yield on Japan's 10-year government bonds rising to 2.810%, and the 2-year government bond yield briefly touching about a 31-year high of 1.620%.
What does a rate hike in Japan mean?
In recent years, a large flow of global funds has utilized low-cost yen financing to reallocate to risk assets such as stocks, bonds, and cryptocurrencies.
If Japan continues to raise interest rates:
Yen financing costs ⬆️
⬆️ Carry Trade returns decrease
⬆️ Arbitrage funds begin to flow back
⬆️ Global risk asset liquidity is under pressure
Therefore, BTC is currently in a very typical "liquidity tug-of-war":
ETF fund inflow + Fed rate cut expectations = upward thrust
Japanese rate hike + yen arbitrage contraction = downward pressure
The two forces are currently in a state of balance, effectively "locking" BTC around 65,000 US dollars.
4. Trading Strategy: CPI and Bank of Japan, who will become the next "directional K-line"?
In the short term, 65,000—66,000 US dollars remains BTC's most important battleground range.
The focus should then be on two macro lines:
┌── CPI below expectations
│ ↓
65,000 US dollars stuck ─────┤ rate cut expectations intensify
│ ↓
│ breakout above 66,000 US dollars
│
└── Japan September rate hike
↓
Carry Trade contraction
↓
Back test to 62,000 US dollars
Of course, true breakthroughs will not be determined solely by macro data. Macro is responsible for creating volatility, while funds determine direction.
Therefore, after the CPI announcement, it is advisable to simultaneously monitor the BTC perpetual market for:
- whether the active buy-sell volume suddenly expands;
- whether large transactions significantly lean towards one side;
- whether the funding rate switches rapidly;
- whether long-short liquidations show a concentrated outbreak;
- whether there are large-scale withdrawals/orders at key price levels in the order book;
- whether whale positions show significant changes.
This data can be programmatically obtained through AiCoin Open Data API; while ordinary traders can directly utilize AiCoin’s K-line, major order tracking, funding rate, price alerts, and other features for market monitoring.
Free experience: https://www.aicoin.com/zh-Hans/opendata
Wishing you a successful trade🤝
免责声明:本文章仅代表作者个人观点,不代表本平台的立场和观点。本文章仅供信息分享,不构成对任何人的任何投资建议。用户与作者之间的任何争议,与本平台无关。如网页中刊载的文章或图片涉及侵权,请提供相关的权利证明和身份证明发送邮件到support@aicoin.com,本平台相关工作人员将会进行核查。