Issue Twenty-Five of "Jiang Feng Trading Strategy Diary"
Recently, the Bitcoin market may be the stage most likely to cause people to have a "directional illusion" in this period. On one side, Bitcoin has been fluctuating around $65,000, with the market's volatility decreasing; on the other side, a noteworthy change has occurred: the Bitcoin spot ETF has seen a net inflow for five consecutive trading days, accumulating to $865.3 million.
On-chain data shows that Ahr999 is only 0.3587, the Puell Multiple is as low as 0.21, and the MVRV Z-Score is also just 0.39. Looking at these data together raises the question: has Bitcoin entered a value bottom area? However, if we consider the U.S. Treasury yield and the expectation of Federal Reserve interest rates, things are not that simple.
Therefore, today we will not guess the top, nor are we in a hurry to declare the bottom. We will combine macro factors, funds, on-chain data, and market conditions to see what position BTC and ETH are actually in.
First, let's look at the most important change: ETF funds have finally returned consistently.
In the past five trading days, the net inflow of Bitcoin ETF has been:
August 3: $170.1 million
August 4: $211.5 million
August 5: $244.4 million
August 6: $137.6 million
August 7: $101.7 million
A cumulative net inflow of $865.3 million over five days.
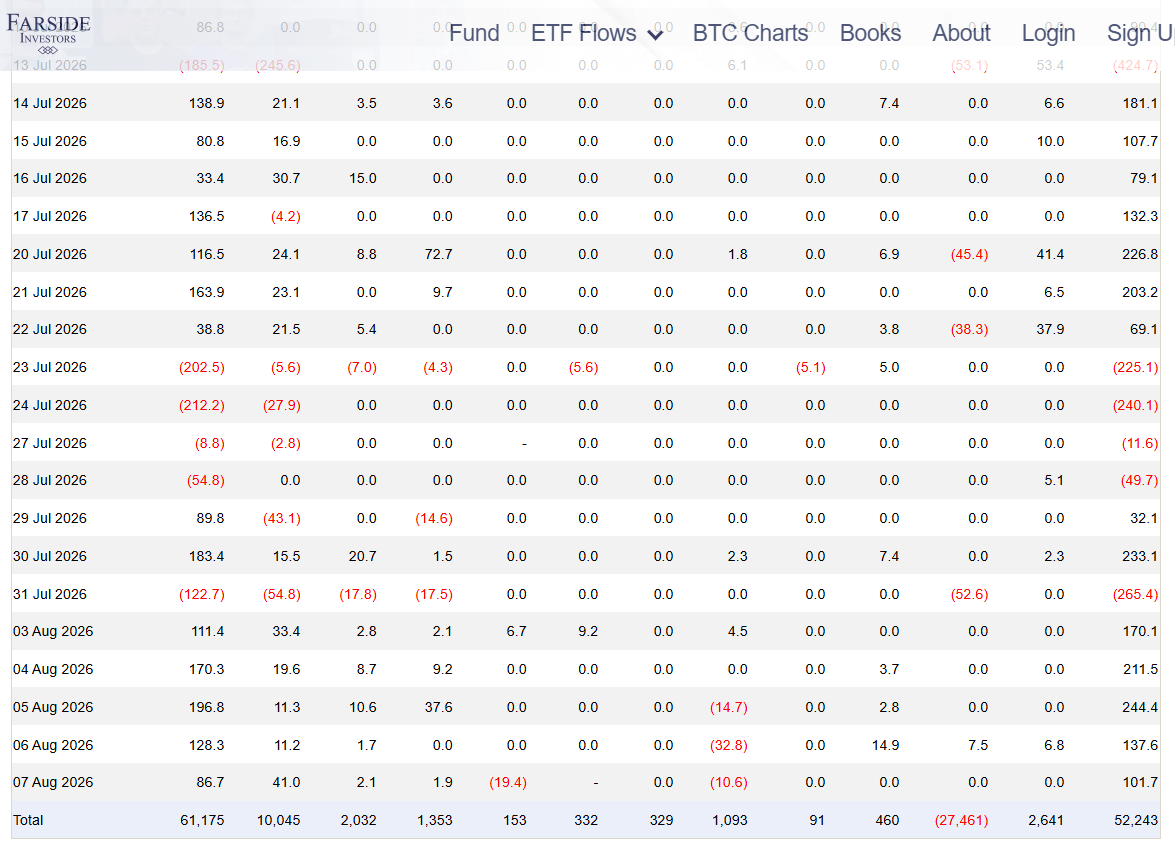
This is actually one of the most noteworthy changes in the current market because whether prices continue to rise is one thing, and whether funds are willing to buy at this position is another. One of the biggest pressures on the market previously was that funds did not catch up after the price rebounded; however, there is at least a positive signal now that ETF funds are continuously absorbing market selling pressure.
Recent market reports also show that Bitcoin returning to around $65,000, along with institutional funds and spot ETF inflows, is one of the important factors driving price rebounds. But it must be emphasized that continuous inflows into ETFs do not equate to Bitcoin immediately entering a bull market.
Fund inflows indicate that buying pressure is increasing, but whether it can transform into a trending market still requires prices to break through key resistance areas for confirmation. In other words, funds have started to vote, but prices have not yet fully given an answer.
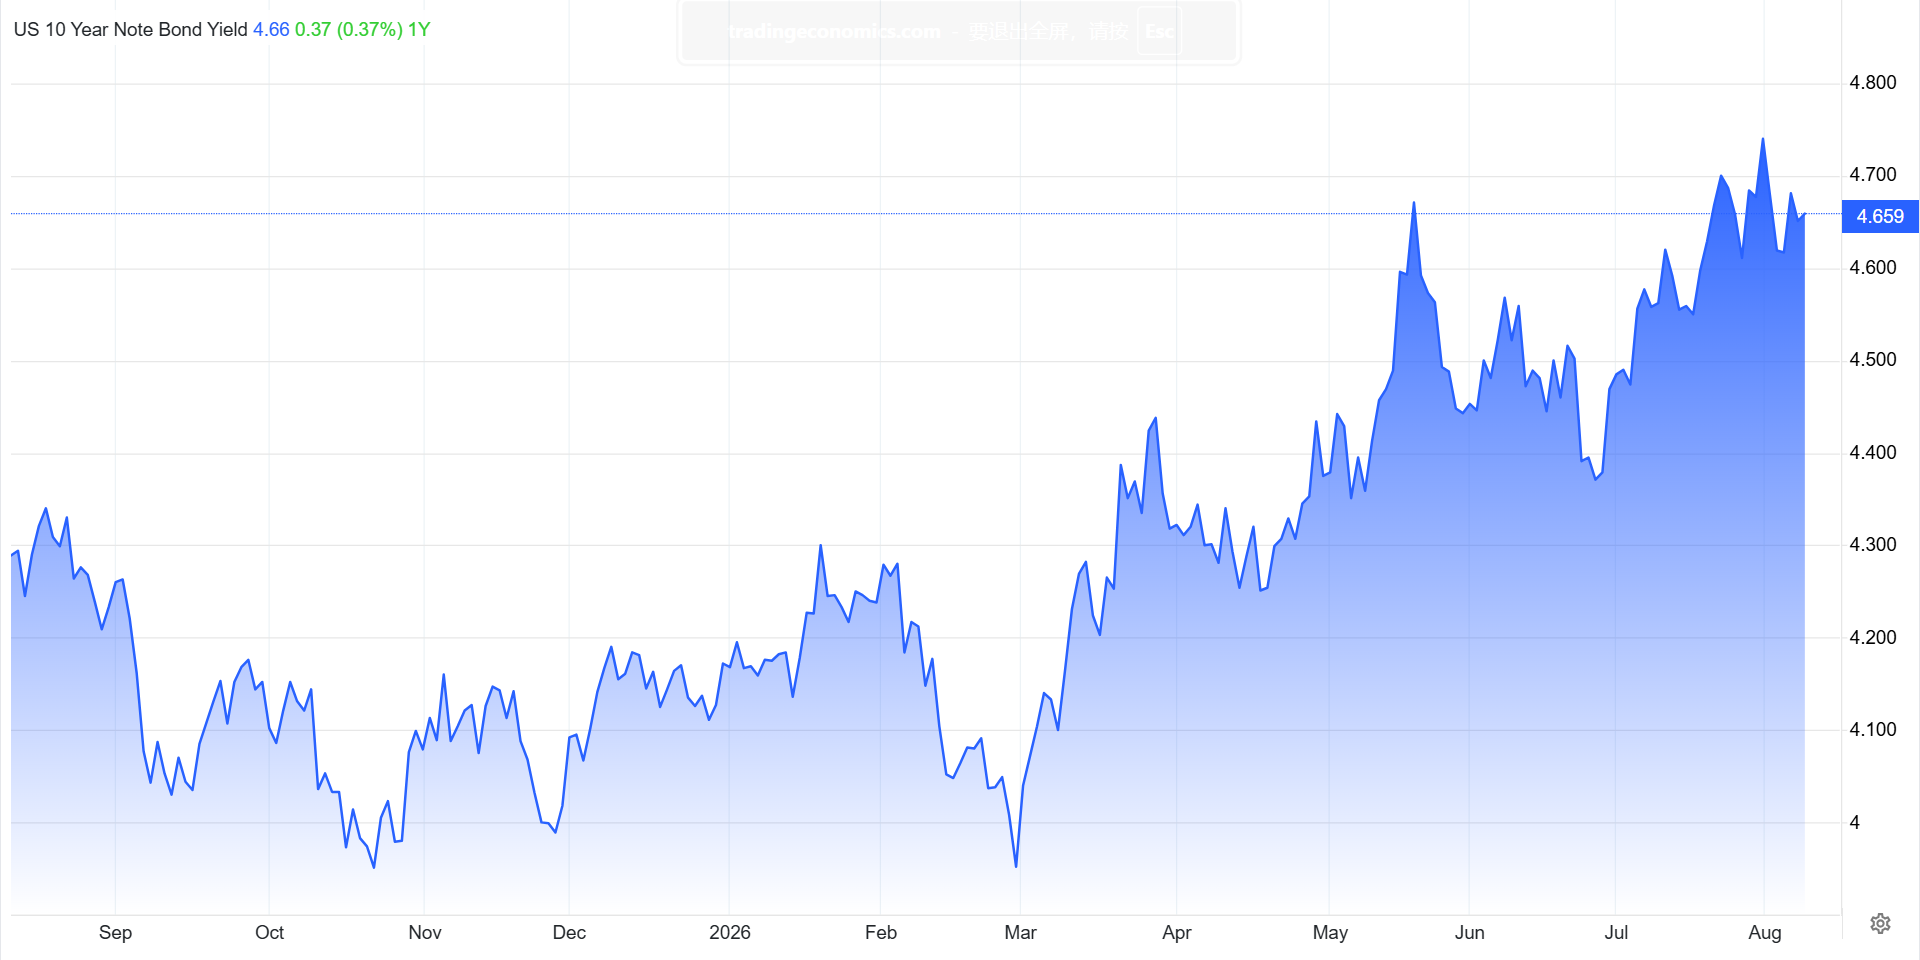
Second, what truly alerts me is that U.S. Treasury yields remain very high.
Currently, the yield on 10-year U.S. Treasury bonds is at 4.66%, which is not an easy position for risk assets. Although Bitcoin is increasingly resembling an institutional asset, it fundamentally remains a high-volatility risk asset. When the risk-free rate remains high, funds lack strong motivation to chase after high-risk assets. More importantly, there is still a significant divergence in the market's judgment of the Federal Reserve's future actions.
According to CME interest rate expectations: maintaining interest rates unchanged in September is at 54%, a 25 basis point rate hike at 46%, maintaining rates unchanged in October at 40.2%, a 25 basis point rate hike at 48.1%, and a 50 basis point hike at 11.7%. There is a very clear message here: the market does not exclude future rate hike risks, and even entering October, the probability of a 25 basis point hike is already higher than that of maintaining rates unchanged. This indicates that the current macro environment is not a typical "rate cut trade."
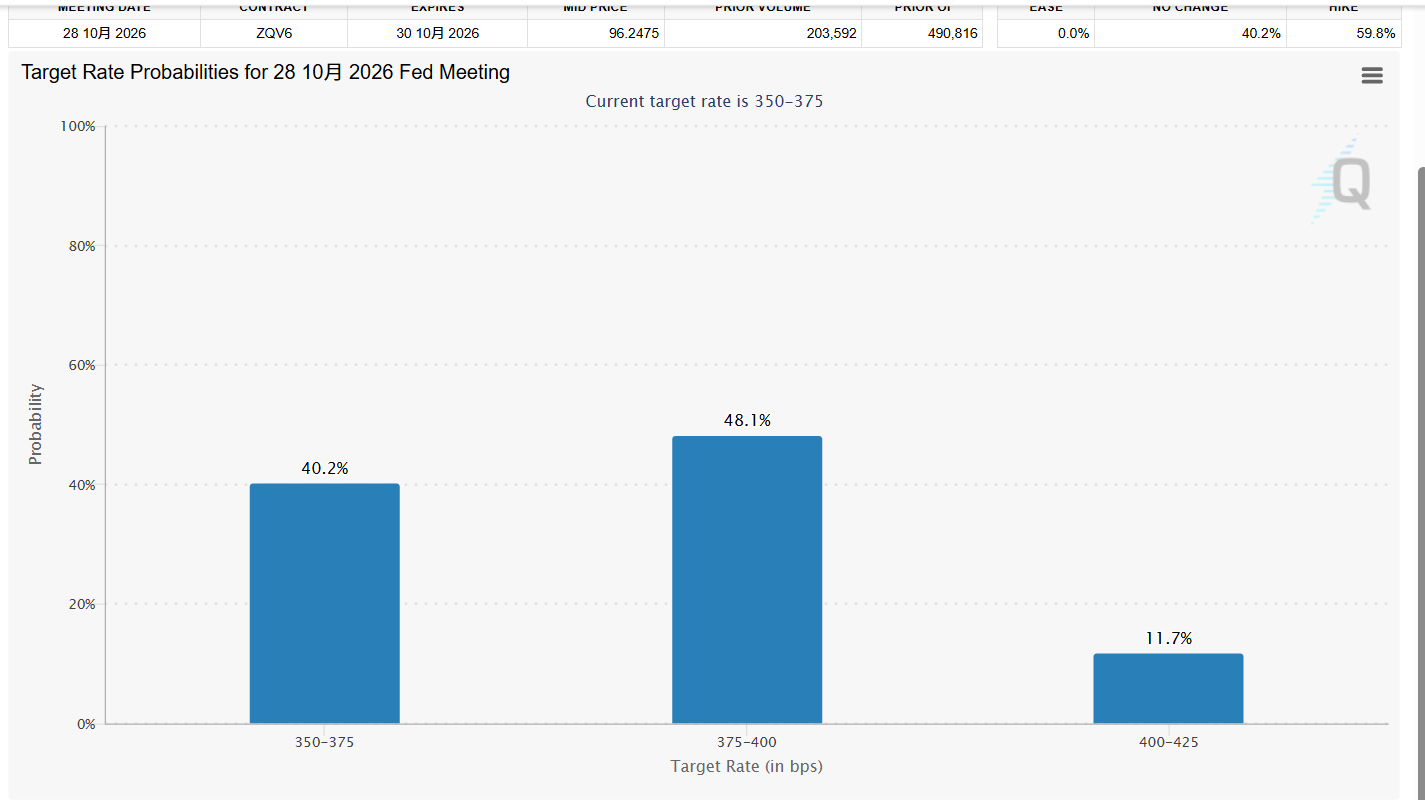
Therefore, I will not jump to the conclusion that "the bull market is coming soon" just because ETF inflows have increased. The factors that truly determine the market's valuation space are not just about whether funds are entering but also whether the price is expensive. Currently, the price of funds is still not cheap.
Third, on-chain data analysis.
Looking at these indicators: currently, MVRV Z-Score: 0.39, Bitcoin Realized Price: $52,783, Puell Multiple: 0.21, Ahr999: 0.358692.
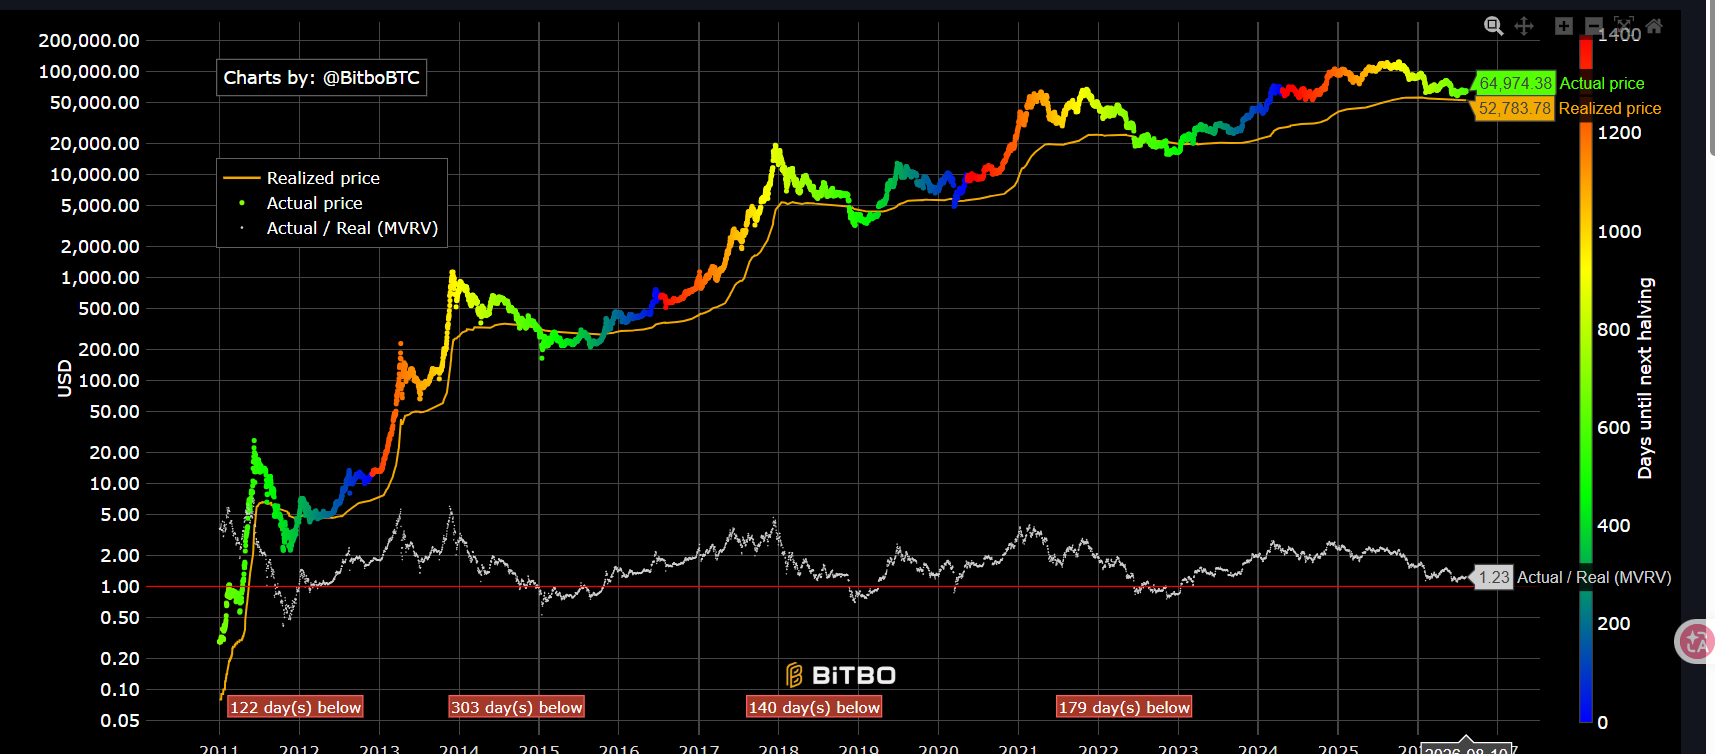
When looking at these four indicators together, the market valuation clearly does not resemble the previously overvalued phase. Especially the Ahr999 and Puell Multiple, both are currently at very low positions, with Ahr999 at only 0.3587. The Puell Multiple is only 0.21.
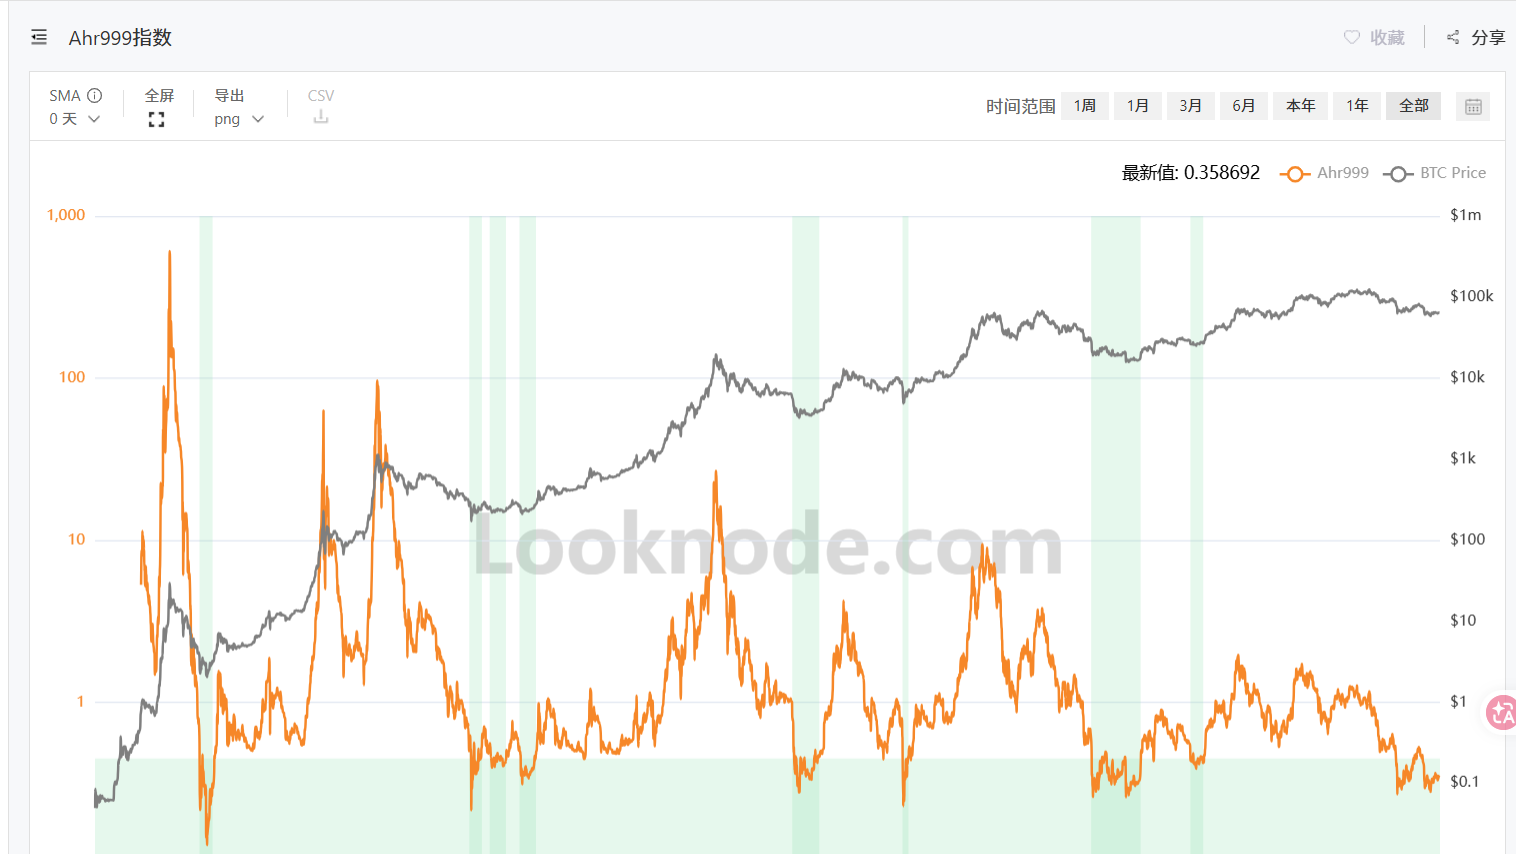
This indicates that from the perspective of on-chain valuation and miner profitability, the market has shown a certain degree of undervaluation traits. Currently, BTC's price is around $65,000, which is still about 23% above the market average realized cost price of $52,783. This means that the market is not in an extreme bubble area, but it has not yet returned to the vicinity of the realized price.
This is why my current judgment about the market is increasingly leaning towards the idea that it may be gradually transitioning from a "high-risk area" to a "value area," but it still cannot be directly defined as an absolute bottom at a historical level.
Fourth, what does an MVRV Z-Score of 0.39 mean?
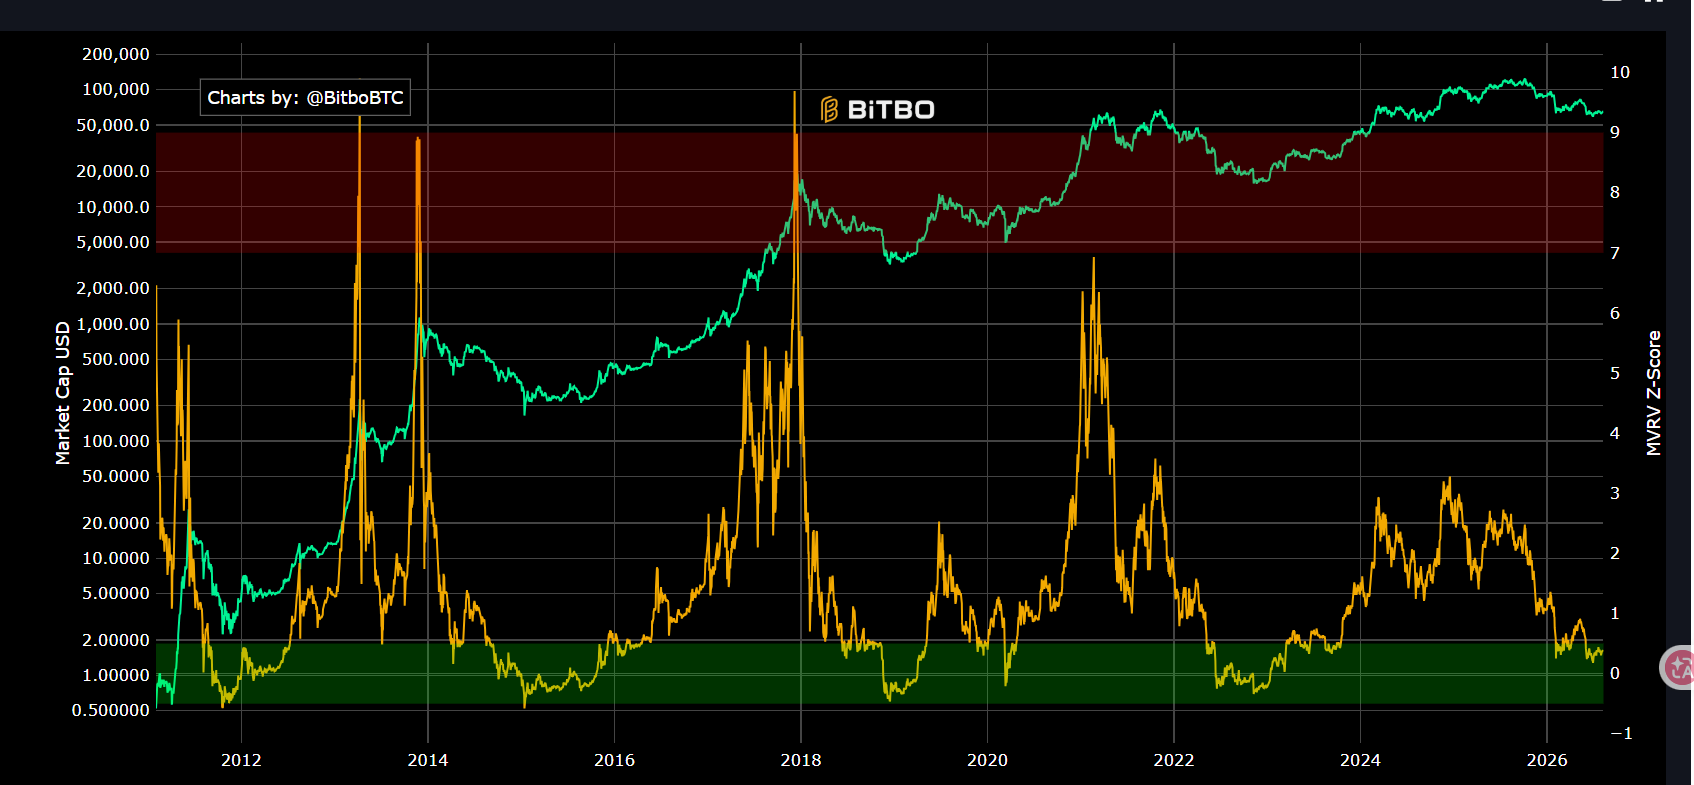
I believe this indicator is worth discussing separately. The MVRV Z-Score mainly judges whether Bitcoin is currently overvalued or undervalued based on the relationship between market value and realized value. Right now, it is only 0.39, and if we look at historical extreme bear market bottoms, the MVRV Z-Score often approaches even lower levels. Historical data indicates that bottoms generally occur in the range of -0.2 to -0.5, so 0.39 is more suitable for defining as undervalued, but it has not yet shown extreme bottom signals.
This is consistent with my previously emphasized viewpoint: the most dangerous thing now is not being bearish, but directly interpreting "undervalued" as "immediate price increase and bull market arising" just because a few indicators are low. The market can remain undervalued for a long time, and it is still advisable to pay attention to whether the resistance above can effectively be broken and stabilized!
Fifth, why is a Puell Multiple of 0.21 worth paying attention to?
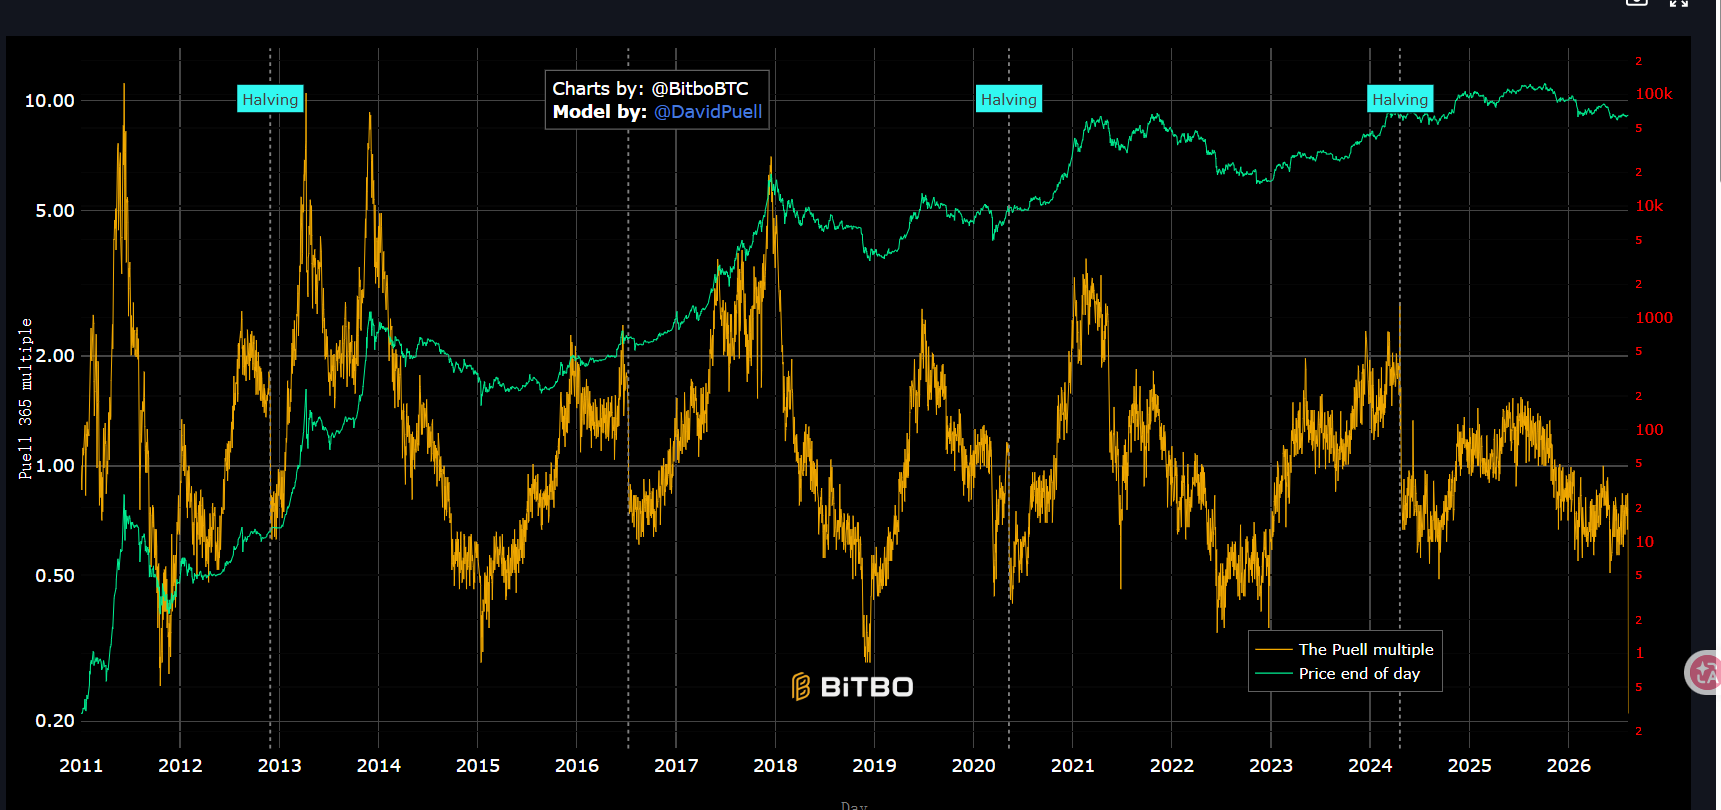
The current Puell Multiple is 0.21, which is already very low. The Puell Multiple is mainly used to observe the changes in Bitcoin miners' income relative to historical levels. When this indicator stays in extremely low territory for a long time, it often indicates that miner income is under pressure, and the market is entering a cyclical undervaluation phase. Therefore, this data is a clear positive signal for long-term investors.
However, for short-term traders, its significance is not so direct. Why? Because miners' costs can tell us whether the market has entered a value area, but they cannot tell us whether prices will rise or fall tomorrow. This is why I have always emphasized that on-chain indicators determine cycles, while candlestick charts are meant to find positions; the two should not be mixed.
Sixth, so how should we view BTC now?
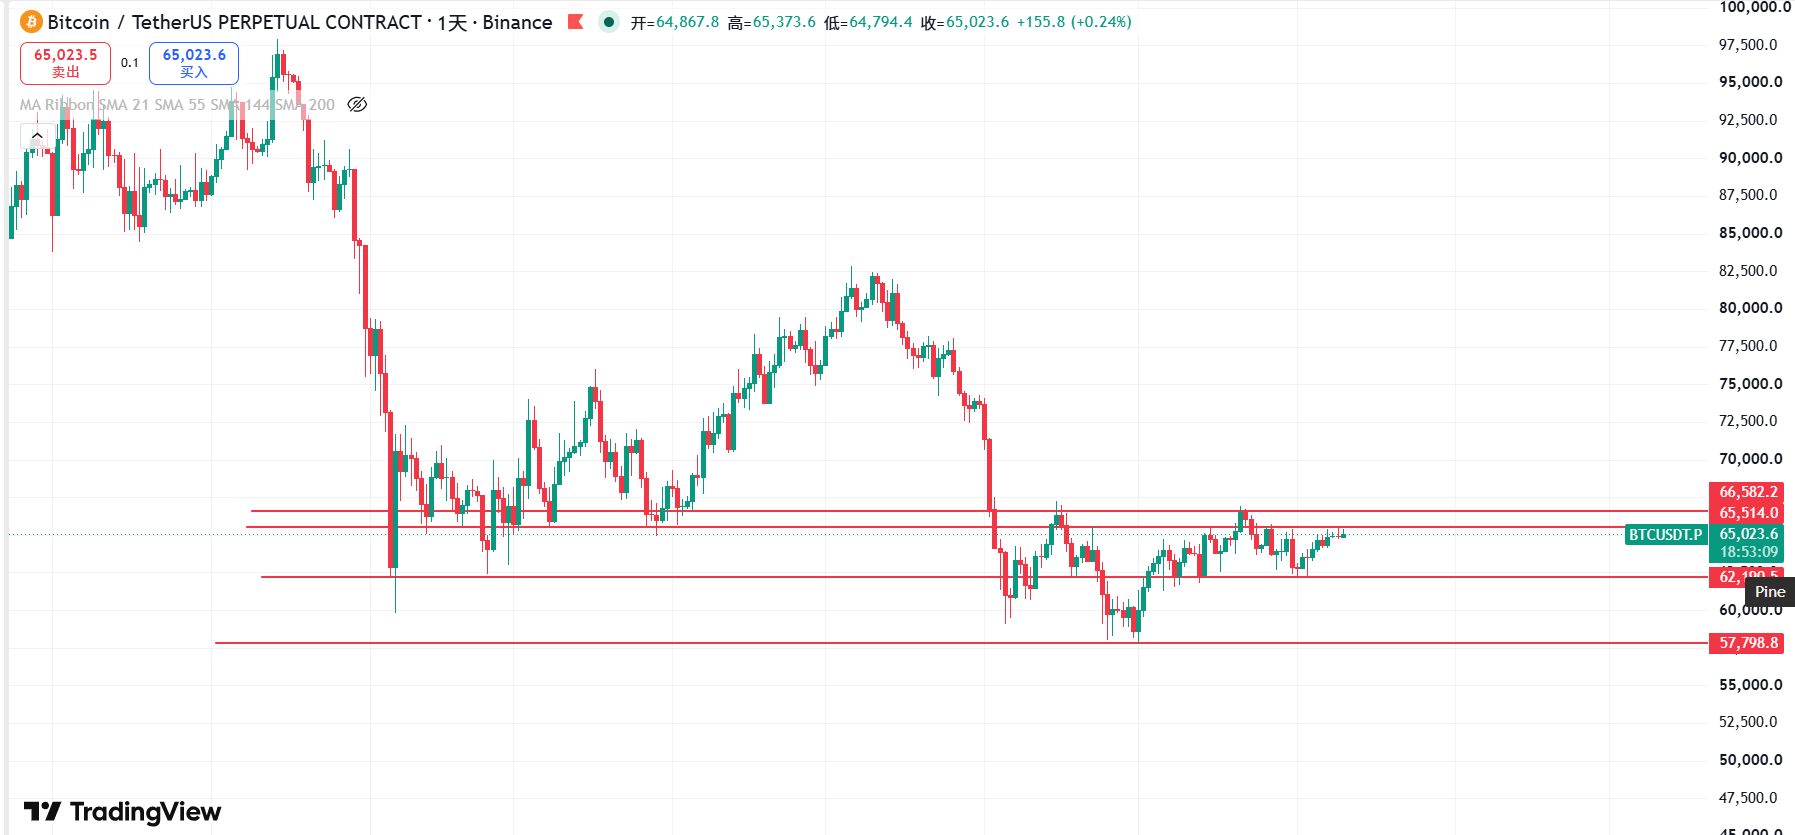
Currently, BTC is around $65,000. From the market's perspective, $65,000 remains a very important psychological barrier, and there have been multiple disputes in the market around this range before. So the most important thing now is not to guess whether $65,000 is the top or bottom, but to observe:
Situation One: Effective breakout of $65,000 to $67,000
If BTC can break above $65,000 to $67,000 with volume and stabilize, then the market structure will clearly strengthen, especially if the ETF continues to see net inflows. In this scenario, the probability of a price surge will significantly increase due to the resonance between funds and price, and previously bearish positions will need to reduce their holdings significantly and will not continue to short blindly at resistance levels.
Situation Two: Again facing resistance at $65,000 to $67,000
If the price repeatedly tests $65,000 to $67,000 but fails to solidify, and ETF fund inflows begin to weaken, there may still be phase resistance at this level. In this case, I prefer to wait for a rebound back to the resistance area before considering openings rather than chasing shorts at low positions.
Situation Three: Falls below $62,000 to $62,500
If BTC falls below $62,000 to $62,500 again, then the short-term structure will clearly weaken. At that point, the market will need to reassess whether the previous rebound is a trend reversal or merely a rebound within the downtrend.
So what I am currently paying most attention to is not the $65,000 itself, but whether $65,000 to $67,000 can really stabilize.
Seventh, what is the situation with ETH now?
Currently, ETH is near $1,920. The trend of ETH is somewhat weaker compared to BTC. The current biggest characteristic is that BTC is fluctuating around $65,000, while ETH still has not formed a very strong independent trend.
If BTC can break $65,000 to $67,000 and form a trend, then ETH will more easily follow the funds to make further gains. Conversely, if BTC continues to face pressure in the $65,000 to $67,000 range, ETH will also be prone to retest lower support. Therefore, at this stage, ETH is still more suitable to follow BTC to determine direction, while also identifying its own key resistance and support.
Eighth, bringing all the data together, what is the real conclusion?
If we combine all today's data, the ETF has seen a net inflow for five consecutive days, accumulating +$865.3 million—bullish; 10-year U.S. Treasury yield: 4.66%—bearish; probability of a September rate hike: 46%—bearish; probability of an October rate hike: 48.1%—bearish; MVRV Z-Score: 0.39—undervalued; Realized Price: $52,783—BTC is still above market average realized cost; Puell Multiple: 0.21—leaning towards cyclical undervaluation; Ahr999: 0.358692—undervalued!
Thus, the current market is actually very contradictory; the funds are improving, on-chain valuations are decreasing, but the macro interest rate environment remains tight. This is also why BTC has not yet shown a real trend and is still fluctuating around $65,000.
Ninth, my view: Do not rush to define bull or bear.
If I were to summarize the current market in one sentence:
"Bottom signals are increasing, but a trend reversal still needs price confirmation. This differs significantly from the previous market environment.
Previously, it was more: high valuation + high interest rates + money outflow. Now it is gradually shifting to: low valuation + ETF fund return + high interest rates, so the market is changing, but change does not mean the trend has reversed. Therefore, my trading thought process remains unchanged: do not chase rises, do not blindly short at low positions.
If BTC rebounds to key resistance areas, I will still closely observe whether shorting opportunities arise.
However, if the market truly breaks through $65,000 to $67,000 and stabilizes, while ETF funds continue to flow in, I will also respect the market and not hold on to previous bearish views. The biggest taboo in trading is letting your views override the market.
What’s truly important is when fundamentals, funds, on-chain data, and price trends resonate—it is at that moment that the win rate truly increases.
📌 Trading Thoughts from Issue 24
BTC
Current Price: around $65,000
First Resistance Area: $65,300 to $65,700
Second Resistance Area: $66,000 to $67,000
Break and stabilize, observe whether further upside space opens, if hitting resistance at highs, focus on short opportunities.
Below, key focus: $62,500 to $63,200
If further lost: around $62,000
Current Strategy: Do not chase shorts, wait for rebounds to confirm pressure; if effectively breaking through $65,000 to $67,000, then pause high short strategies, waiting for new structures to form.
ETH current price: about $1,920, key focus: resistance area of $1,935 to $1,953 and the range of $2,008 to $2,040. If BTC cannot break through key resistance, ETH can still focus on short opportunities after rebounding to resistance areas.
Below, pay attention to: the $1,850 to $1,880 area. If BTC shows a trend breakthrough, ETH strategy will adjust accordingly.
⚠️: Specific strategies will be updated by loyal followers!
Right now, the market is actually more interesting than before. Because what is truly worth paying attention to is no longer just "Why isn't Bitcoin rising?" But rather, as the price remains near $65,000, why is ETF funding starting to flow in continuously? Why has on-chain valuation obviously declined? But the expectation of Federal Reserve interest rate hikes still has not disappeared? These three factors are pulling against each other. And what ultimately decides the direction of the next stage of the market may not be a single indicator, but whether funds can continue to flow in + whether macro pressures can ease + whether BTC can truly break $65,000 to $67,000.
So from now, I prefer to wait for the market to give its own answer: if it breaks through, then respect the trend. If there is resistance, then wait for an opportunity. If it breaks key support, then reassess the trend. This is my most genuine judgment on BTC and ETH currently.
—— Jiang Feng Capital
Candlesticks and indicators are just the results of prices, not the reasons for prices!

免责声明:本文章仅代表作者个人观点,不代表本平台的立场和观点。本文章仅供信息分享,不构成对任何人的任何投资建议。用户与作者之间的任何争议,与本平台无关。如网页中刊载的文章或图片涉及侵权,请提供相关的权利证明和身份证明发送邮件到support@aicoin.com,本平台相关工作人员将会进行核查。