Cryptocurrency Expert: Behind the Fluctuating Bottom of Ethereum (ETH) on August 10, Is the Trend Turning Point Hidden in the Gap of Moving Averages? Latest Market Analysis Reference
The current price of Ethereum is 1924. Many friends are feeling conflicted; there has been no significant rise or drop, and it has been fluctuating back and forth within a range for a long time. Many people hold onto their positions, unable to sell or reluctant to let go, fearing that selling will lead to a spike or shorting will trigger a rebound. This is how the market behaves; fluctuating markets are the most tormenting to the mindset, chasing rises can easily lead to buying at high points, while bottom fishing can result in buying halfway up the hill. Many retail investors always think about capturing a big surge for overnight profits, but they overlook that most of the time the market is consolidating and oscillating.
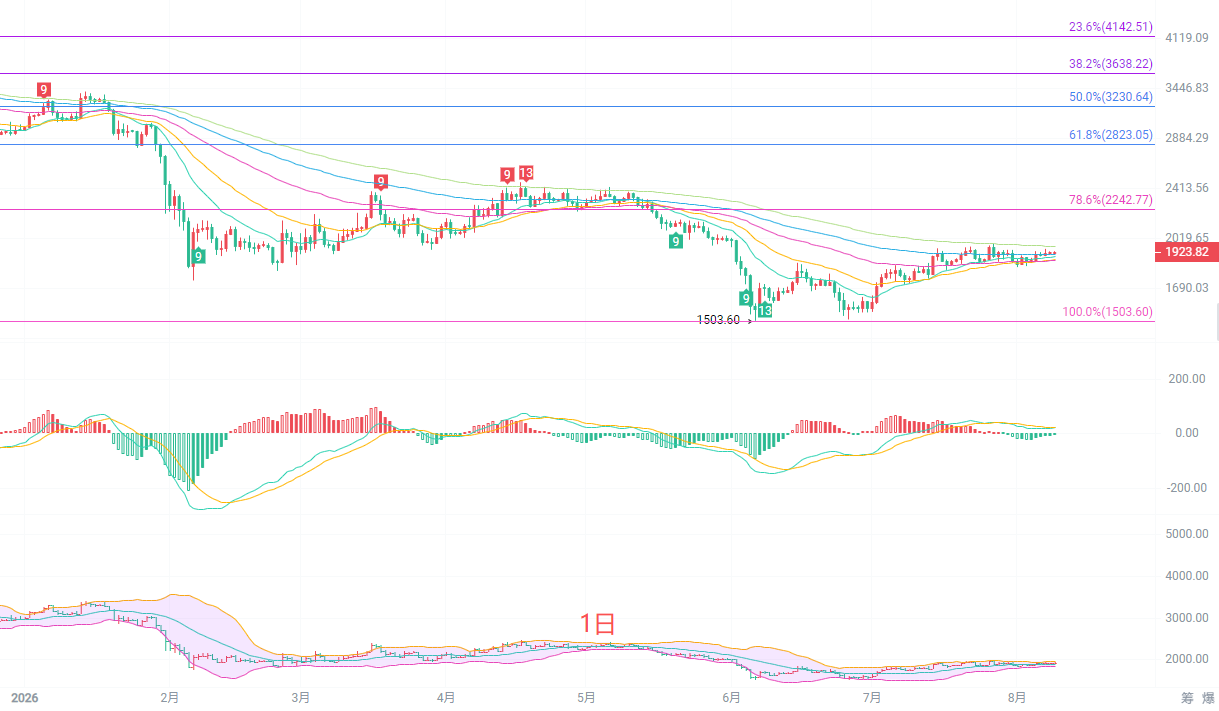
After experiencing a previous round of decline, the daily candle has begun a repair rebound from the low point of 1503. The price is currently running below the EMA30 and EMA60 moving averages, with the medium to long-term moving averages still diverging downward, and the overall bearish structure of the trend has not completely reversed. The Bollinger Bands are overall narrowing, and the volatility of the market continues to decrease. The MACD indicators, DIF, and DEA are sticking together below the zero axis, with neither bullish nor bearish momentum being strong, and there is no clear unilateral signal. From a Fibonacci retracement perspective, the first resistance above is at 2242, with key support below at 1503. The daily line is in a state of repair and oscillation after a decline, with the rebound being weak, and there has not yet been a reversal signal; for upward attacks, it is necessary to effectively stay above the key moving averages to open up upwards space.
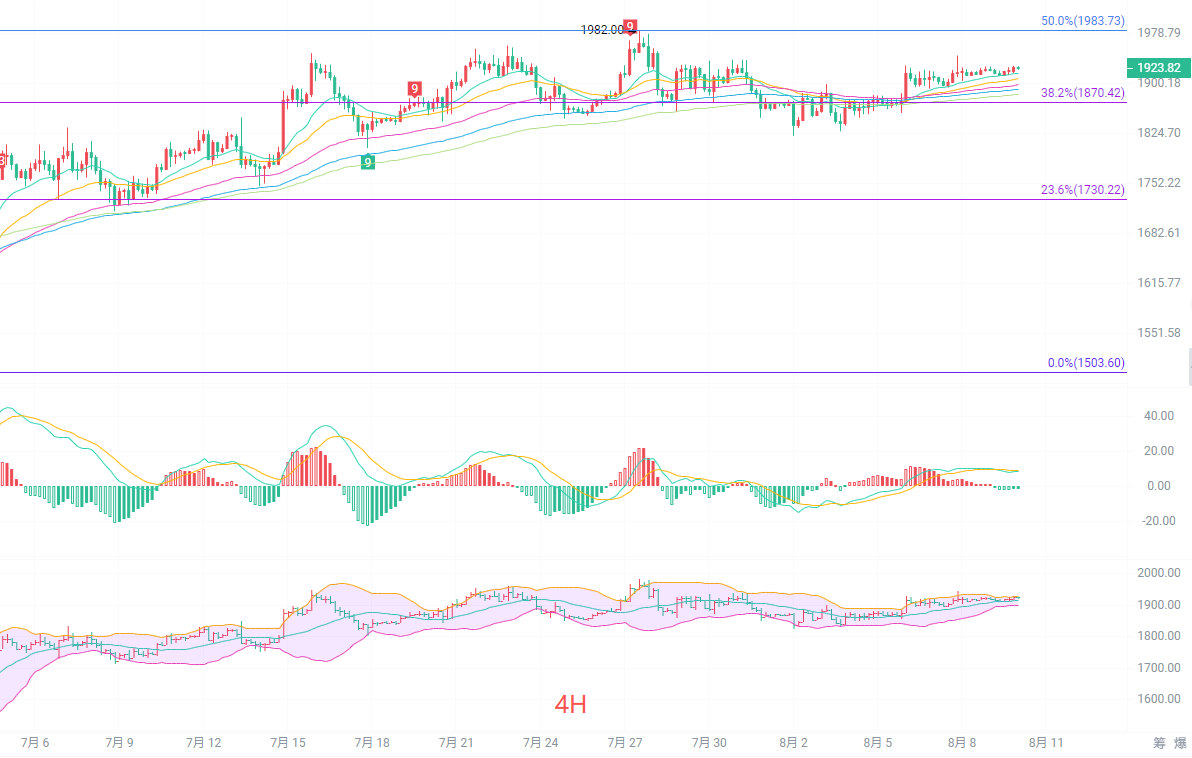
The four-hour candle has recently formed a low-level rising oscillation pattern. The price is stable above the four-hour EMA30 moving average, and the short-term bulls hold a slight advantage. The Bollinger Band channel continues to flatten, and the candles fluctuate around the middle track of the Bollinger Bands, showing clear characteristics of range oscillation. The MACD is operating slightly above the zero axis, with red bars of momentum gradually decreasing, indicating that bullish strength is waning. The key resistance on the upside is at the Fibonacci 38.2% level in the 1870-1983 range; this is an important short-term resistance. The support below is seen in the 1830-1840 range. The four-hour level has not shown a significant breakthrough, with repeated back-and-forth movements, and the upward pressure levels have not been effectively broken through many times. In the short term, be cautious of pullbacks after spikes, and it is not suitable to blindly chase highs.
Short-term Reference:
If the price does not break below 1920 to 1880, go long, set a stop loss at 1850, target 1960 to 2000.
If the price does not break above 1980 to 2010, go short, set a stop loss at 2050, target 1860 to 1820.
Specific operations should be based on real-time market data. For more detailed information, you can consult the author. The article may have a delay in publication and is suggested for reference only; risk is self-borne.

Kind Reminder: The above content is created solely by the author of the public account; ads at the end of the article and in the comments section are unrelated to the author. Please discern cautiously, thank you for reading.
免责声明:本文章仅代表作者个人观点,不代表本平台的立场和观点。本文章仅供信息分享,不构成对任何人的任何投资建议。用户与作者之间的任何争议,与本平台无关。如网页中刊载的文章或图片涉及侵权,请提供相关的权利证明和身份证明发送邮件到support@aicoin.com,本平台相关工作人员将会进行核查。