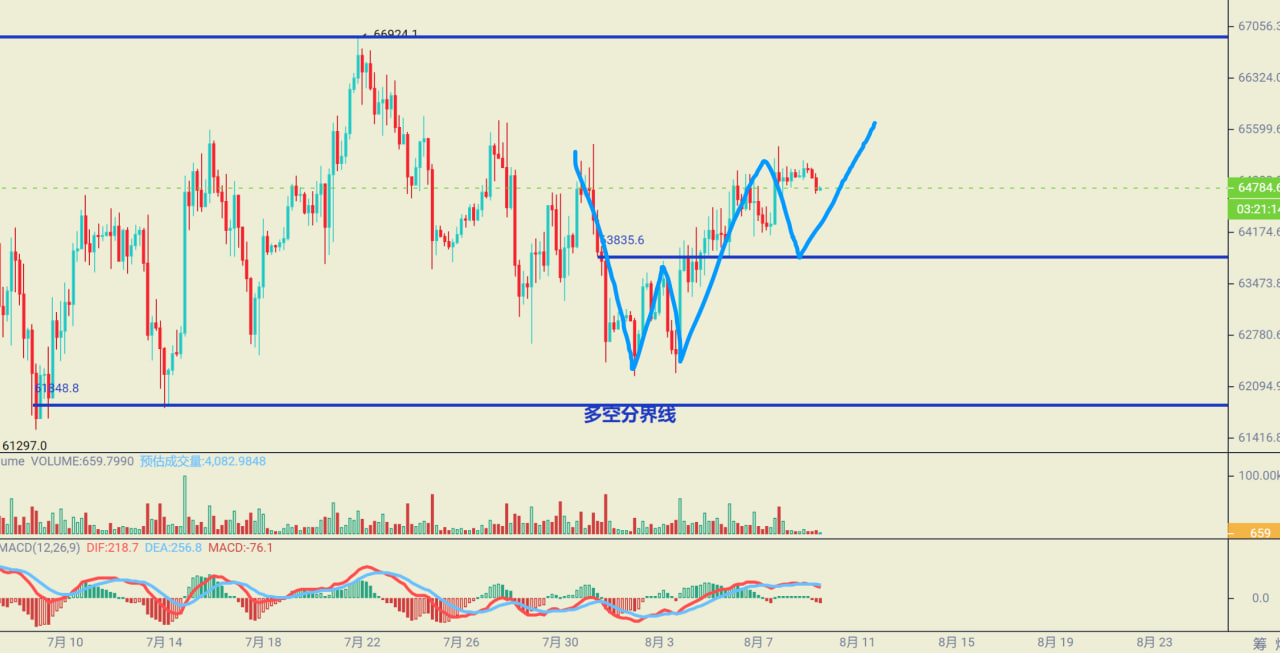
Today is Sunday, with only one trading session left until the weekly K close. The biggest feature of the current market remains: clear upward pressure and equally clear downward support, both bulls and bears are waiting for the final directional confirmation.
August 9th is also an important time point when the BIP-110 mandatory signal window opens; however, the current miner support rate is only about 2.42%, which is still a considerable distance from the 55% lock-in threshold. Therefore, the actual probability of a chain split occurring is relatively limited. What truly needs attention is that in the low liquidity environment of the weekend, any uncertainty can be amplified by the market, triggering rapid spikes or emotional fluctuations in a short period.
From the weekly structure perspective, the closing at 8 a.m. tomorrow is crucial.
If this week's weekly candle ultimately cannot produce a solid bullish candle that effectively covers the previous week's bearish candle, then the current market should still be defined as a rebound correction, rather than a trend reversal. In other words, although the market shows a certain resilience, the bulls still need a more forceful weekly confirmation to truly seize the initiative.
The current weekly and monthly cycles still maintain a slightly bullish structure, while the daily line formed a golden cross on August 7th. However, due to the onset of the weekend, there has been no clear acceleration. Therefore, the current market has the potential for an upward breakout, but also carries the risk of a short-term pullback, with the direction still being quite uncertain.
₿ Bitcoin (BTC)
Viewpoint: Volatile but leaning bullish, buying on dips is relatively advantageous, waiting for momentum to increase.
This week, the overall fund performance for the BTC spot ETF has improved, providing some support for the market. However, from a technical structure perspective, 65500—67000 still belongs to a very obvious supply pressure zone. For the bulls to truly open up greater upward space, they still need to break through this zone of dense selling pressure.
BTC is currently operating in a key competitive area, the short-term direction has not been fully clarified, so it is not suitable to frequently chase orders in the middle of the range.
More attention should be paid to trading volume and momentum:
If the price breaks through resistance with significant volume, it may be considered to follow suit;
If there is insufficient volume after a rise, caution is needed for a possible return to the range;
As long as the downward support is unbroken, overall, the cost-effectiveness of buying on dips is still slightly higher than chasing short positions.
The current weekly and monthly lines still provide some bullish support; however, true trend confirmation needs to wait for the weekly K close and whether it can stand firm in the higher pressure zones thereafter.
Support: 64000-64477, 63500
Resistance: 65200-65700, 66300-66800
⟠ Ethereum (ETH)
Viewpoint: Volatile but leaning bullish, yet short-term differentiation is obvious; beware of a quick pullback after a failed breakout.
ETH is often more easily driven by funds in low liquidity phases, producing a stronger independent trend than BTC in a short time. However, this so-called "independence" has an important prerequisite: BTC must not experience a sharp decline.
If Bitcoin suddenly weakens, ETH will still find it difficult to completely escape from the overall market rhythm. The short-term polarization is likely to return to a unified trend.
From the cycle perspective, ETH is clearly in a tug-of-war phase:
The 1-hour chart is rebounding, but the 2-hour and 4-hour charts are still in a corrective cycle, with overall momentum diminishing.
Therefore, today a specific risk signal needs special attention:
If ETH fails to challenge this week's high again and a large bearish candle with volume appears at the high level, it means the bulls have failed in consecutive upward attempts, and the bearish forces may be released, significantly increasing short-term volatility.
Conversely, if it manages to break through 1927—1939 with volume and stabilize successfully, then the recovery trend could extend further to the 1955—1982 area.
Support: 1906-1911, 1850-1870
Resistance: 1927, 1939, 1955-1964, 1982
Tencent Meeting 24-hour live broadcast room: 901-588-1279
Aicoin group chat search for Huaying community or click group link to join: https://www.aicoin.com/link/chat?cid=onjrNpKn6

This article is originally published by 【Huaying Community】 and only represents personal views. Due to certain delays in information transmission, the content is for reference only and does not constitute any investment advice. Please make rational judgments and operate cautiously.
If you need more timely daily market analysis and strategy ideas, feel free to add Safew’s contact information or add three lines: HYSQks888, to join the learning group for free.
The community has 15 professional analysts monitoring live markets throughout the day. Here, you can not only learn technical analysis methods in practice but also gain a systematic understanding of liquidation strategies and risk control systems.
免责声明:本文章仅代表作者个人观点,不代表本平台的立场和观点。本文章仅供信息分享,不构成对任何人的任何投资建议。用户与作者之间的任何争议,与本平台无关。如网页中刊载的文章或图片涉及侵权,请提供相关的权利证明和身份证明发送邮件到support@aicoin.com,本平台相关工作人员将会进行核查。