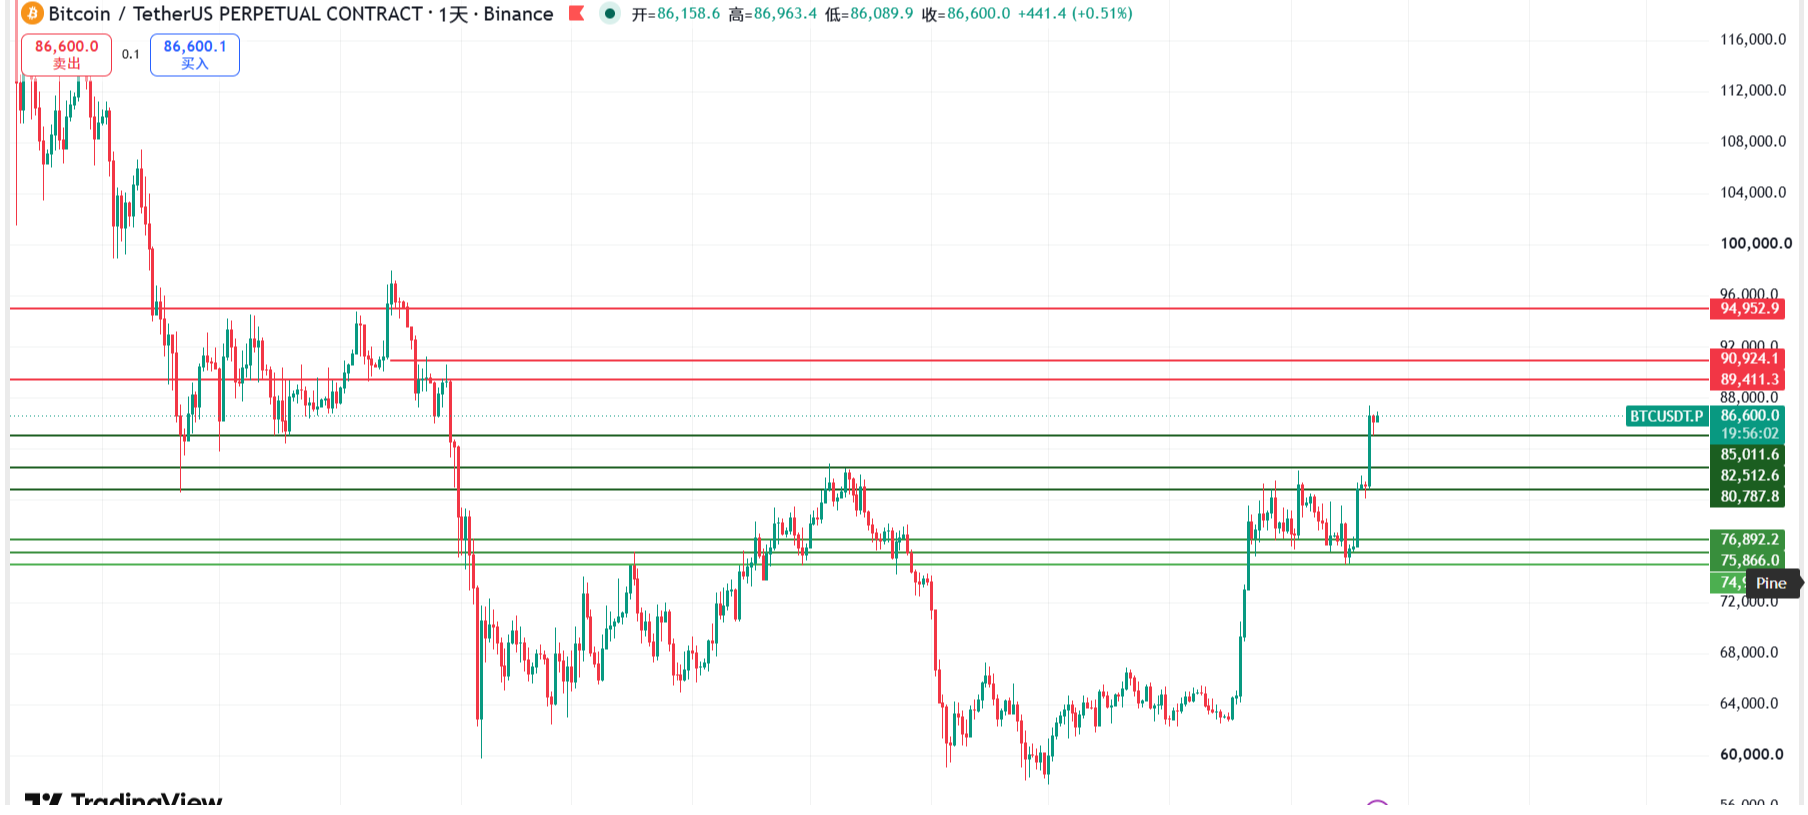
Chasing the Waves of Cryptocurrency: Ethereum (ETH) Market Analysis Reference for 8.9:
The current price of Ethereum is 1920, maintaining a range-bound pattern at the daily level. The price continues to operate above the middle band of the Bollinger Bands, with short to medium-term moving averages remaining in an upward arrangement, indicating an overall bullish trend. The MACD indicator shows the fast and slow lines above the zero axis, with bearish pressure gradually diminishing and bullish momentum maintaining moderate release. The KDJ indicator is in the middle area extending upwards, and the RSI remains in a neutral range. Although there is currently no overbought signal present, the previous high of 1982 above creates significant resistance. The price has repeatedly tested this level without effectively breaking through, and the upward momentum is gradually slowing down, suggesting the possibility of encountering resistance and undergoing consolidation.
In the short term, the 4-hour Bollinger Bands are contracting, with the market running in a narrow sideways range. The price is oscillating tightly below the upper band of the Bollinger Bands, and the moving average system maintains a bullish alignment, with solid support on the platform. The MACD is continuously contracting, and the bullish momentum is gradually weakening, while the KDJ indicator is turning downwards, indicating a short-term need for adjustment. Currently, bullish strength has weakened, making it difficult for the price to sustain upward breakthroughs. In the short term, it is highly likely to maintain range-bound oscillations; it is necessary to observe the support below and its sustaining strength. If it cannot hold the critical support area, it will further retrace to build strength. The short-term trend still follows the logic of range-bound fluctuations, and it is advised to buy low and sell high within the range during intraday operations.
Chasing the Waves of Cryptocurrency: Short-term Reference for Ethereum on 8.9:
Short Position: Short in the 1960-1930 range, stop loss above 1990, target at 1900-1870,
Long Position: Long in the 1850-1880 range, stop loss below 1820, target at 1890-1940,
Daily updates on real-time trading strategies, providing free unwinding analysis and practical market knowledge. Scan the code to follow our public account and get one-click access for connection!

There may be a delay in publishing articles, and they have timeliness. The above analysis and strategies are personal opinions for reference only; do not operate blindly!
免责声明:本文章仅代表作者个人观点,不代表本平台的立场和观点。本文章仅供信息分享,不构成对任何人的任何投资建议。用户与作者之间的任何争议,与本平台无关。如网页中刊载的文章或图片涉及侵权,请提供相关的权利证明和身份证明发送邮件到support@aicoin.com,本平台相关工作人员将会进行核查。