Cryptocurrency Circle Academician: On August 9, Ethereum (ETH) is experiencing a fluctuation that hides a mystery; will the trend turning point quietly come to fruition? Latest market analysis reference
The current price of Ethereum is 1921. After a previous downward plunge that hit a low point, the price is slowly climbing back; however, it has not yet broken out into a strong unilateral trend. Many people are hesitant about whether to buy at the bottom now or short at highs, fearing that they will be swept back and forth as soon as they enter the market. The market is currently a typical fluctuation and grinding phase, with the overall direction not yet being clearly defined, making it easy to be hit from both sides when chasing rises and killing dips.
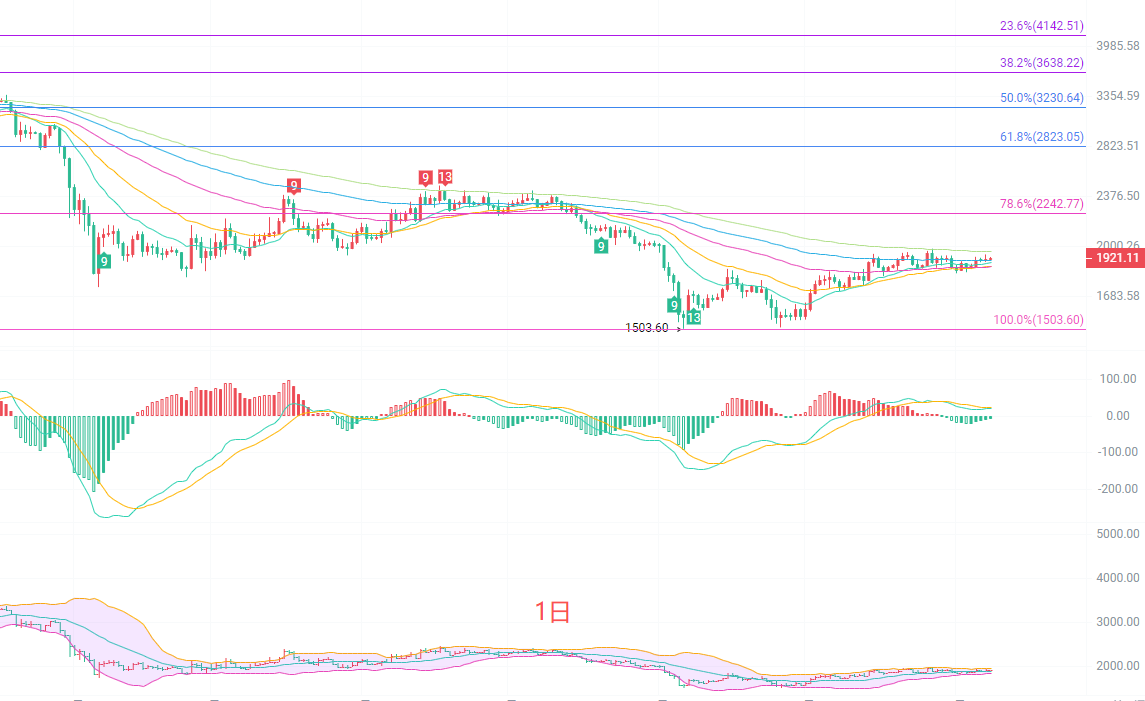
The daily K-line has completed a round of probing the bottom and rising, with the price standing above multiple short-term EMA moving averages. The moving average system gradually shifts from a downward curve to flat, and the Bollinger Bands are converging, meaning the market is entering a phase of range consolidation. The MACD indicator shows that after the golden cross occurs below the zero line between DIF and DEA, the strength of the red bars is limited, indicating that the bullish rebound momentum is not strong. The key resistance above is at the 1980-2020 range, which is the 78.6% Fibonacci level, while the support below lies at 1840-1860. On the daily chart, this is a repair rebound after a major drop; it has not fully escaped the weak pattern, and the rebound is more seen as a repair, without forming a definitive reversal signal. The larger timeframe still needs to guard against the risk of a second retest.
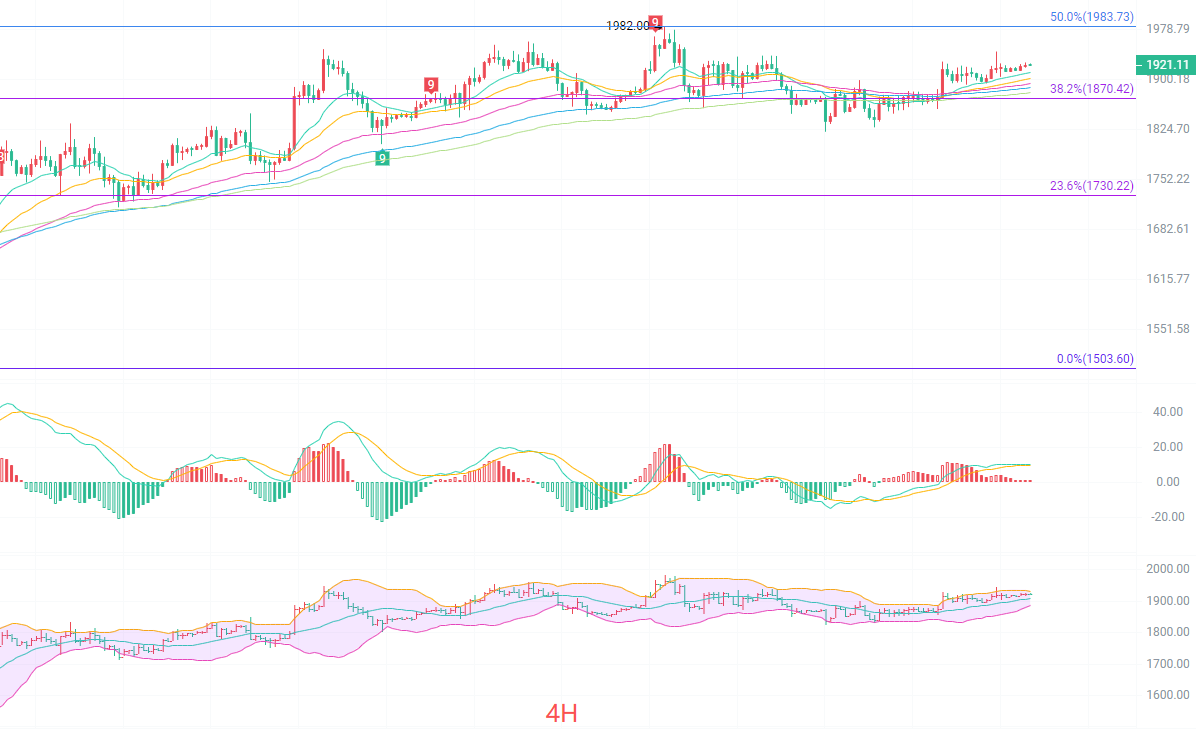
The four-hour K-line shows a narrow fluctuation upward pattern. The price is slowly rising supported by the EMA moving averages, and the Bollinger Bands continue to narrow, indicating that the short-term fluctuation space is being compressed. The MACD remains above the zero line, with the red bars shrinking slightly, indicating a decrease in bullish momentum. The 38.2% Fibonacci level at 1870 has become a strong short-term support, while the 50% level at 1983 forms resistance above. In the four-hour timeframe, the small trend is slightly bullish, but the upward momentum is weak, and multiple attempts to break above the resistance level have failed. It is highly likely that we will maintain a range-bound pullback in the short term; do not blindly chase highs before a significant breakout occurs, and it is advisable to consider a high sell low buy strategy.
Short-term reference:
If it does not break below 1870 to 1820, go long, with a stop-loss at 1790 and targets at 1900 to 1930.
If it does not break above 1980 to 2010, go short, with a stop-loss at 2050 and targets at 1860 to 1820.
Specific operations should be primarily based on real-time data from the market. For more detailed information, you can contact the author. Note that the publication of the article may be delayed, and it is advised for reference only, with risks borne by the individual.

Warm reminder: The above content is solely created by the author’s public account. The advertisements at the end of the article and in the comment section are not related to the author. Please exercise caution in distinguishing them. Thank you for reading.
免责声明:本文章仅代表作者个人观点,不代表本平台的立场和观点。本文章仅供信息分享,不构成对任何人的任何投资建议。用户与作者之间的任何争议,与本平台无关。如网页中刊载的文章或图片涉及侵权,请提供相关的权利证明和身份证明发送邮件到support@aicoin.com,本平台相关工作人员将会进行核查。