Cryptocurrency Expert: The sideways action of 8.9 Bitcoin (BTC) is definitely not a consolidation, understanding the direction signals brewing in the crypto market? Latest market analysis and trading strategy interpretation
Bitcoin is currently priced at 65,000, many crypto enthusiasts are wondering whether it will surge up or come down for another correction. Many fear getting stuck when chasing the highs, while others worry about catching the bottom halfway up; it's easy to get slapped back and forth during market fluctuations. Currently, the market hasn't provided a particularly clear direction, with large bullish and bearish candles being rare, and more often the price moving back and forth within a range. The most common mistake retail investors make is frequently opening positions in a choppy market
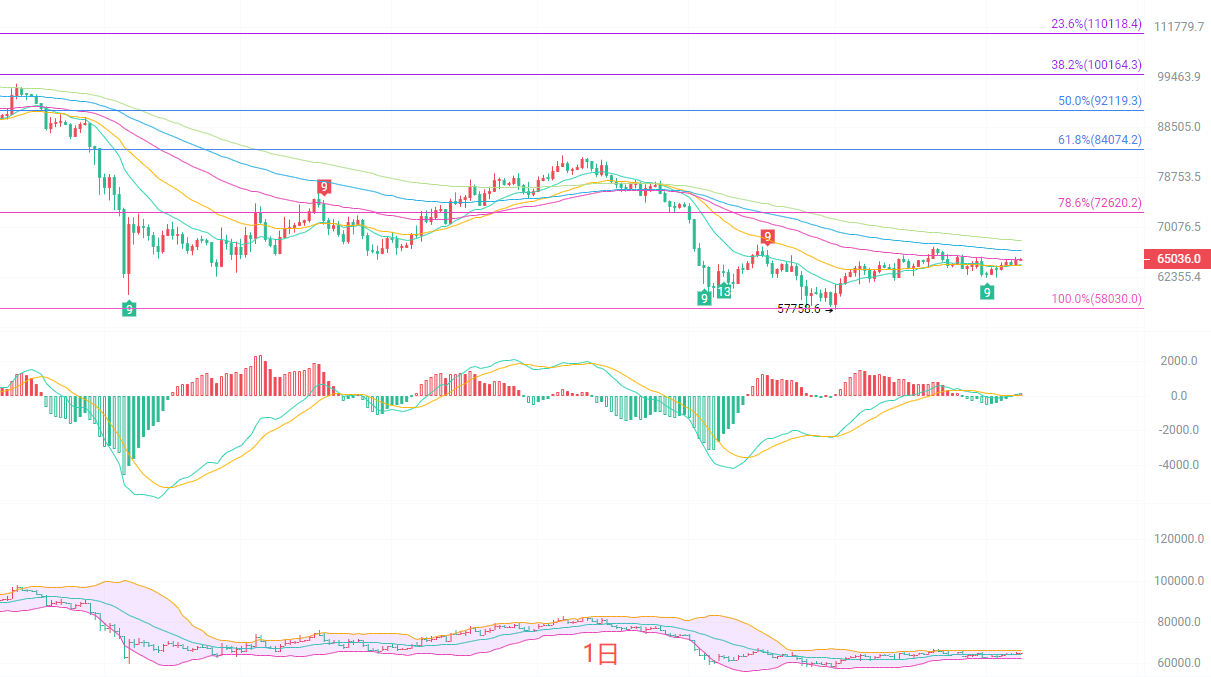
The daily K-line is currently running near multiple EMA moving averages, with EMA30 and EMA60 intertwined, indicating a balance of bullish and bearish forces. The Bollinger Bands are generally narrowing, with the upper and lower bands converging, suggesting a potential change in trend at the daily level. The MACD indicator's DIF and DEA are flattening above the zero axis, with weak red bars slightly increasing, lacking a strong bullish signal. The key resistance level above is at 67,500, which is also the Fibonacci 38.2% position, an important hurdle for the bulls to overcome; the strong support below lies in the 62,500 to 63,000 range, coinciding with the lower Bollinger Band and the previous oscillation platform. The daily chart has not yet formed a clear trend, remaining in a phase of consolidation following a bottom reversal, and until an effective break above resistance occurs, it is not advisable to blindly chase highs
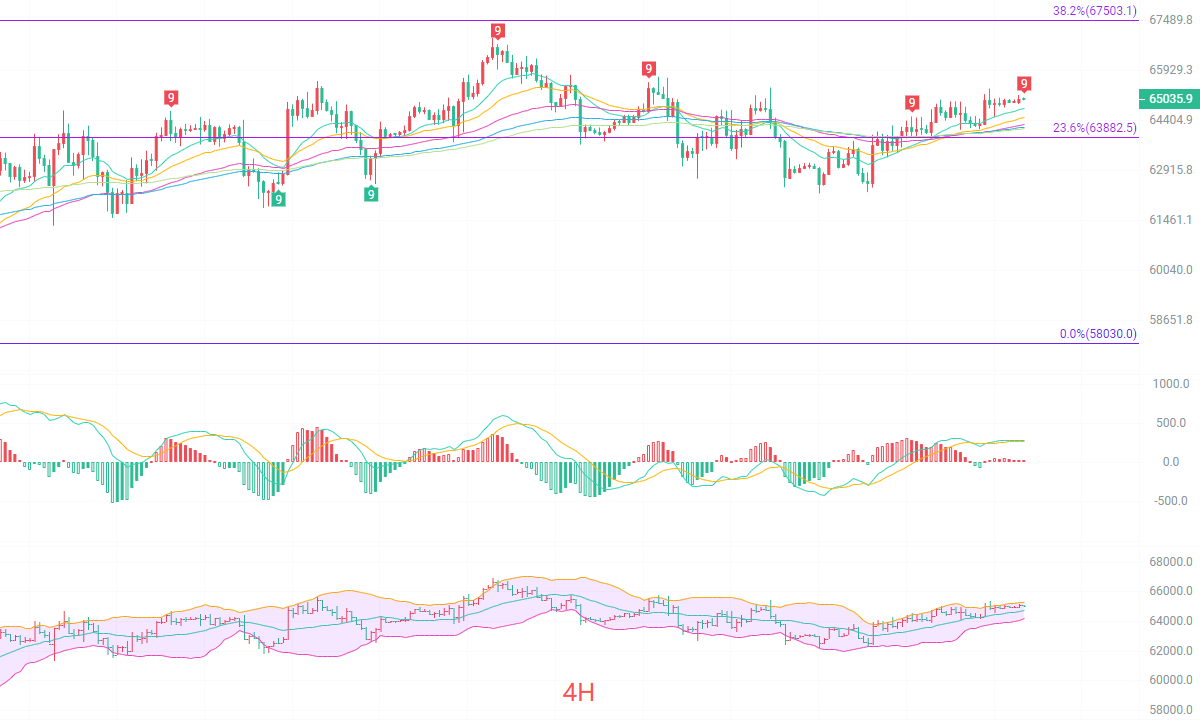
The four-hour K-line is oscillating within a range, with prices closely adhering to the EMA15 and EMA30 moving averages; short-term moving averages are coiling together, indicating intense short-term bullish and bearish competition. The Bollinger Band channel is moving horizontally, with prices repeatedly testing near the middle band; the upper band pressure is at 65,400, and the lower band support is at 64,100. The MACD indicator's dual lines are merging, with energy bars alternating between red and green, lacking sustained volume, and the short term is devoid of unilateral momentum. The TD indicator has frequently signaled a reversal at 9, but no effective breakout has formed, making the oscillation characteristic very obvious. The four-hour level is in a range-driven market, and false breakouts are easy; do not chase long positions on a single bullish candle or short on a bearish one; instead, wait for prices to approach the upper or lower bounds of the range to consider positioning, as operations in the middle position have poor risk-reward ratios
Short-term reference:
If the price does not break below 64,200 to 63,800, go long with a stop-loss at 63,400, targeting 65,500 to 66,500
If the price does not break above 67,000 to 67,500, go short with a stop-loss at 68,000, targeting 66,000 to 65,000
Specific operations should primarily rely on real-time market data; for more detailed information, feel free to consult the author. The article publication may have a delay; it is suggested for reference only, and risks are to be borne by the reader

Friendly reminder: The above content is solely created by the author of the public account; advertisements at the end of the article and in the comments section are unrelated to the author. Please discern carefully, thank you for reading
免责声明:本文章仅代表作者个人观点,不代表本平台的立场和观点。本文章仅供信息分享,不构成对任何人的任何投资建议。用户与作者之间的任何争议,与本平台无关。如网页中刊载的文章或图片涉及侵权,请提供相关的权利证明和身份证明发送邮件到support@aicoin.com,本平台相关工作人员将会进行核查。