Cryptocurrency Scholar: Ethereum (ETH) at 8.8 Repairs Underlying Currents, How to Identify Trend Change Signals Amidst Fluctuation? Latest Market Analysis Reference
Ethereum's current price is 1918, the market will never follow the script we imagined, and fluctuating markets are most likely to sweep stop losses back and forth. Do not subjectively assume that there will definitely be a big rise or a big fall; respect the signals from the market. Many people incur losses not because they cannot understand candlesticks, but because they cannot control their positions, holding on without stop losses. Trading is not about single profits and losses, but about long-term stable risk control. When you do not understand, choose to observe; being out of position is also a form of operation.
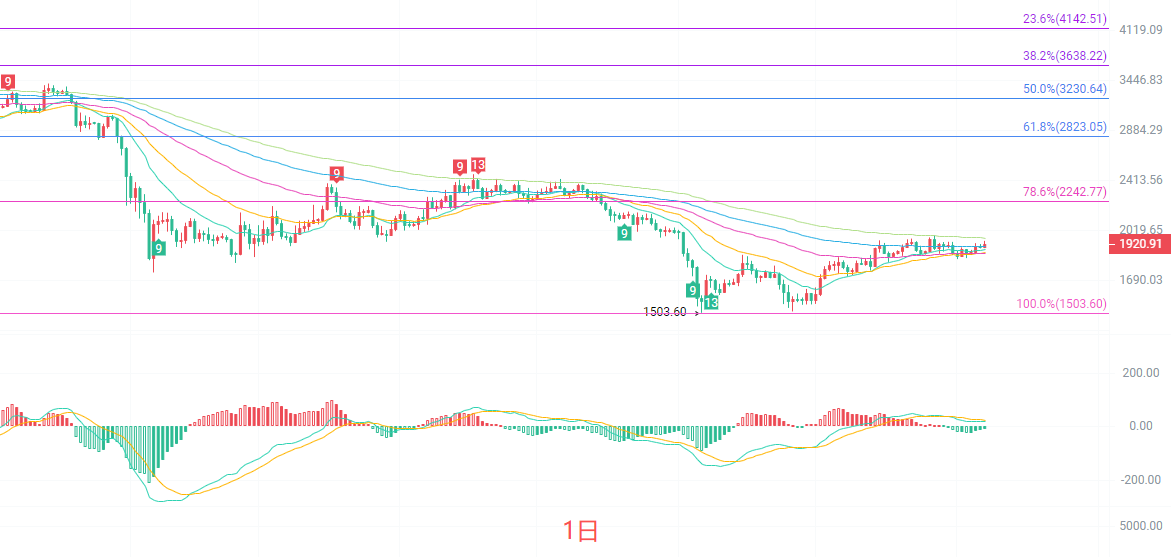
The daily candlestick is in a repair phase below the Fibonacci 78.6% position at 2247. It has temporarily stabilized above the EMA15 moving average, but the EMA30 and EMA60 moving averages above are forming obvious resistance, with strong pressure in the 1966-2000 range. The MACD indicator's DIF is still below the zero axis; the bearish long-term influence is still present, and the small increase in red bars has not formed a strong bullish breakout. The Bollinger Bands are narrowing, and the market is entering a low-volume fluctuation. The key support below is 1836, which is the position of the lower Bollinger Band; as long as this position is not effectively broken, the daily level rebound structure is not damaged. Once it fails to break the pressure above, it will test the support again.
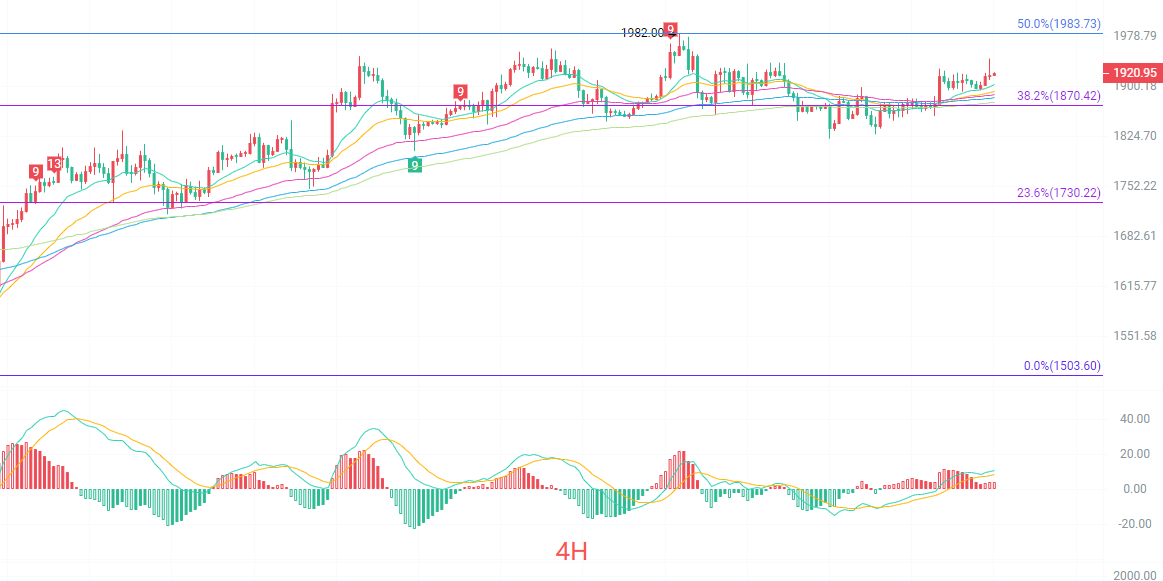
The four-hour candlestick is slowly rising along the short-term EMA moving averages. The current price is close to the Fibonacci 38.2% resistance level in the 1870-1940 range, with 50% strong pressure near 1983. The MACD remains above the zero axis, the red bars are slightly contracting, and bullish momentum is weakening, showing signs of entering a short-term correction. The Bollinger Bands channel is moving upward, with the lower support at 1857. The short-term market is characterized by oscillating upward, but the pace of the rise is gradually slowing down, and a pullback may occur anytime after a high. If the 4-hour does not directly break through the 1983 pressure with volume, it will be difficult to open further upward space, and it is highly likely to oscillate within a range.
Short-Term Reference:
If the lower range of 1870 to 1820 does not break, target upwards, stop loss at 1790, with the target at 1900 to 1930.
If the upper range of 1980 to 2010 does not break, target downwards, stop loss at 2050, with the target at 1860 to 1820.
Specific operations should be based on real-time market data. For more details, you can consult the author. The release of this article is delayed; it is suggested for reference only, with risks borne by the reader.

Friendly Reminder: The above content is only created by the author on the public account; the advertisements at the end of the article and in the comments section are unrelated to the author. Please discern carefully, and thank you for reading.
免责声明:本文章仅代表作者个人观点,不代表本平台的立场和观点。本文章仅供信息分享,不构成对任何人的任何投资建议。用户与作者之间的任何争议,与本平台无关。如网页中刊载的文章或图片涉及侵权,请提供相关的权利证明和身份证明发送邮件到support@aicoin.com,本平台相关工作人员将会进行核查。