Academician in the Cryptocurrency Circle: The 8.8 Bitcoin (BTC) moving average entanglement intensifies, decrypting the real intentions behind the market dynamics between bulls and bears? Latest market analysis and operational advice interpretation
The current price of Bitcoin is 64900. The market never lacks opportunities; what is most feared is running out of capital and missing out on opportunities to just watch. The bulls and bears are fiercely contending now, so don't subjectively determine a one-sided market. In trading, accept missing opportunities, but do not accept significant losses. During the consolidation phase, do less and observe more, strictly execute your trading plan, and don't let short-term price fluctuations disturb your mindset. The cryptocurrency market carries huge risks, always prioritize risk control; survive to wait for the trend that truly belongs to you.
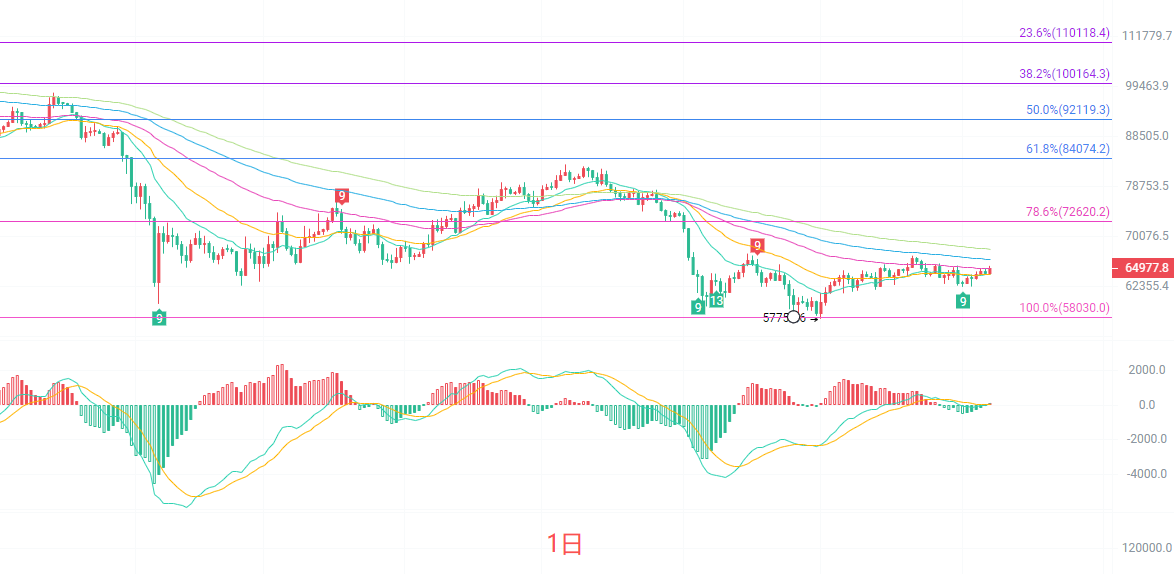
The daily candlestick chart is currently operating near the middle track of the Bollinger Bands, which are in a narrowing state, indicating that the market's consolidation pattern will continue. The moving average system EMA15 and EMA30 are entangled and flat; the forces of bulls and bears are in a balanced tug-of-war. The MACD indicator's DIF and DEA are glued together, and both the red and green histogram bars lack strength, showing no significant volume increase. Strong support below looks towards the previous low of 58030, while the first resistance above is at 72620. The daily level currently does not provide a clear trend direction, belonging to the consolidation phase after a bottom rebound. Only if it stabilizes above the resistance can the bullish trend be restarted; once the key support is broken, it will return to a deep correction zone. On the daily level, it is not suitable to heavily chase peaks or bottom out; wait for direction selection to land.
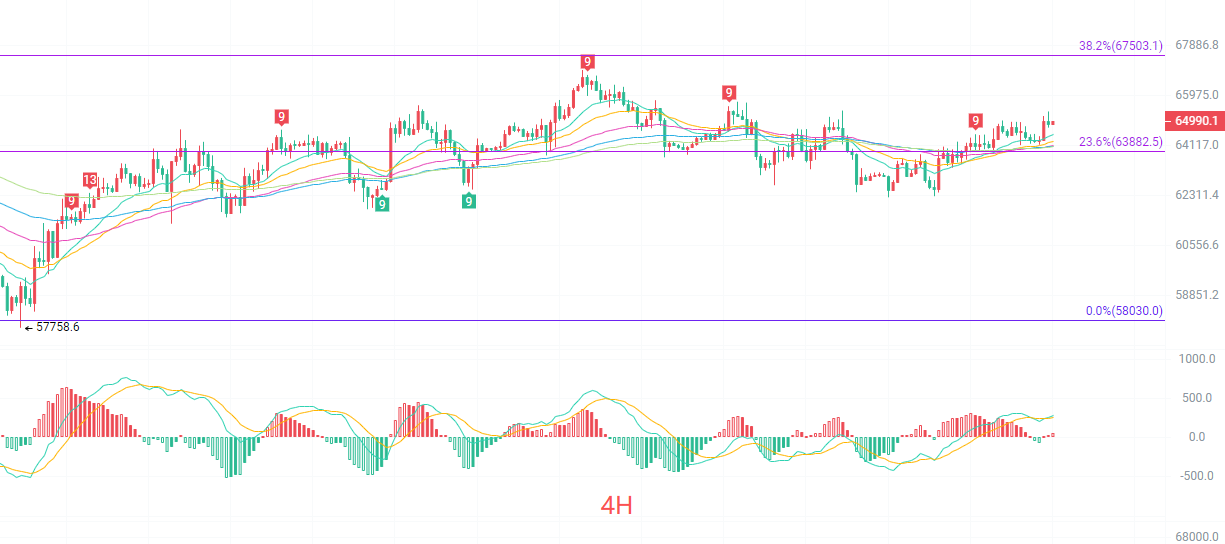
The four-hour candlestick chart is running above multiple EMA moving averages, with the short-term moving averages forming support. The Fibonacci 23.6% position at 63882 is currently an important support, while the 38.2% pressure point is at 67503. The Bollinger Bands show a slight opening, with prices running close to the upper edge of the Bollinger Bands. The MACD red bars have slightly continued, but the strength of the red bars has not continued to amplify, indicating a decrease in upward momentum. The market has repeatedly tested the upper pressure before falling back, and is consistently testing the lower moving average support. The four-hour level is in a slightly bullish consolidation; bulls have a slight temporary advantage, but the upper pressure is heavy. An upward breakthrough requires volume support; without an effective breakout, beware of a pullback that could flush positions.
Short-term reference:
If it doesn't break below 64200 to 63800, target upwards, with a stop-loss at 63400, aiming for 65500 to 66500.
If it doesn't break above 67000 to 67500, target downwards, with a stop-loss at 68000, aiming for 66000 to 65000.
Specific operations should be based on real-time market data; for more information, you can consult the author. The article is published with a delay and is intended for reference only; the risk is borne by yourself.

Friendly reminder: The above content is solely created by the WeChat public account of the author. The advertisements at the end of the article and in the comments section have nothing to do with the author; please discern carefully. Thank you for reading.
免责声明:本文章仅代表作者个人观点,不代表本平台的立场和观点。本文章仅供信息分享,不构成对任何人的任何投资建议。用户与作者之间的任何争议,与本平台无关。如网页中刊载的文章或图片涉及侵权,请提供相关的权利证明和身份证明发送邮件到support@aicoin.com,本平台相关工作人员将会进行核查。