Good morning, teammates. There are two major events to discuss before the market opens today. The first is that NVIDIA's Rubin Ultra chip has downgraded its HBM configuration, causing a shortage of high-end AI chips which has forced manufacturers to compromise. This has directly impacted the sentiment in tech stocks, leading to a sharp decline in the U.S. stock market's storage sector overnight, with AI software stocks also experiencing collective plummets. The second event is that the probability of a 25 basis point rate hike by the Federal Reserve in September has risen to 56.5%, with inflation data hanging like a sword over us. The combination of these two events is putting real pressure on BTC. On the other hand, the Japanese and South Korean stock markets opened higher today, with the Korean KOSPI rising nearly 1%, led by Samsung, indicating a slight recovery in global risk assets. With mixed messages in the market, BTC currently feels like it is stuck in a crack between a door, facing difficult choices both ways.
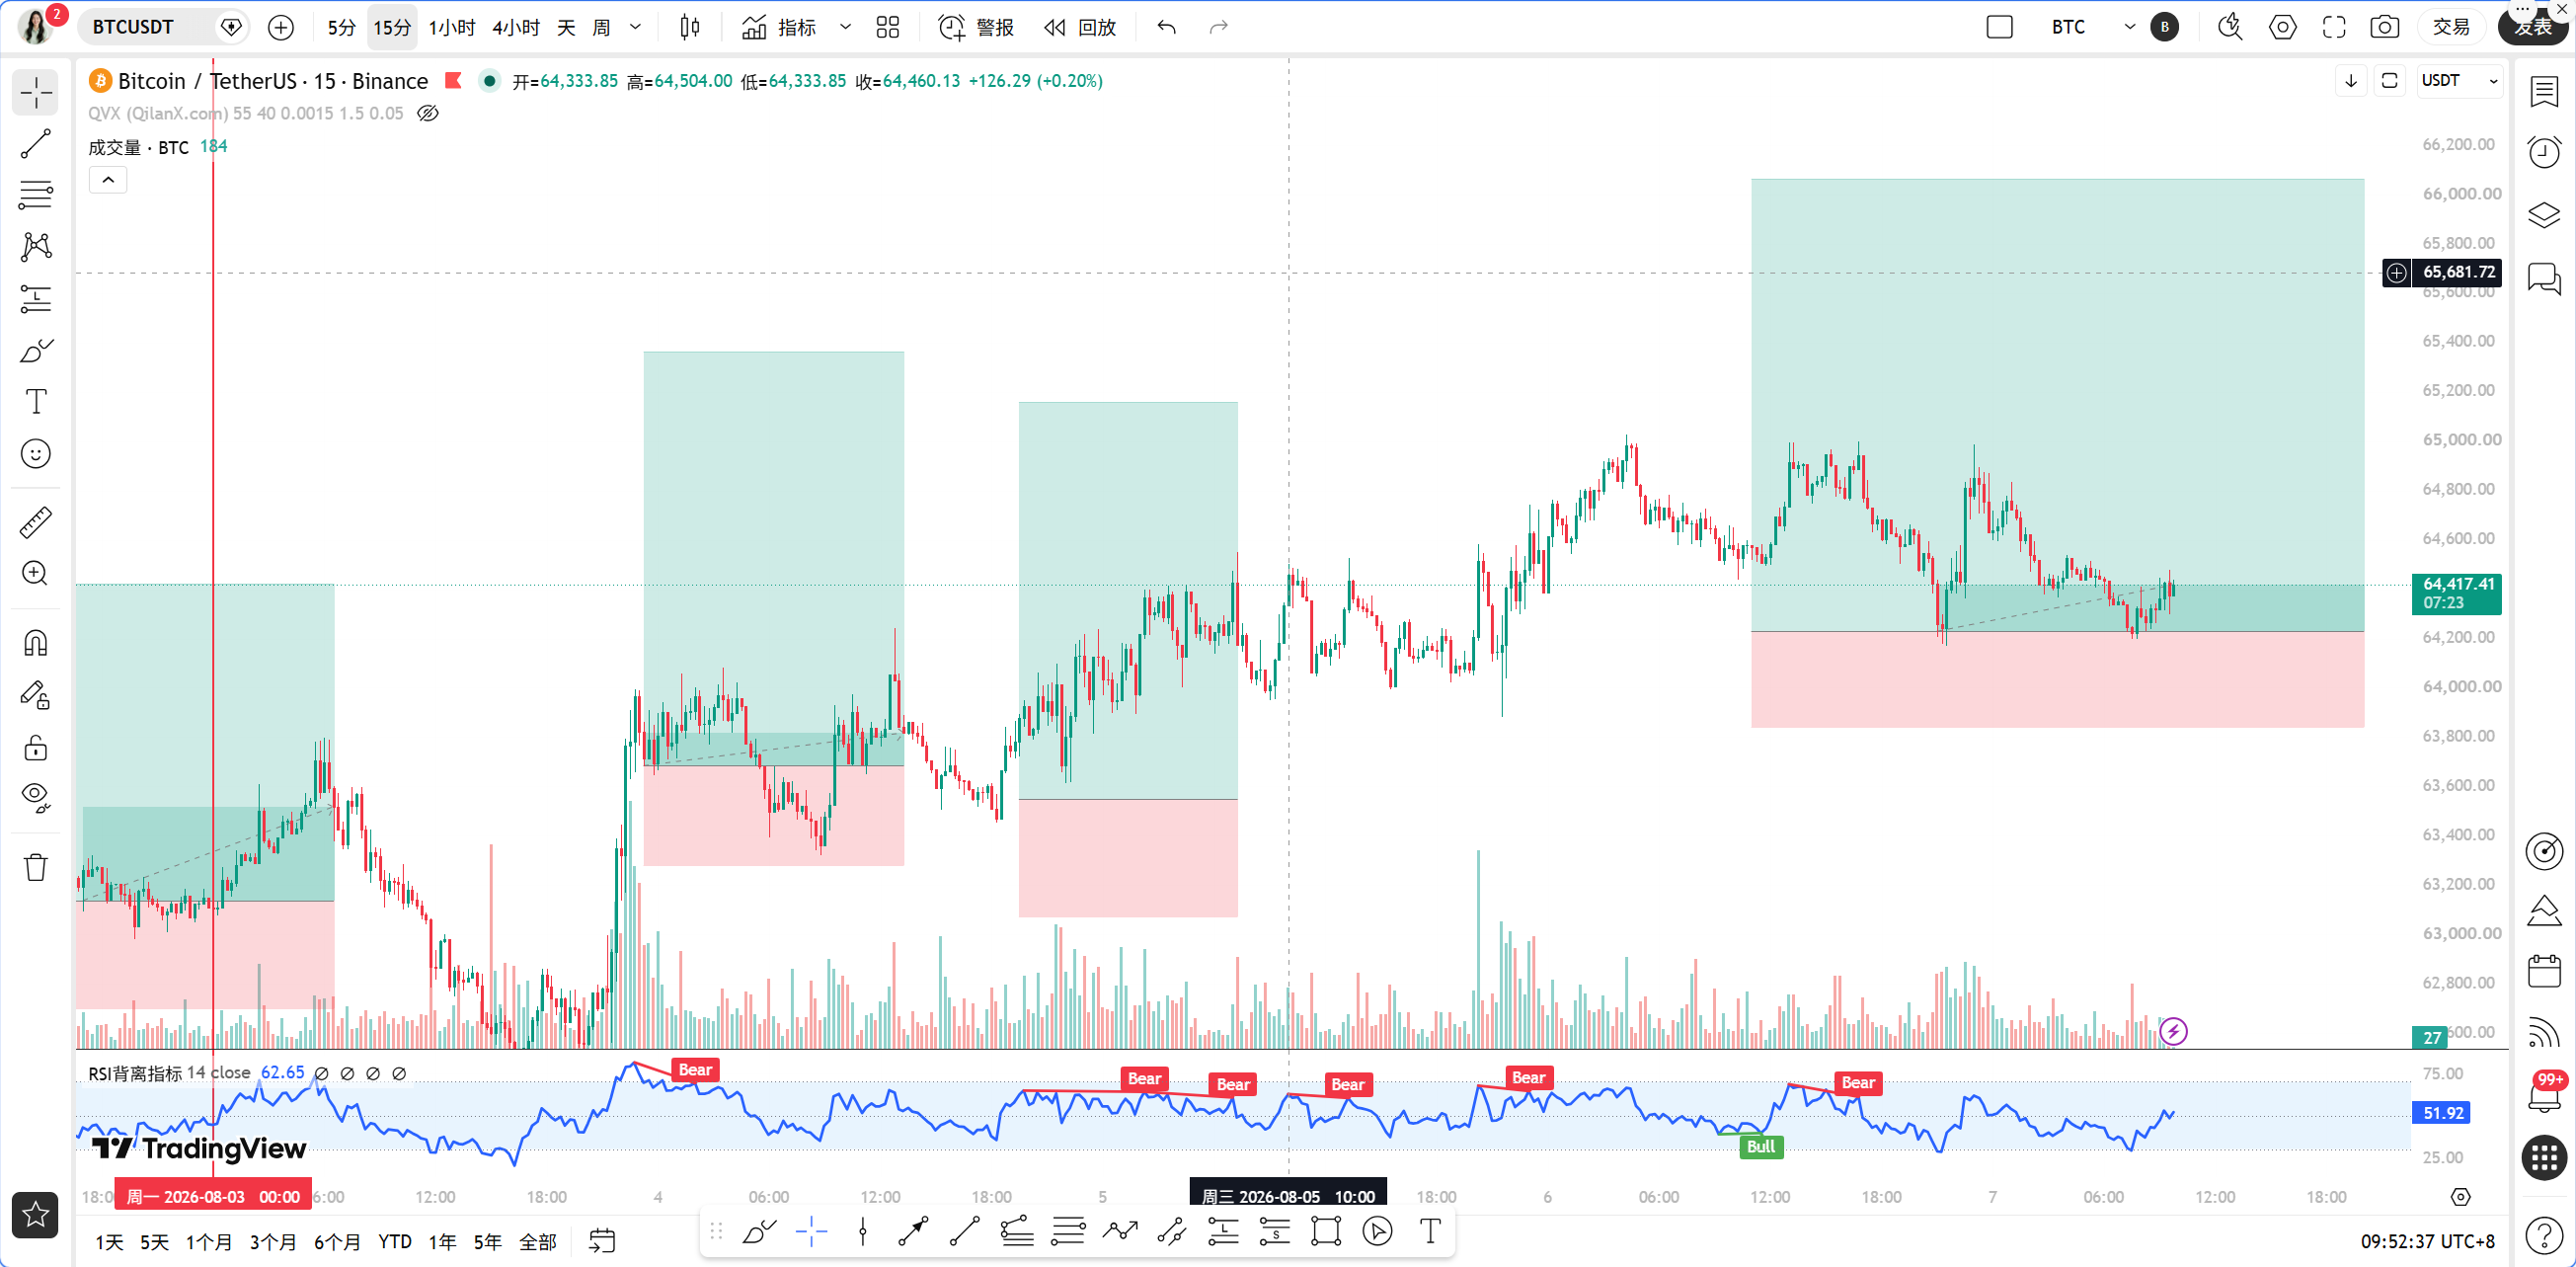
The current time is August 7th, 09:54, with BTC priced at 64404 USDT, a 24-hour decline of 0.35%. This position is quite interesting, as it is just around the 1-hour EMA55, with an absolute distance from the moving average of only 0.04%, almost touching the line. My first impression from the chart is that the market is waiting for a direction, and no one is willing to take the first step.
Let's first look at the multi-timeframe status. On the daily chart, the MACD is still in a golden cross state, with a histogram at 1.56, and the RSI at 51.6. Both MA5 and MA10 are forming support below the price, without damaging the daily structure, so the bulls still have some breath left. The 4-hour chart presents a bit more nuance, as the MACD has just formed a dead cross, with a histogram at -14.36. Although the RSI remains at 53.8, which isn't weak, the momentum is obviously declining. The 1-hour level is more direct, with a MACD histogram at -38.12, DIF at -53.74, DEA at -15.62, indicating bearish dominance, and the RSI falling to 42.27, with the price operating below the MA5 and MA10. The 15-minute level shows some signs of rebound, with the MACD histogram turning positive at 18.79 and the RSI returning to 53.69, but this is just a short-term correction and does not change the overall situation.
Let's verify using the Qinglan TPV system. The core rule is that the 1-hour EMA55 serves as the boundary between bullish and bearish trends, with the current EMA55 at 64430.35, and the current price at 64404, just slightly below the moving average. According to the rules, if the price is below EMA55, it belongs to a bearish trend area. However, there is an issue: in the past 8 one-hour candlesticks, the closing price was above EMA55 3 times, with 2 crossings, while the price's distance from EMA55 is only 0.04%, less than the 0.3% threshold. This fully meets the conditions for a consolidation judgment, and the system clearly suggests not to take long or short positions actively, only to provide a range. Looking at the shape, there have been no two consecutive K-line closing prices above EMA55 on the 1-hour level, nor any long lower shadows or bottom formations as supportive stabilization signals. Although the MACD histogram's negative value is narrowing, there has not yet been a confirmation of exhaustion from two consecutive periods of shrinkage. Therefore, now is not the time to enter the market, but a time to wait.
In terms of on-chain data, the Fear and Greed Index is at 29, placing market sentiment in the fear range. This position often indicates a bottom area but does not rule out further declines. BTC's market share stands at 56.6%, indicating that funds are still avoiding risk by staying in BTC, leading to a withdrawal of liquidity from altcoins. The example of ETH falling below $1900 illustrates this. Grayscale's XRP Trust ETF sold off $180 million in the first half of the year, with holdings halving, which has further impacted market sentiment. However, there is good news as Wintermute has obtained a U.S. broker-dealer license, Wells Fargo will launch tokenized deposits in the fall, and Tether is entering the Saudi RWA market, with these long-term benefits gradually accumulating. In the short term, on-chain data leans bearish, but the long-term logic of institutional entry remains intact.
It's crucial to clarify key support and resistance levels. The first resistance level is around the 1-hour EMA55, between 64430 and 64500. If the price can regain this level and close two consecutive K-lines above it, then the bulls will have a chance to regain control. Next is the dense zone of the 4-hour MA5 and MA10, around 64600 to 64650, which is the second line of pressure. The first support on the downside is at the psychological level of 64000, which is also where the daily MA5 is located. If it breaks below this, watch the 63600 to 63700 area, which is the support band of the 4-hour MA30. Further down is the strong support at 63000. The current price is at 64404, not far from these critical levels, but precisely because it is not far, it is more susceptible to fake breakouts.
In terms of trading strategy, I want to make it clear that now is not the time to chase trades. The most taboo in a volatile market is getting slapped in the face repeatedly. If you want to take action, you must wait for a signal. For a long position, wait for the price to regain the 1-hour EMA55, above 64430, and close two consecutive one-hour K-lines firmly above it, while showing long lower shadows or bottom formations as support. The MACD histogram must confirm exhaustion through two consecutive periods of shrinkage. At this point, you can take a small long position with an entry range between 64500 and 64600, setting the stop loss below 64000 and targeting 65200 to 65500. For a short position, wait for the price to rebound to the 64600 to 64700 resistance area, where a long upper shadow or top formation appears, the MACD histogram must show two consecutive periods of shrinkage, and the RSI must fall back from a high position. At this time, you can enter short, placing the stop loss above 65000, with a target of 63500 to 63700. If the price keeps fluctuating within the narrow range of 64300 to 64500, then stay out of the market and wait for the market to choose a direction itself.
The risk warning is simply this: false breakouts frequently occur in volatile markets, and strict stop-loss measures are the baseline for survival. Don't let a single loss exceed two percent of your principal.
Follow the Qinglan Crypto Classroom to seize more trading opportunities together! Welcome to visit the official website www.qinglan.org
📊 Qinglan TPV Trading Strategy Backtest Reference
🕒 Last Backtest Time 08-07 07:00:01
Total Analysis: 3424 Backtests: 3419 Accuracy: 81.7% (2792/3419)
免责声明:本文章仅代表作者个人观点,不代表本平台的立场和观点。本文章仅供信息分享,不构成对任何人的任何投资建议。用户与作者之间的任何争议,与本平台无关。如网页中刊载的文章或图片涉及侵权,请提供相关的权利证明和身份证明发送邮件到support@aicoin.com,本平台相关工作人员将会进行核查。