ETH current price is 1915, the price rebounds and rises, touching the area below the upper Bollinger Band, after several consecutive bullish candlesticks, a small real body candlestick appears, and the upward momentum begins to slow down.
Market structure interpretation
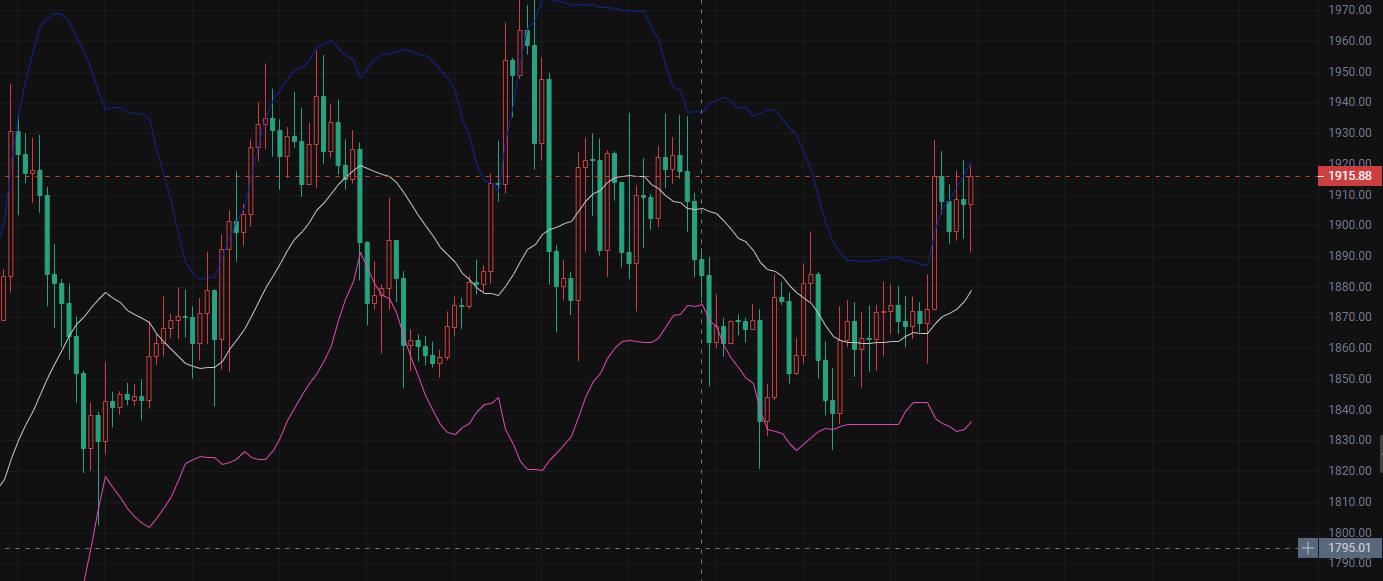
1. This round of market trend belongs to a wide range oscillation, the price has previously rebounded from the lower Bollinger Band several times for support, and after touching the upper Bollinger Band, it fell back under pressure. This is a very typical oscillation market switching back and forth between the Bollinger Band tracks, and has not shown a unilateral trend.
2. This wave started with a rebound from the lower track, with consecutive upward candlesticks that pulled from the lower Bollinger Band area to near the upper track; currently, the price has not effectively broken through and stabilized above the upper Bollinger Band, a stagnation signal appears, and there is obvious pressure from the upper track.
3. The middle track of the Bollinger Band is the fulcrum of the market's bull-bear divide for this cycle. During the previous decline, the price tested the middle track multiple times. For the rebound to continue, it must not effectively break below the middle track; once a real body candlestick breaks below the middle track, the market will test the support of the lower Bollinger Band again.
✅ Upper pressure: Bollinger Band upper track 1930‑1945 area
If the price reaches this range, referencing historical trends, it is very easy to see a high pressure retreat, falling back, which belongs to the high pressure zone within the oscillation market. Only if a large bullish candlestick entity directly breaks through and closes above the upper track will it break the oscillating pattern and initiate an upward trend.
✅ Bull-bear divide: Bollinger middle track 1880‑1890 area
This is the core attack and defense position of the oscillation box. If the price stabilizes above the middle track, it belongs to a relatively strong oscillation in the short term; if the real body candlestick breaks below the middle track, the market will directly turn weak, and the trend will search for the lower track support.
✅ Strong support below: Bollinger lower track 1830‑1845 range
This is the bottom support band of this round of oscillation. In the previous rounds of decline, the price reaching the lower track position has always halted the decline and initiated a rebound; if it drops to this range, there will be an opportunity for rebound repair; if the real body candlestick effectively breaks below the lower track, the oscillation pattern will be destroyed, opening up a deeper downtrend.
Bearish mindset:
As the price rebounds to the Bollinger upper track 1930‑1945 pressure zone, short positions can be arranged; the first target looks towards the Bollinger middle track 1880‑1860. If the middle track is broken by a real body, continue to look down to the Bollinger lower track 1830 support area.
Bullish mindset:
During the pullback phase, if the price falls back to near the Bollinger middle track, and the candlestick forms a bullish reversal while holding the middle track without breaking, long positions can be entered, targeting the Bollinger upper track pressure 1930‑1945; if the market directly pulls back to the Bollinger lower track 1830‑1845 and a bottom stabilizing candlestick appears, it presents a higher cost-effective long opportunity within the oscillation market, with the first rebound target looking towards the middle track position.
BTC market analysis
Market structure interpretation
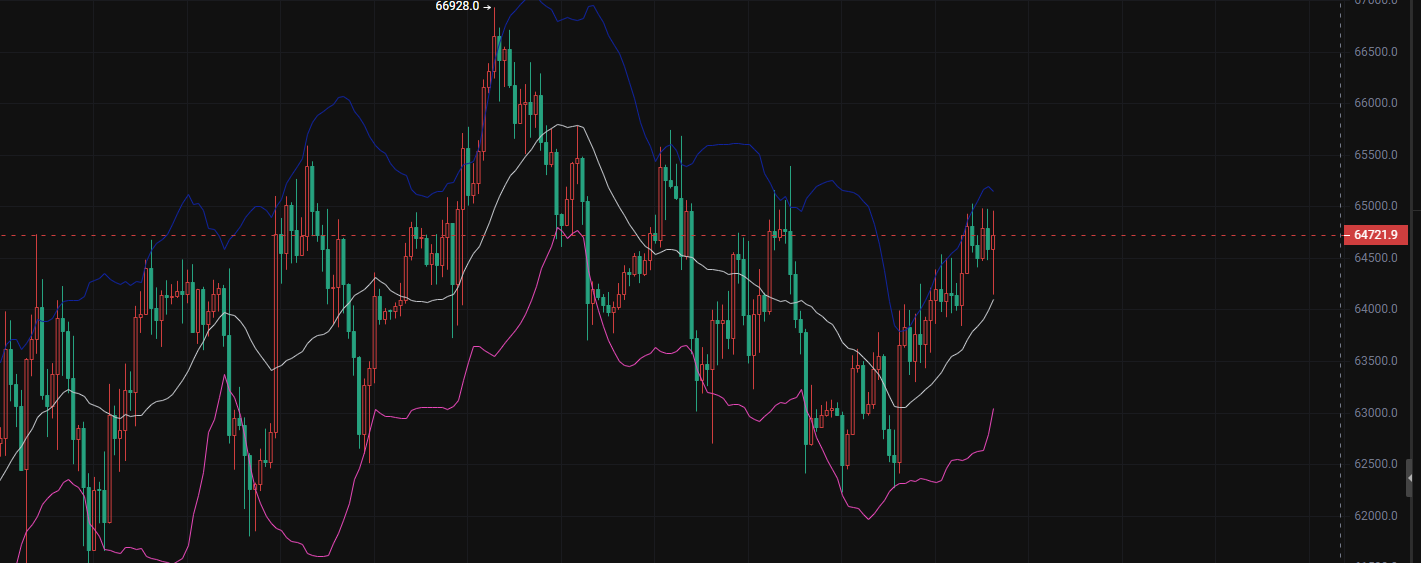
1. After the previous high reached the Bollinger upper track 66928, a large real body candlestick fell back, and the price quickly retreated from the upper track position, completing a round of track pressure pullback. The market then began a low oscillation forming a bottom, with the price relying on the lower Bollinger Band support several times to create a rebound, belonging to a standard wide box oscillation, without establishing a unilateral trend.
2. Recently, a rebound started from the lower Bollinger Band, with consecutive bullish candlesticks moving upward, pulling the price back close to the upper Bollinger Band, **but it did not effectively break and stabilize above the upper track** and immediately appeared a stagnation candlestick retreat, indicating that bullish upward momentum is weakening and again subject to the upper track's pressure.
3. The middle track of the Bollinger Band is the core bull-bear divide of the oscillation pattern for this cycle: during the rebound process, the price consistently operated above the middle track, indicating a stronger short-term market; once a large real body candlestick breaks down through the Bollinger middle track, the short-term strong pattern will end, and the market will test the lower Bollinger Band support again.
✅ Upper pressure: Bollinger upper track 65300‑65800 area
Referring to previous historical trends, when the price reaches the upper track zone, it is very likely to see pressure at highs and long upper shadows, leading to inverted forms, which is the main pressure area of the oscillation market; only if a large bullish candlestick entity closes and stabilizes above the Bollinger upper track can it break the box and open further upward space.
✅ Bull-bear divide: Bollinger middle track 63600‑64000 area
This is the strong-weak boundary of the oscillation box. If the price remains above the middle track, it signifies a relatively strong oscillation in the short term; however, if a real body candlestick breaks below the middle track, the market will directly turn weak, and the market will test the lower Bollinger Band support.
✅ Strong support below: Bollinger lower track 62000‑62600 range
This is the bottom support region of this major oscillation. In earlier rounds of decline, when the price fell to the lower track position, it would often halt its fall and start a new round of rebounds; if the price retreats to this range and a stabilizing candlestick forms, there will be an opportunity for repair; if a large bearish candlestick directly breaks the lower track, the box oscillation structure will fail, leading to a more considerable downward movement.
Bearish mindset:
If the price rebounds and rises to the Bollinger upper track pressure band of 65000‑65800, short positions can be arranged; the first target looks towards the Bollinger middle track 63600‑64000; if the middle track is broken by a real body, further look down to the Bollinger lower track 62000‑62600 support.
Bullish mindset:
In the pullback phase, if the price falls back to near the Bollinger middle track and forms a stabilizing candlestick without breaking the middle track, long positions can be entered, targeting the Bollinger upper track 65300‑65800;
If the market deeply retraces to the Bollinger lower track 62000‑62600 area and a bottom stabilizing candlestick appears, it presents a higher cost-effective long opportunity within the oscillation market, with the first rebound target looking towards the middle track position.
Public account - Bit Bear X
(Note: 📣 Due to the timeliness and depth limitations of information on public platforms, the market changes rapidly, key turning points, precise operation strategies, sudden risk alerts, and other content need to be synchronized on the public account in real time. Here you can obtain: Real-time strategy updates, deep analytical support, interactive Q&A, and risk warnings and optimization suggestions for personal holdings. 🚨 Remember: The market always rewards those who act faster and have more accurate information! Be a winner among the minority.)

免责声明:本文章仅代表作者个人观点,不代表本平台的立场和观点。本文章仅供信息分享,不构成对任何人的任何投资建议。用户与作者之间的任何争议,与本平台无关。如网页中刊载的文章或图片涉及侵权,请提供相关的权利证明和身份证明发送邮件到support@aicoin.com,本平台相关工作人员将会进行核查。