BTC Market Analysis
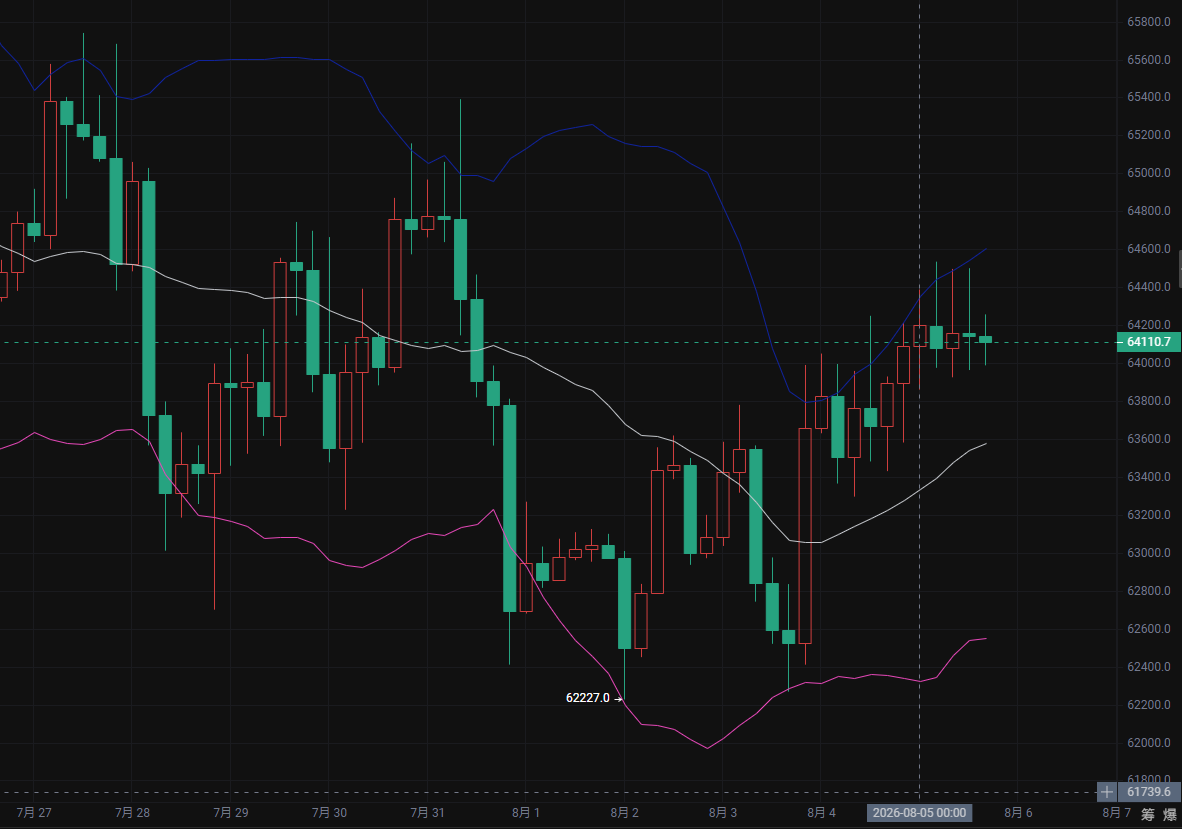
After a previous market bottom hitting a low of 62200, a rapid bullish candle emerged, with prices bouncing directly from the lower Bollinger band, gradually rising above the middle band.
Currently, prices are running between the **middle and upper Bollinger bands**, with the upper band extending upwards and the middle band rising synchronously, indicating that the medium-term rebound structure is still in place. However, recent candlesticks have not continuously surged upwards, showing multiple doji and small body candlesticks, failing to sustain new highs after touching the upper Bollinger band, and instead retreating, which is part of the consolidation during an uptrend.
During the rebound, prices have repeatedly tested the middle Bollinger band and found support, forming candlesticks that indicate a stop in the downtrend; the middle Bollinger band is currently an important defensive line for bulls;
Recently hitting the upper Bollinger band, the candle closed as a bearish line under pressure, indicating significant selling pressure at the upper band, with bullish momentum waning and failing to form a strong one-sided breakout, representing a typical range-bound market in the Bollinger band: it’s easy to bounce off the lower band, but hard to sustain above the upper band.
✅ Resistance above: Bollinger upper band at 64000-64500 region. If the price reaches this area again, based on previous candlestick performances, it will likely be under pressure again, leading to a pullback;
✅ Break-even point for bulls and bears: Bollinger middle band at 63000-63200, which is the core dynamic support of this round of rebound. As long as the candlestick stays above the middle band, the current rebound structure will not be broken; if the entity candlestick effectively drops below the middle band, the market will weaken again, seeking support at the lower Bollinger band;
✅ Strong support below: The lower Bollinger band at 62200, which corresponds to the starting support position of this rebound wave. If the market sufficiently retraces and drops to the lower band position, it is likely to see a stopping and rebounding candlestick.
Operation Suggestions
Bearish thoughts: Resistance area at 64000-64500, supplementary area at 65000-65400 (the turning point after the last high), defense at 65800 (after stabilization above the previous high point, bears abandon), target: 63000-62000 (middle to lower Bollinger band area)
Bullish thoughts: Lower band area at 62200-61800, supplementary area at 60800-61200 (the critical dividing line at the bottom of this rebound), defense at 60300.
ETH Market Analysis
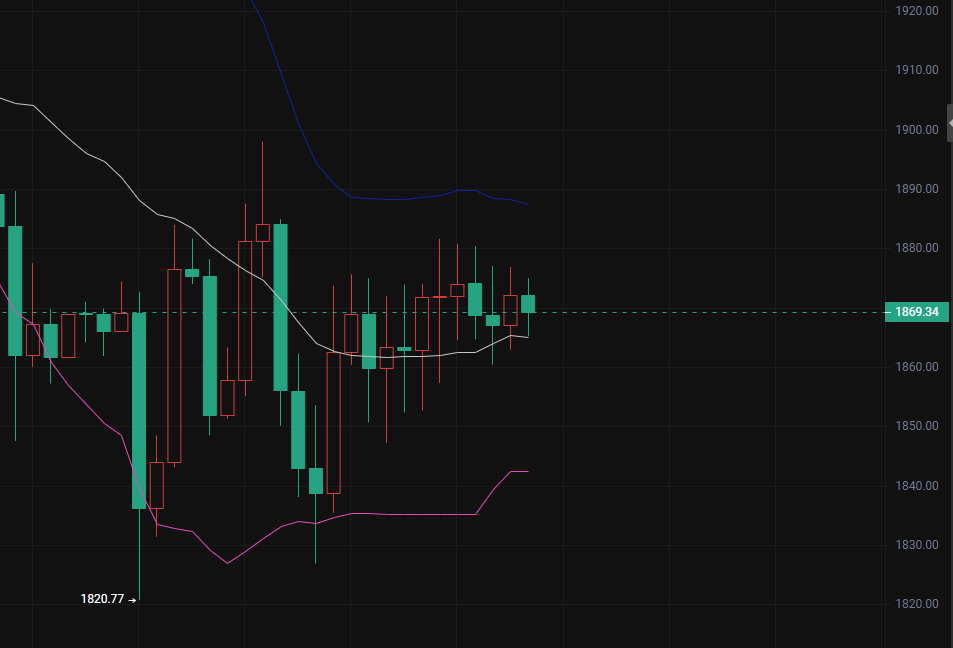
Prices rebounded upwards from the lower Bollinger band low of 1820, gradually approaching the middle Bollinger band, with current prices running just above the middle band.
The upper Bollinger band has flattened slightly downwards, the middle band has transitioned from a downward slope to a flattening upward shift, and the lower band is turning upwards, indicating that the three bands are converging, which is a typical signal of range-bound action. The K line has continuously formed small body candles alternating between bullish and bearish, with no large bullish candle breaking above the upper band, nor a large bearish candle breaking below the lower band, reflecting a balance in the struggle between bulls and bears.
After the drop ended, the K line stopped making new lows, and the lows gradually increased. Each time it tests near the lower Bollinger band, a stopping candle appears, initiating a rebound; however, upon touching the upper Bollinger band, it faces selling pressure and retreats, repeatedly moving back and forth within the range.
The current price is stuck at the middle band position, which has become the short-term boundary between bulls and bears: if the K line stabilizes above the middle band, it indicates a stronger bullish consolidation; once the entity K line breaks below the middle band, the market will weaken again and test the lower Bollinger band support. Recent K line bodies are relatively small, indicating that neither bulls nor bears currently have enough momentum to break out of the range.
Resistance above: Bollinger upper band at around 1880. If the price rebounds to the upper band area, based on previous K line historical performance, it’s likely to face pressure and fall, representing an important bear contention position within the range.
✅ Break-even point for bulls and bears: Bollinger middle band at 1850-60. The current price is near the middle band. Stabilizing above the middle band maintains a stronger consolidation pattern; while an effective break below the middle band indicates a shift from strong to weak.
✅ Strong support below: Bollinger lower band at 1820-40, which is the starting support of this round's bottoming. If the market deeply retraces to this position, it's likely to see a stopping K line, leading to a rebound for recovery.
Operation suggestions:
Bearish thoughts: Short at 1870-80 area, supplementary near 1900 (a key pressure point after the previous high pressure and retreat), defense at 1910, target 1820-40
Bullish thoughts: Near 1810 (the critical support point of this round's bottom, breaking down opens up downward space), supplementary at 1780 (to prevent a fast rebound after a quick drop), defense at 1765
(Note: 📣 Due to the timeliness and depth limitations of information on open platforms, the market is constantly changing. Key turning points, precise operational strategies, and sudden risk warnings need to be synchronized on our public account in real-time. Here, you can receive: real-time strategy pushes, in-depth analytical support, interactive Q&A, personal holdings risk warnings and optimization suggestions. 🚨 Remember: the market always rewards those who act faster and more accurately! Be a winner in the minority.)

免责声明:本文章仅代表作者个人观点,不代表本平台的立场和观点。本文章仅供信息分享,不构成对任何人的任何投资建议。用户与作者之间的任何争议,与本平台无关。如网页中刊载的文章或图片涉及侵权,请提供相关的权利证明和身份证明发送邮件到support@aicoin.com,本平台相关工作人员将会进行核查。