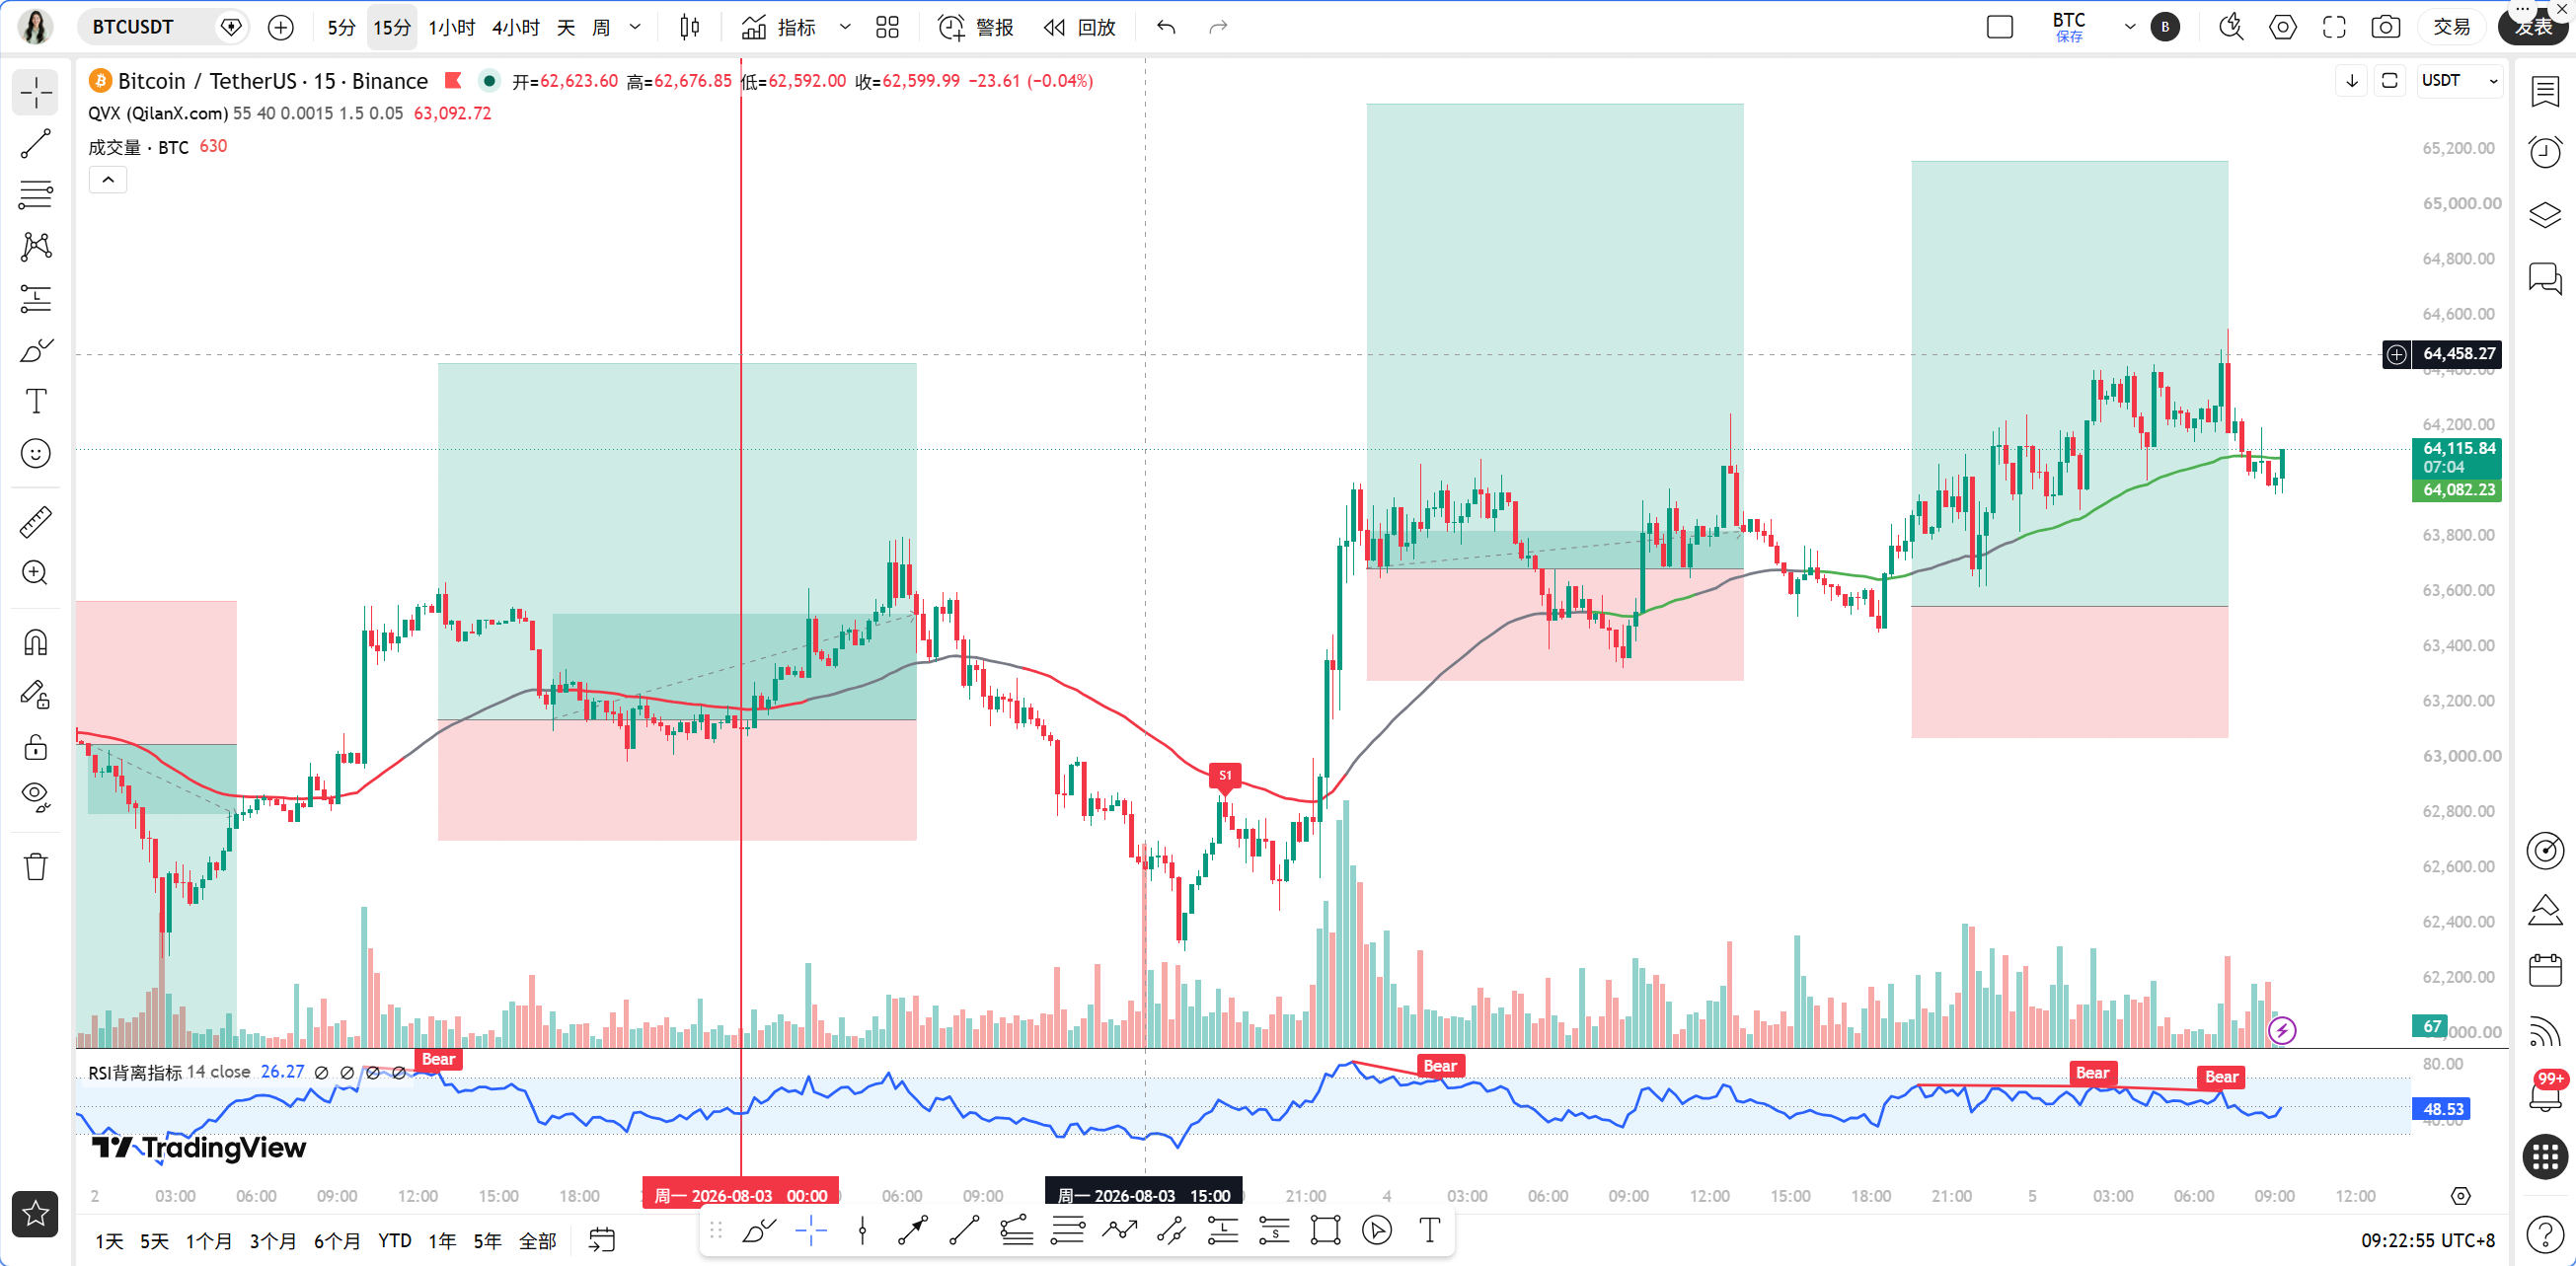
Good morning, teammates. The market situation today is exceptionally good based on news. The US-Iran negotiations have released positive signals, and the agreement for the Strait of Hormuz is expected to be reached, causing oil prices to plummet, which instantly revitalized global risk appetite. Meanwhile, over in the US stock market, both the Dow and S&P have set historical highs, with SpaceX and SK Hynix rising joyfully. These two major positive news items have injected a strong dose of confidence into Bitcoin, currently stabilizing above sixty-four thousand. But I want to remind everyone not to just focus on the good news; the probability of a rate hike by the Federal Reserve in September has soared to fifty-six point nine percent, which could bring a cold splash of water at any time. In today's article, Sister Qinglan will use the Qinglan TPV system to dissect the current market situation clearly.
First, let's look at the current state. It is now August 5th, 9:22 AM, with Bitcoin reported at sixty-four thousand one hundred seven dollars, a near one percent increase over the last twenty-four hours. This position is quite interesting, exactly situated above the psychological mark of sixty-four thousand, with both bulls and bears grappling here. From the fear and greed index, it is currently at twenty-seven, indicating a fear zone and suggesting that although market sentiment has somewhat improved due to the good news, overall it remains cautious, without the FOMO-style frenzy. This divergence between emotional and technical indicators often implies that the market could see fluctuations.
Next, let's go through the multi-period status using the Qinglan TPV system. At the daily level, both MACD's DIF and DEA are below the zero axis, the histogram is negative but the green bars are shortening, and the RSI is thirty-nine point fourteen, indicating a weak rebound pattern. The MA5 and MA10 have flattened and converged, and the price is above these two short-term moving averages, but the MA30 at sixty-four thousand one hundred forty-nine point six is acting as resistance, meaning that the daily level is still struggling below the medium-term moving average, only qualifying as an oversold rebound. The four-hour level is clearly stronger, with MACD histogram positive at one hundred twenty-eight point zero five, the DIF above the DEA, and an RSI of fifty-eight point forty-five, providing ample bullish momentum. The price is firmly above the MA5, MA10, and MA30, indicating a short-term upward trend. At the one-hour level, the MACD histogram is negative at eighteen point twenty-nine, and the DIF shows signs of flattening after crossing below the DEA, with an RSI of fifty-four point forty-six, which is a normal pullback during an upward trend. At the fifteen-minute level, MACD is still below the zero axis, with an RSI of forty-five point seventy-four, indicating short-term consolidation needs. To summarize, the longer-term daily level is slightly weak but showing signs of a stop-loss, the four-hour level is the strongest, while the one-hour and fifteen-minute levels are digesting short-term profits.
Now we enter the core section, using the Qinglan TPV system to validate signals. First, look at trend positioning: the current price is sixty-four thousand one hundred seven, with the one-hour EMA55 at sixty-three thousand six hundred seventy-five point four eight, placing the price above the moving average. Next, check the oscillation supporting data: all of the last eight one-hour closing prices are above EMA55, with zero crossover instances, and the price's deviation from the moving average is point six eight percent. This data is crucial, indicating that the current market does not conform to oscillation characteristics and is in a standard upward trend area. So are the conditions for going long met? First, the price is stable above EMA55, with two consecutive one-hour closing prices above EMA55, satisfying this condition. Second, support confirmation; we need to see if there are long lower shadows, bottom formations, or structured rebounds off effective low points. From the one-hour chart, the K-line at eleven PM last night quickly retreated after touching near sixty-three thousand eight hundred, leaving a clear lower shadow, which is typical support confirmation. Third, downward momentum exhaustion: although the one-hour MACD histogram remains negative, the length of the green bars is consecutively shortening, and the RSI has rebounded from lower levels to above fifty-four, confirming momentum exhaustion. All three conditions are satisfied, and the Qinglan TPV system gives a clear bullish signal.
Let's look at on-chain and funding situations. SpaceX did not sell any Bitcoin in the second quarter and still holds over eighteen thousand coins, which is a solid support for market confidence. BlackRock's reverse split of ETHA reduced transaction costs to two basis points, which will further enhance the liquidity of ETH ETFs, benefiting the entire crypto market. Samsung's native integration of stablecoin functionality covers eight hundred million users, marking an important milestone for stablecoin adoption. However, it should be noted that the funding rate is currently bearish, indicating that there is still resistance from short contracts in the futures market; part of this price increase is driven by short covering. In the last twenty-four hours, a total liquidation of sixteen million five hundred thousand dollars occurred across the network, with short liquidations totaling ten million, and shorts were educated quite severely. This kind of short squeeze market requires observation for sustainability and one should not blindly chase high prices.
Key defensive and offensive levels, everyone remember. The first resistance level above is at sixty-four thousand five hundred dollars, the position of the daily MA30, which is also the lower edge of the previous dense trading area. The second resistance level is at sixty-five thousand dollars, and if there is a significant breakout here, the daily downward trend will be considered officially reversed. The first support level below is at the one-hour EMA55, around sixty-three thousand six hundred seventy-five, the boundary between bulls and bears according to the Qinglan TPV system; as long as the price does not fall below this level, the bullish trend remains intact. The second support level is at sixty-three thousand dollars, which is the low of last night's lower shadow and is also near the four-hour MA10. If it falls below sixty-three thousand dollars, this rebound will be declared over.
Regarding trading strategies, Sister Qinglan offers direct insights. The direction is clear: go long, but do not chase high; wait for a pullback to enter. Specifically, if the price pulls back to the sixty-three thousand seven hundred to sixty-three thousand eight hundred range, near the EMA55, and at the same time shows a one-hour bottom formation or a long lower shadow, you can enter a small long position. Set the stop loss at sixty-three thousand two hundred dollars, which is below last night's low, allowing enough room for fluctuation. The first target should be sixty-four thousand five hundred; once it reaches here, reduce the position by half, and hold the remaining position for sixty-five thousand. If the price directly breaks through sixty-five thousand with volume, do not hesitate, and after confirming with a pullback, you can add to your position, targeting sixty-six thousand. Here it should be emphasized that if the price falls below sixty-three thousand two hundred, regardless of any position, unconditionally set a stop loss and exit, do not fight against the market.
Finally, a risk warning. The rising expectations for a rate hike by the Federal Reserve in September are the biggest potential downside risk at present. Once any officials make hawkish comments, risk assets may collectively retrace, and it's essential to manage positions properly, keeping individual risk to no more than two percent of total capital.
Follow the Qinglan Crypto Classroom to grasp more trading opportunities! Welcome to visit the official website www.qinglan.org
📊 Qinglan TPV Trading Strategy Backtest Reference
🕒 Last Backtest Time 08-05 07:00:02
Total Analysis: 3395 Backtests: 3389 Accuracy Rate: 81.8% (2772/3389)
免责声明:本文章仅代表作者个人观点,不代表本平台的立场和观点。本文章仅供信息分享,不构成对任何人的任何投资建议。用户与作者之间的任何争议,与本平台无关。如网页中刊载的文章或图片涉及侵权,请提供相关的权利证明和身份证明发送邮件到support@aicoin.com,本平台相关工作人员将会进行核查。