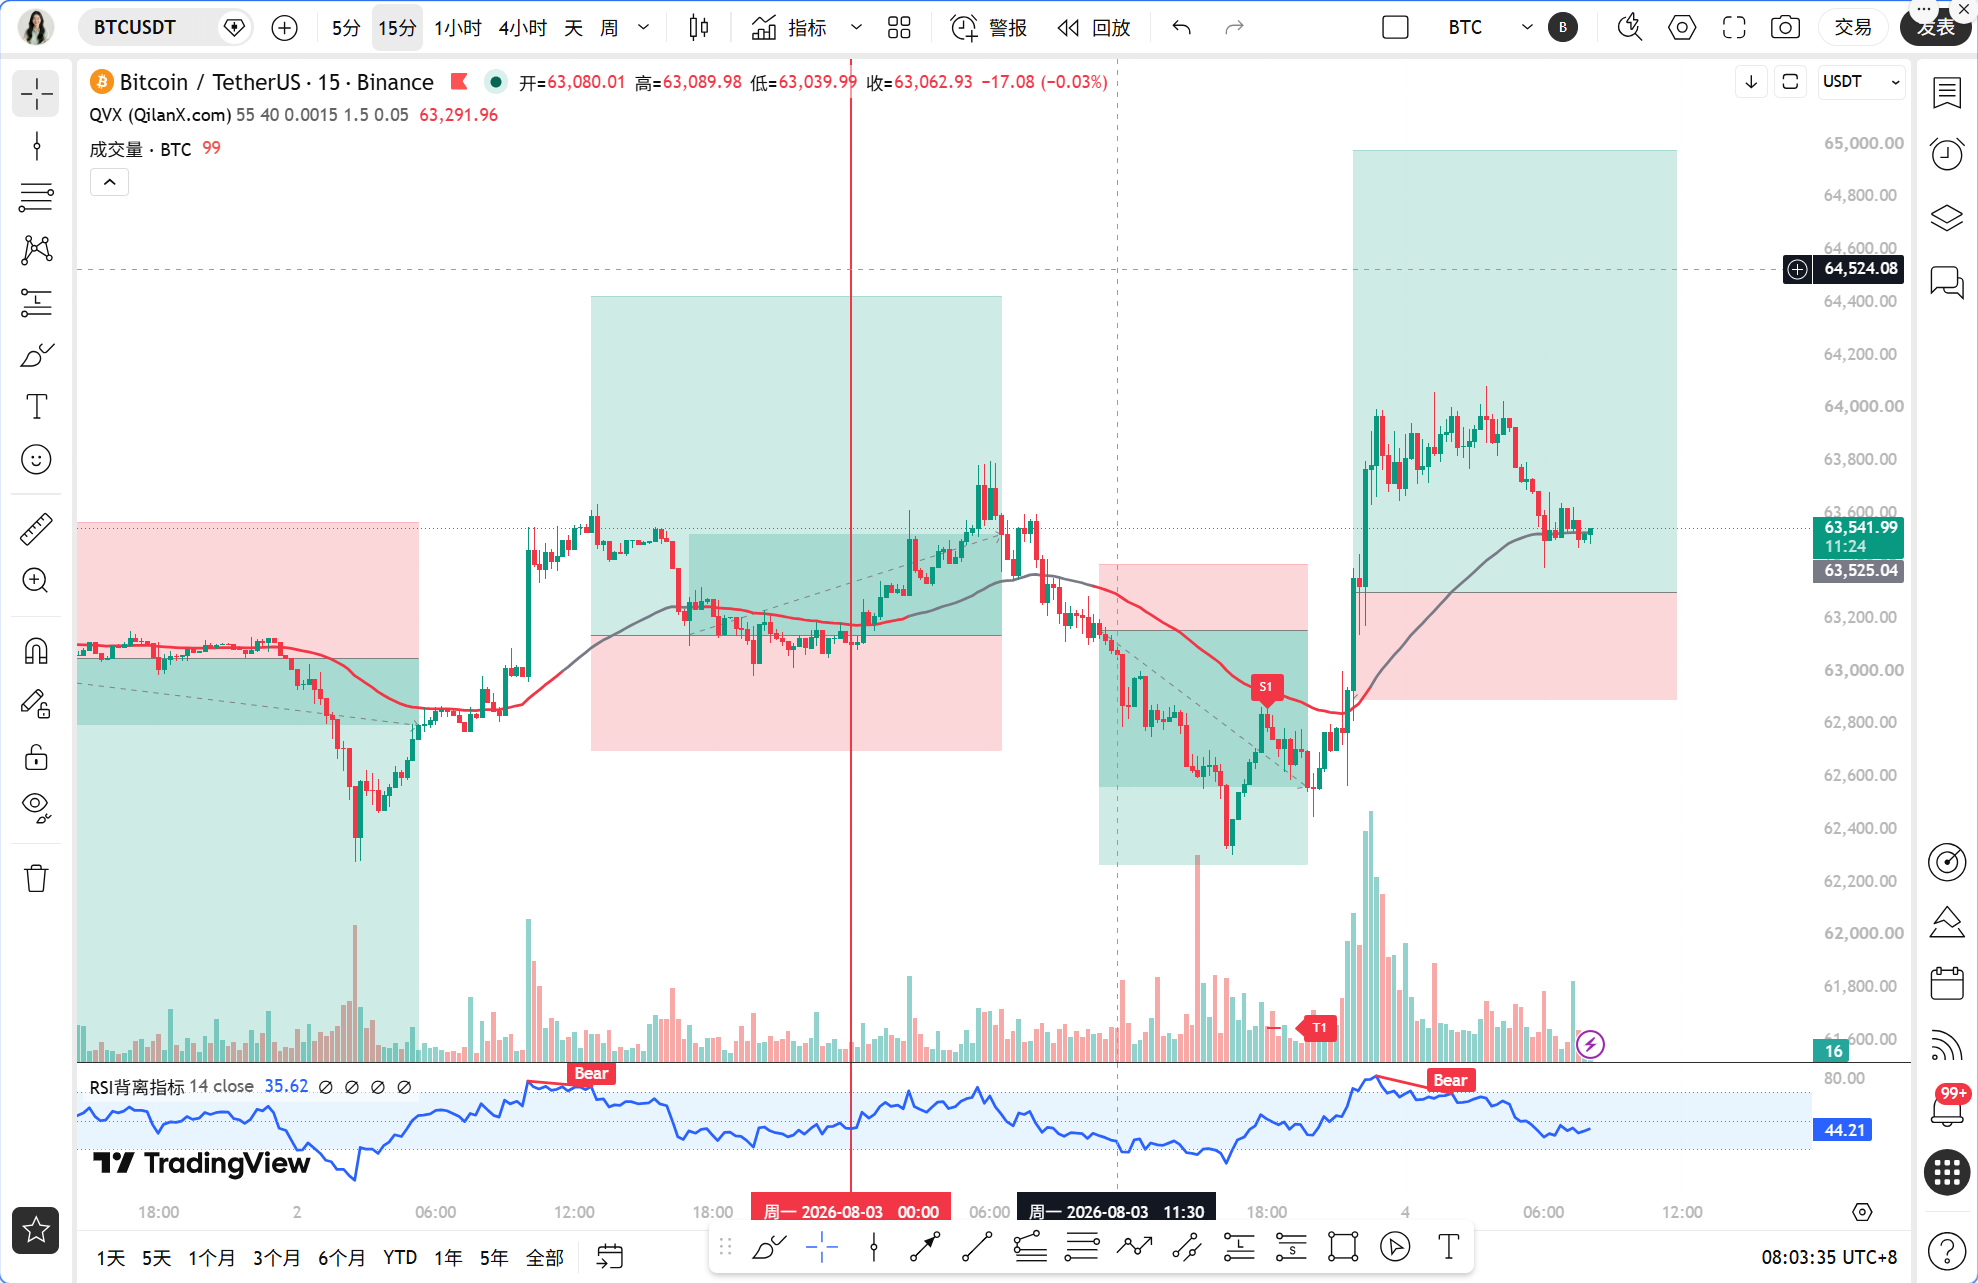
Good morning, teammates. Today, this market is once again guided by news events. The situation between the U.S. and Iran suddenly reversed, causing international oil prices to plummet by more than seven percent in a single day. Trump stated that the Strait of Hormuz would reopen by tomorrow at the latest, and risk assets reacted with a widespread rebound, with BTC also breaking through $64,000. Meanwhile, the CEO of Coinbase publicly supported the CLARITY bill, providing a clear framework for cryptocurrency regulation in the U.S., which can be considered a milestone on the road to compliance. One good and one bad, one external and one internal factor caused market sentiment to warm up from the freezing point in an instant. However, despite the rebound, whether it can hold depends on whether the technical analysis provides support.
Current time, August 4, 8:03 AM, BTC is priced at 63560 USDT, with a 24-hour increase of only 0.08%, essentially stagnating. This price is quite interesting, just slightly above the 1-hour EMA55, but it has also failed to effectively break through the round number of 64000. The fear and greed index is at 25, indicating extreme fear, which shows that retail investors are still in panic mode and have not recovered. However, it is often at such times that market movements can be unexpected.
First, let's look at the larger timeframes. On the daily chart, the MACD histogram is still negative, with the DIF below the zero axis, and the bearish trend structure remains intact. The RSI is at only 33.6, and while it is not oversold, it is still in a weak zone. MA5 is at 63272, MA10 at 63819, and MA30 at 64129, all showing a bearish arrangement in moving averages, indicating heavy pressure on the daily chart. The 4-hour chart is slightly better; the MACD histogram has turned positive, and there are signs of the DIF crossing above the DEA, while the RSI has risen to 61, indicating that the short-term rebound momentum is still accumulating. On the 1-hour chart, the MACD histogram is positive, with the RSI at 66; the price is above all short- to medium-term moving averages, with EMA55 at 63281, and the current price is above it, indicating a short-term bullish advantage. On the 15-minute chart, the RSI has dropped to 28.5, indicating short-term overselling and a need for technical correction. Overall, the larger timeframe is bearish, while the smaller timeframe is bullish, representing a typical oversold rebound pattern.
Next, let's verify using the Qinglan TPV system. The core rule is that the 1-hour EMA55 is the dividing line between bullish and bearish, and the current price is at 63560, with EMA55 at 63281, indicating the price is above it. In the past 8 hourly candles, the closing prices above EMA55 occurred 8 times with no breaches, indicating that bulls have firmly controlled the situation over these 8 hours; it is not sideways movement but rather one-sided action. For the long position conditions, the first criterion is that the price must stabilize above the 1-hour EMA55, and the closing prices of two consecutive candles must be greater than EMA55, which is satisfied. The second condition is to establish stable support; there were multiple dips around 63000 last night but they were all pulled back, forming a clear support platform, which is also satisfied. The third condition is that the downward momentum must weaken; the 4-hour MACD histogram is continuously expanding, and the 15-minute RSI is rebounding from a low point, which is satisfied as well. All three conditions are met; the signal given by the TPV system is in the bullish area, indicating that we can look for opportunities to go long.
Now, turning to on-chain and capital flow data. BTC market share stands at 56.37%, indicating that Bitcoin remains the top player, but data from Binance shows that altcoin trading volume has surged to 60%, with Bitcoin's share dropping to 22%, indicating signs of capital diversion. Ethereum ETF raised $365 million in July, a crucial figure indicating that institutional funds are entering the market through compliant channels, which is favorable for the overall market. However, the Coldcard vulnerability has triggered a large migration of $890 million worth of Bitcoin, causing distortion in on-chain data and potentially raising concerns about sell-offs in the short term. The coordinated intervention to strengthen the yen by the U.S. and Japan could have negative implications for risk assets and should be monitored.
Key defense and attack levels: the first resistance level above is 64000, a round number and also the position it broke through this morning before retracing; a secure break above it could open up upward space. The second resistance level is 65500, a previously dense transaction area. The first support level below is 63281, which is the 1-hour EMA55; this position must not be broken; if it falls below, the bullish logic will collapse. The second support level is 62500, a recent low that has been tested multiple times. In terms of operation, maintain EMA55 as a lifeline, going long above it and waiting below it.
Trading thoughts: the direction is bullish, but only long positions taken on pullback stabilization, no chasing highs. Entry conditions include waiting for the price to pull back to the range of 63300 to 63500, while on the 15-minute level a long lower shadow or bottom formation appears, and the MACD histogram shortens, allowing for a light entry. Set a stop loss below 63000; if it falls below, it indicates EMA55 has been lost, and the bullish logic is invalidated, necessitating exit. Target positions include the first target at 64000, where half of the position can be reduced, and the second target at 65500 for full profit-taking. If the price directly breaks through 64000 with volume and does not break on a retrace, a long can also be chased, with a stop loss at 63700 and a target at 65500. Control the position at no more than 20%, as the daily chart remains in a bearish trend, so counter-trend positions must be kept light.
Risk warning: the daily bearish trend has not reversed; all rebounds could be spikes, so strict stop losses are required; do not hold positions.
Follow Qinglan Crypto Classroom to seize more trading opportunities! Welcome to visit our official website www.qinglan.org
📊 Qinglan TPV trading strategy backtest reference
🕒 Last backtest time 08-04 07:00:01
Total analysis: 3377 Backtest: 3373 Accuracy: 81.9% (2762/3373)
免责声明:本文章仅代表作者个人观点,不代表本平台的立场和观点。本文章仅供信息分享,不构成对任何人的任何投资建议。用户与作者之间的任何争议,与本平台无关。如网页中刊载的文章或图片涉及侵权,请提供相关的权利证明和身份证明发送邮件到support@aicoin.com,本平台相关工作人员将会进行核查。