Tonight, the crypto market is buzzing with news, but there is a cautious undertone amidst the excitement. BlackRock's IBIT transferred 1,948 BTC to Coinbase Prime, with holdings reaching as high as 46.18 billion USD. This move has been interpreted by the market as a potential sell signal, as transfers to exchanges typically indicate readiness for liquidity. Meanwhile, Bitget announced its exit from the Japanese market, mandating the forced liquidation of all user positions by the end of 2026, placing regulatory pressure once again on market confidence. On one side, large transfers are happening by institutions, and on the other, platforms are scaling back. With such a combination, whether BTC can hold above 63,000 is indeed worth questioning.
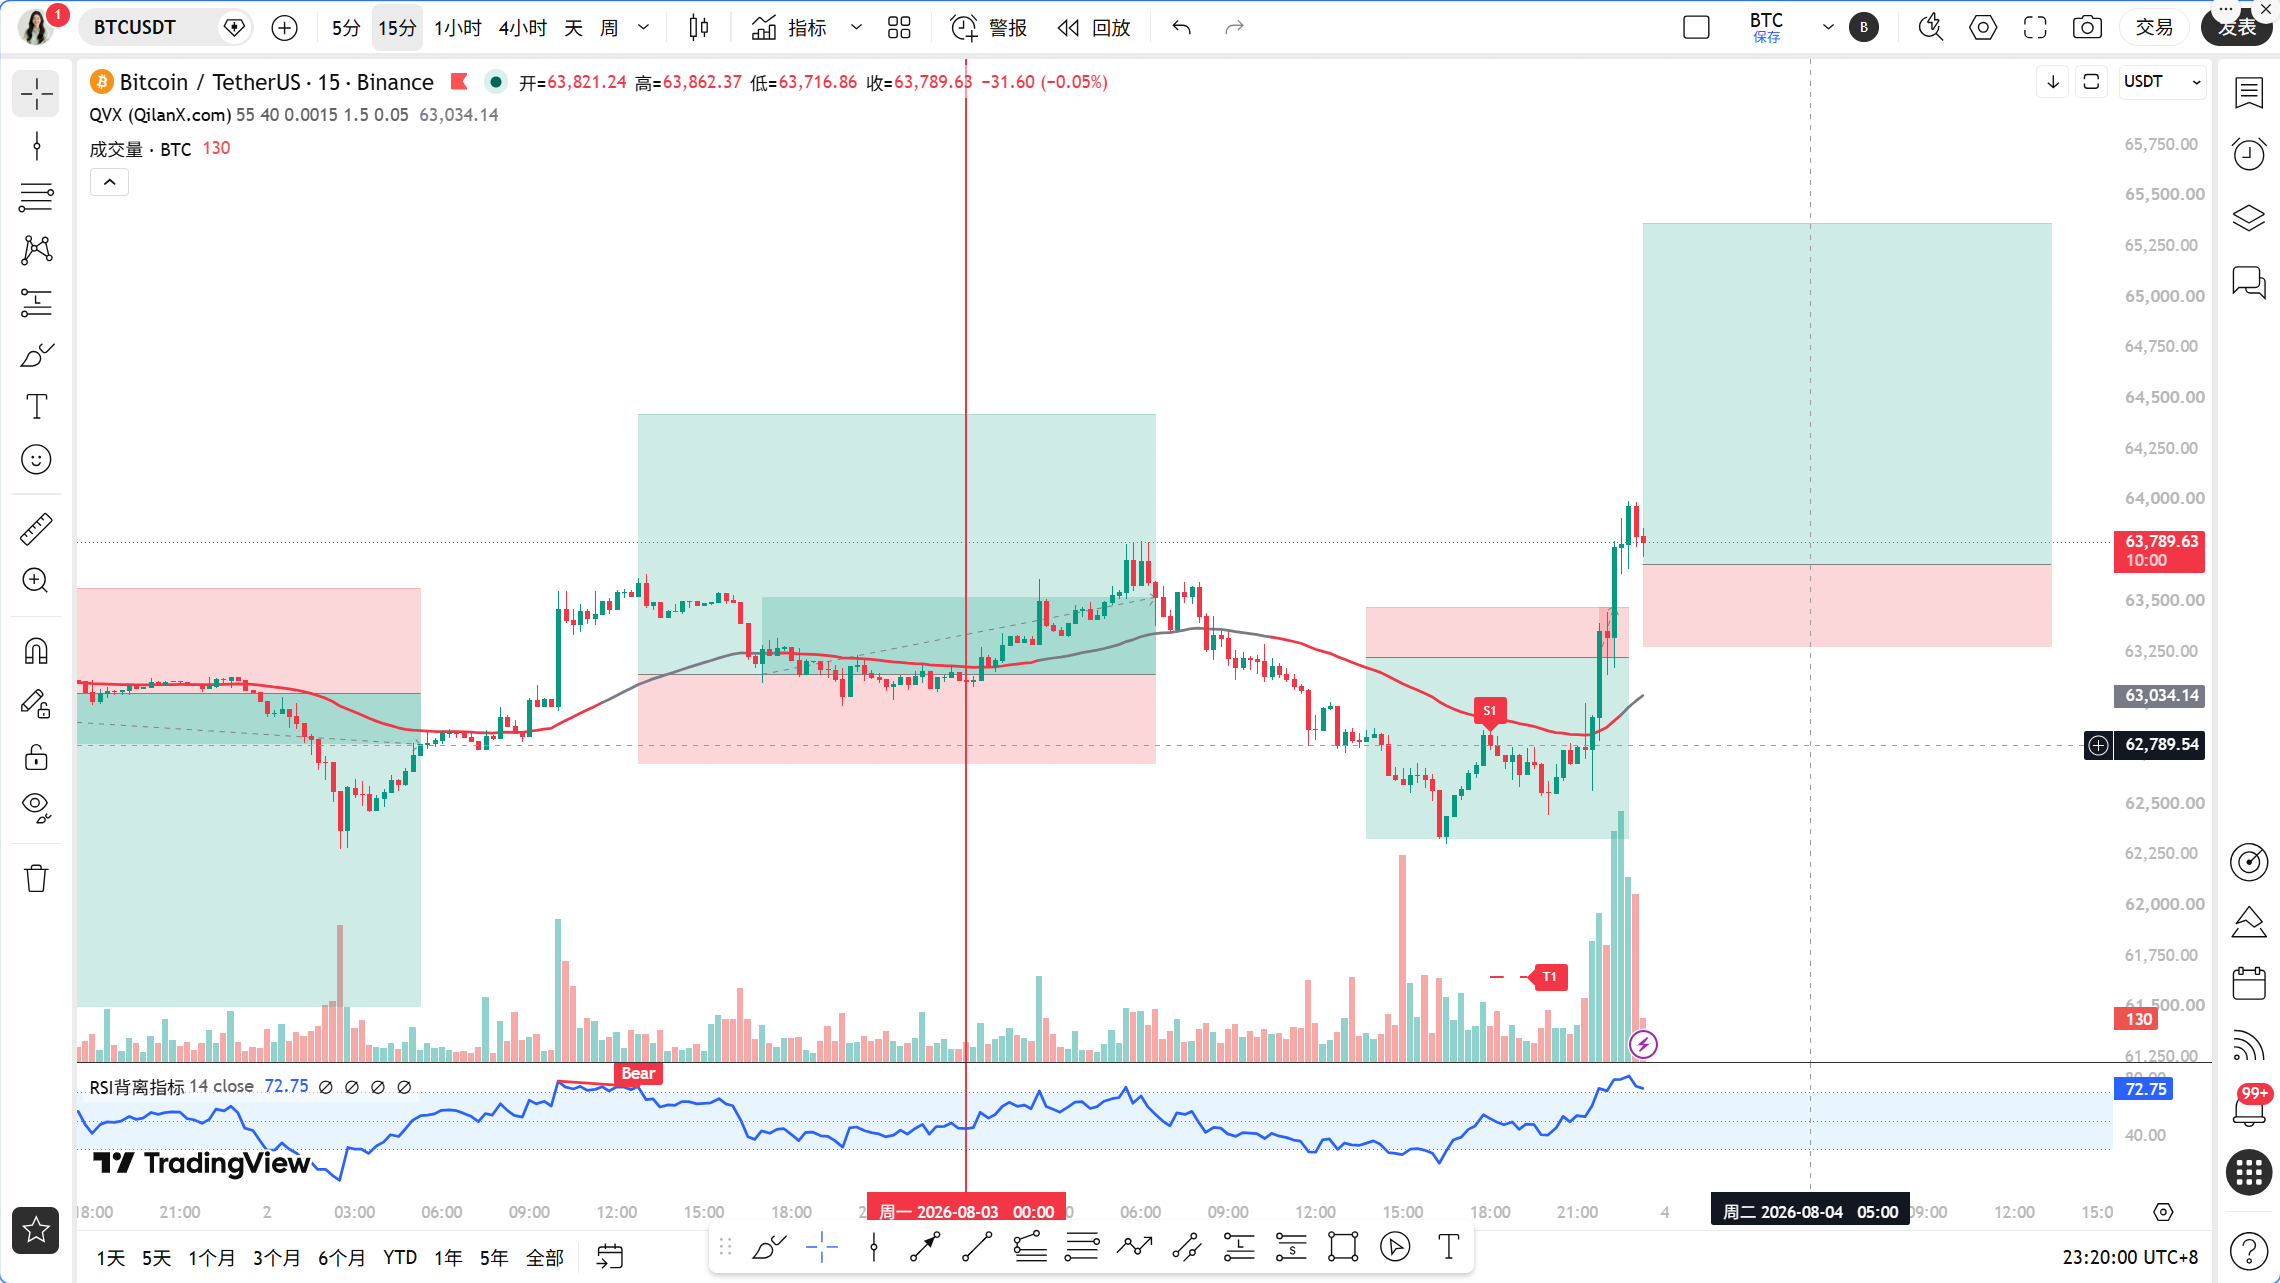
Currently, the BTC price is at 63,827 USDT, with a 24-hour increase of 1.13%. The fear and greed index is only at 28, indicating that market sentiment remains in the fear zone. This level is quite interesting; the price has returned above the 1-hour EMA55, but the overall structure has not fully shifted to bullish. Both bulls and bears are engaged in a tug-of-war within this narrow range between 63,000 and 64,000, and neither side is willing to concede easily.
Looking at the daily level, the MA5 is at 63,577, the MA10 is at 63,931, and the MA30 is at 64,142; the moving average system shows a bearish arrangement, with prices being pressed below all three moving averages. The MACD's DIF is operating within negative territory, while the DEA is above the zero axis, and the histogram shows an expanding negative value, indicating that the adjustment pressure at the daily level has not been fully released. The RSI reports 43.26, which is neutral but leaning weak, suggesting that the daily trend is still in a bearish correction phase, and any rebound can only be defined as a repair rather than a reversal.
Switching to the 4-hour level, the situation is somewhat more optimistic. The MA5 has crossed above the MA10, creating a short-term bullish arrangement; the MACD has formed a golden cross within the negative zone, and the histogram has shifted from negative to positive, reporting 57.96, indicating that the downward momentum at the 4-hour level is waning. The RSI reports 58.02, sitting in the neutral to strong region, and the rebound structure at the 4-hour level is still ongoing. However, note that the MA30 is at 63,502, and whether the price can hold above this level is crucial.
The 1-hour level is currently the most critical period to observe. The EMA55 is at 63,154, while the current price is 63,827—about 1.06% away from the EMA55, just above this bullish-bearish dividing line. The MA5, MA10, and MA30 are clustered within the range of 63,000 to 63,300; both the DIF and DEA of the MACD are operating near the zero axis, with the histogram reporting 113.22, showing strong short-term momentum. The RSI reports 60.72, not yet overbought and still has upward space. However, the 15-minute level RSI has already surged to 85.38, indicating that short-term overbought conditions are severe, with the potential for a technical pullback at any time.
Using the Qinglan TPV system for verification, the current 1-hour price is above the EMA55, but in the last 8 candles, the closing price greater than EMA55 occurred only 3 times, and there was only 1 instance of crossing. The distance from the EMA55 is 1.06%, not meeting the fluctuation threshold, indicating that the market is currently in the brewing stage of a unilateral trend. In terms of conditions for going long, the condition of the price closing above the EMA55 for two consecutive 1-hour candles is barely met, but the support stabilizing pattern is not typical, and the MACD histogram shortening over two cycles also lacks clarity. Overall, the signal provided by the TPV system is that the direction leans toward bullish, but confirmation is insufficient, necessitating waiting for more explicit pattern support.
On-chain data shows a fear and greed index of 28, with market sentiment being extremely cautious. BTC's market share is 56.44%, indicating that funds are still rotating within BTC and not flowing out into altcoin markets on a large scale. BlackRock's transfer of nearly 2,000 BTC to exchanges is a signal that requires caution, as similar actions in history are often accompanied by short-term selling pressure. On the other hand, some traders are using 43.68 million USD in high leverage to go long on BTC and ETH, with unrealized profits nearing 200,000 USD, indicating that there is also significant capital betting on a rebound. There is a huge divergence between bulls and bears, and in such times, the most ill-advised thing is to chase after price increases or sell at dips.
Looking at key offensive and defensive points, the first resistance level above is at the 64,000 psychological threshold. This position aligns with the daily MA10 and is also an area of concentrated past transactions; breaking and stabilizing above this level will open up upward space. The second resistance level is in the 64,500 to 65,000 range, corresponding to the daily MA30 and the previous high pressure at the 4-hour level. The first support level below is around 63,150, which is where the 1-hour EMA55 is located, serving as the dividing line between bulls and bears; losing this level would suggest a short-term bearish trend. The second support level is in the 62,500 to 62,800 range, which has been tested several times recently and is also where the 4-hour MA30 provides support. The third support level is at the 62,000 psychological threshold; once this level is breached, the adjustment space at the daily level will open up.
In terms of trading strategy, it is currently not advisable to chase high prices, as the 15-minute RSI is already severely overbought, indicating a substantial risk of short-term pullbacks. If one wants to go long, one should wait for the price to pull back to the range of 63,150 to 63,300, near the 1-hour EMA55, where a long lower shadow or bottom formation pattern appears. At the same time, if the MACD histogram no longer expands, a small position can be taken with a stop-loss placed below 62,800, targeting 64,000, and looking to 64,500 after a breakout. If the price breaks through 64,000 with volume and stabilizes, one can follow the trend and go long, with a stop-loss at 63,600 and a target of 64,800 to 65,000. As for shorting, if the price falls below 63,150 and closes below the EMA55 for two consecutive 1-hour candles, one can test a short position with a stop-loss set above 63,600, targeting 62,500, and looking to 62,000 after breaking down. For the current range of fluctuations, the price is fluctuating between 63,150 and 64,000; frequent trading within this range is not recommended, and it is better to wait for a clear direction before entering the market.
Risk warning: If the BTC transferred to the exchange by BlackRock experiences significant outflows or sells actions, it may trigger a chain sell-off, so strict position control is essential.
Follow Qinglan Crypto Classroom for more trading opportunities! Visit the official website at www.qinglan.org
📊 Qinglan TPV Trading Strategy Backtesting Reference
🕒 Last backtesting time 08-03 07:00:02
Total analysis: 3364 Backtests: 3360 Accuracy: 81.9% (2752/3360)
免责声明:本文章仅代表作者个人观点,不代表本平台的立场和观点。本文章仅供信息分享,不构成对任何人的任何投资建议。用户与作者之间的任何争议,与本平台无关。如网页中刊载的文章或图片涉及侵权,请提供相关的权利证明和身份证明发送邮件到support@aicoin.com,本平台相关工作人员将会进行核查。