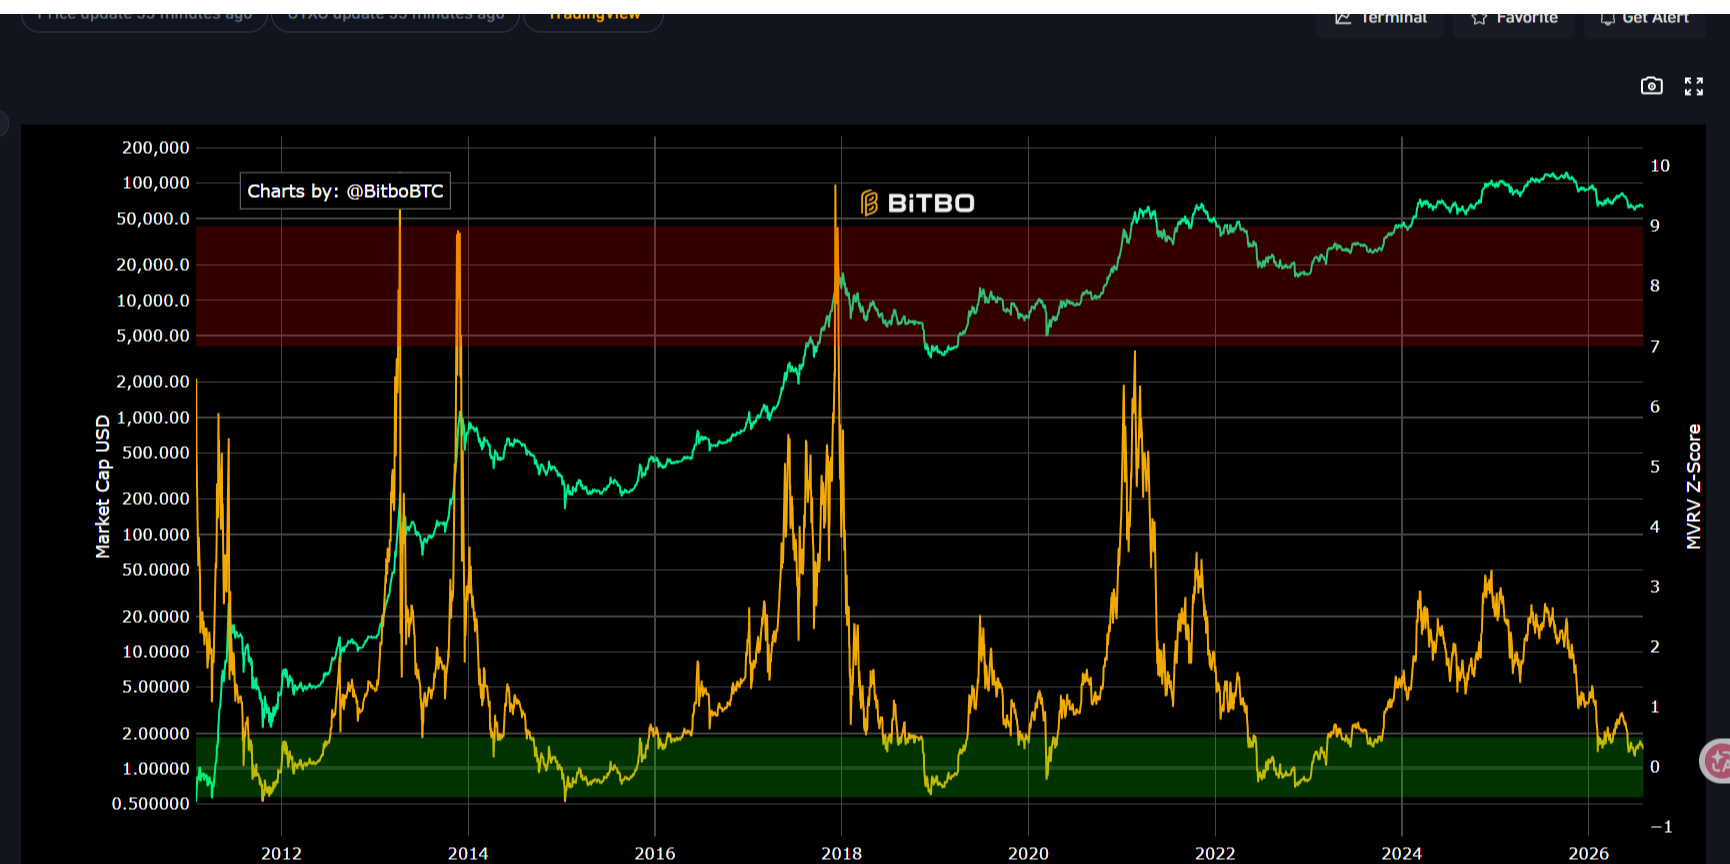
Bitcoin has fallen back from a high of around 126,000 and is currently oscillating in the 60,000 to 65,000 range.
Looking solely at the price, the market is filled with panic; but if we zoom out to the daily chart, we can see that the market has actually established a very clear structure.
Downward channel, step-down movement.
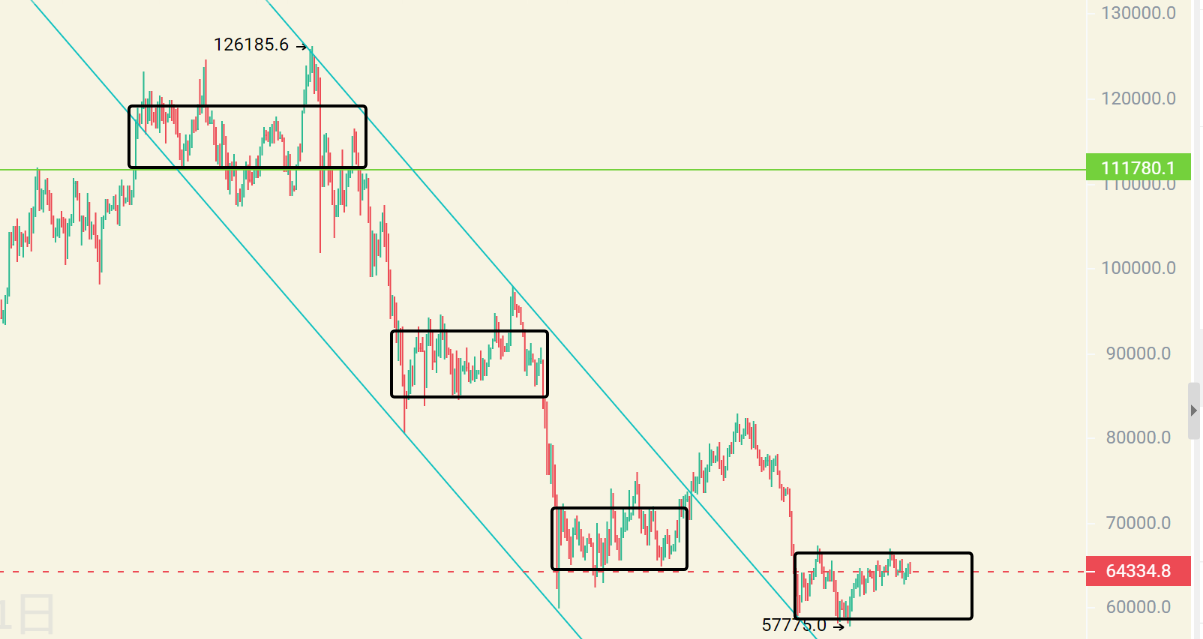
After peaking at 126,000, BTC has been moving along the downward trend line, with each rebound forming a new trading range:
Oscillating around 120,000, broken;
Consolidating around 90,000, broken;
Sideways around 70,000, broken again.
Each time it goes like this:
Rebound repair → Sideways consolidation → Trend selection → Breaking downwards.
And currently, the price has arrived at the fourth trading range.
⸻
60,000 to 65,000 has become a critical area for bulls and bears.
Currently, BTC is repeatedly oscillating above 60,000, indicating that the support strength below is increasing.
However, from a technical structure perspective, the downward trend has not completely ended.
The key focus above is:
65,000 to 66,000 area.
This is not only the upper boundary of the current trading range but also the position for a potential short-term trend reversal.
If the daily chart can effectively stabilize above 66,000:
It means the downward rhythm has been broken, and the market has a chance to test:
68,000 to 70,000 area.
Conversely, if the rebound fails to break through and continues to be pressured downwards, the market may again test:
60,000 or even near 57,700 support.
⸻
Do not overlook the power of cycles.
The market always operates on expectations.
In 2024, BTC will undergo a halving; in 2025-2026, the market will be in an expansion phase, alongside expectations for crypto policies during Trump's presidency.
But cycles do not rise in a straight line.
Real big movements are often accompanied by:
Washing out, oscillation, and emotional fluctuations.
Many people chase during the rise and panic during the fall.
The core of trend trading is to wait for key positions to give answers.
⸻
Old Jin's perspective
The opportunity for medium to long-term entry is here.
Enter long positions around 63,000 to 62,500, looking at 64,000 to 65,000
Ethereum is also bullish, 1,890 to 1,910.
The market will not tell you the direction in advance.
But the candlestick has already left traces.
Understand the structure, wait for confirmation, and act accordingly.

免责声明:本文章仅代表作者个人观点,不代表本平台的立场和观点。本文章仅供信息分享,不构成对任何人的任何投资建议。用户与作者之间的任何争议,与本平台无关。如网页中刊载的文章或图片涉及侵权,请提供相关的权利证明和身份证明发送邮件到support@aicoin.com,本平台相关工作人员将会进行核查。