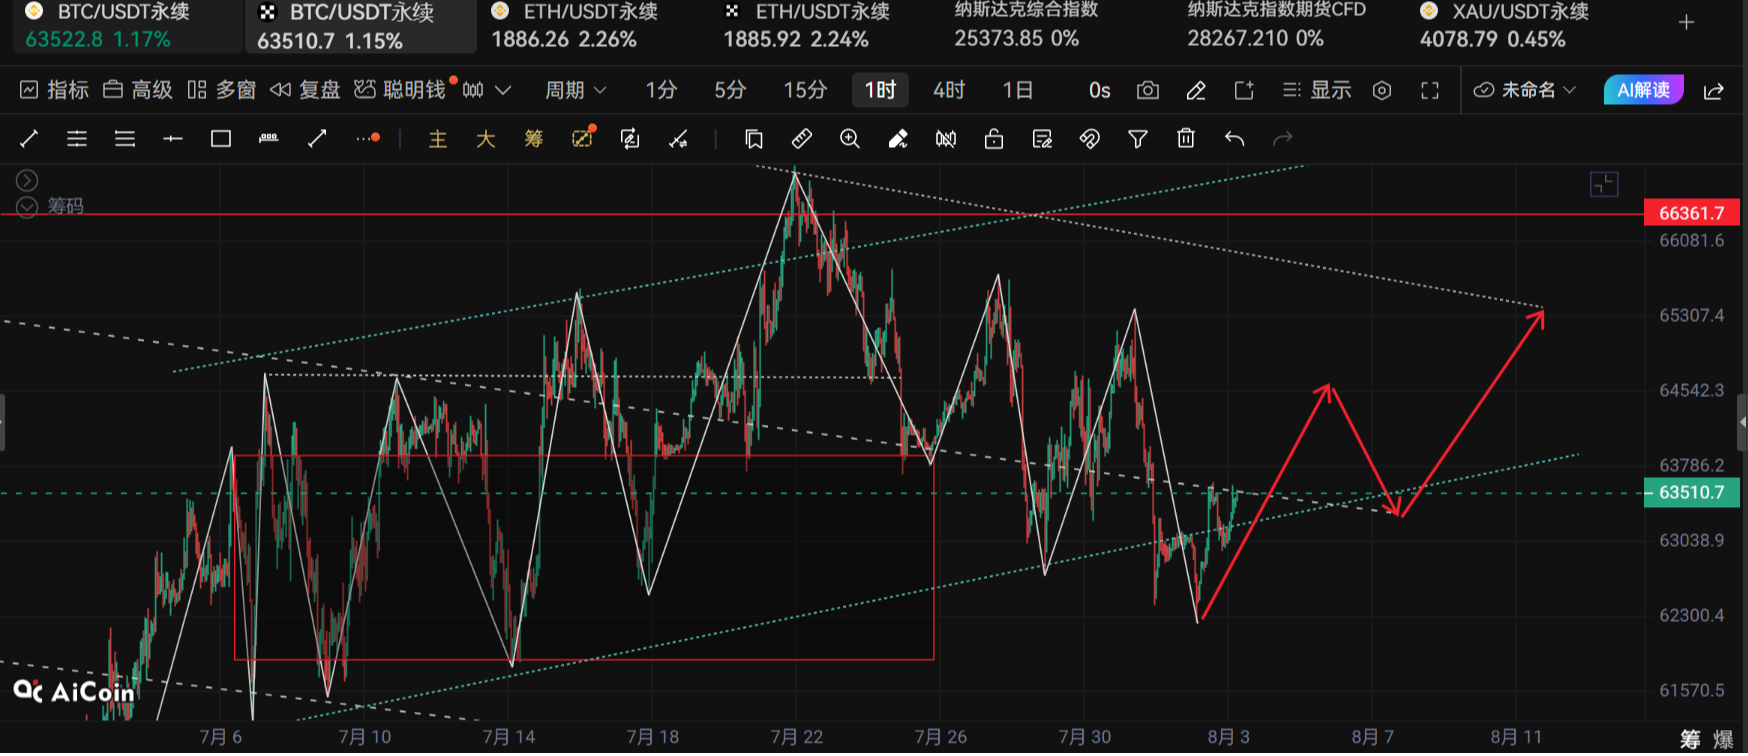
Good morning, teammates. Today, both the bulls and bears are holding back their big moves. The biggest news from last night is that the easing of tensions between the U.S. and Iran caused oil prices to plummet by 9%, but the Japanese and South Korean stock markets opened with sharp declines, indicating that risk aversion has not really dissipated; secondly, on-chain data has shown extreme signals, with 890,000 BTC piled up at the $63,000 level, creating a historical high in concentration. Meanwhile, a giant whale has re-entered ETH after two years, transferring 3,500 coins out of the exchange at an average price of $1,856, while the well-known trader Loracle has heavily shorted ETH and HYPE, with a total short value exceeding $46 million. This level of confrontation between bulls and bears indicates that the market has reached a critical point of change.
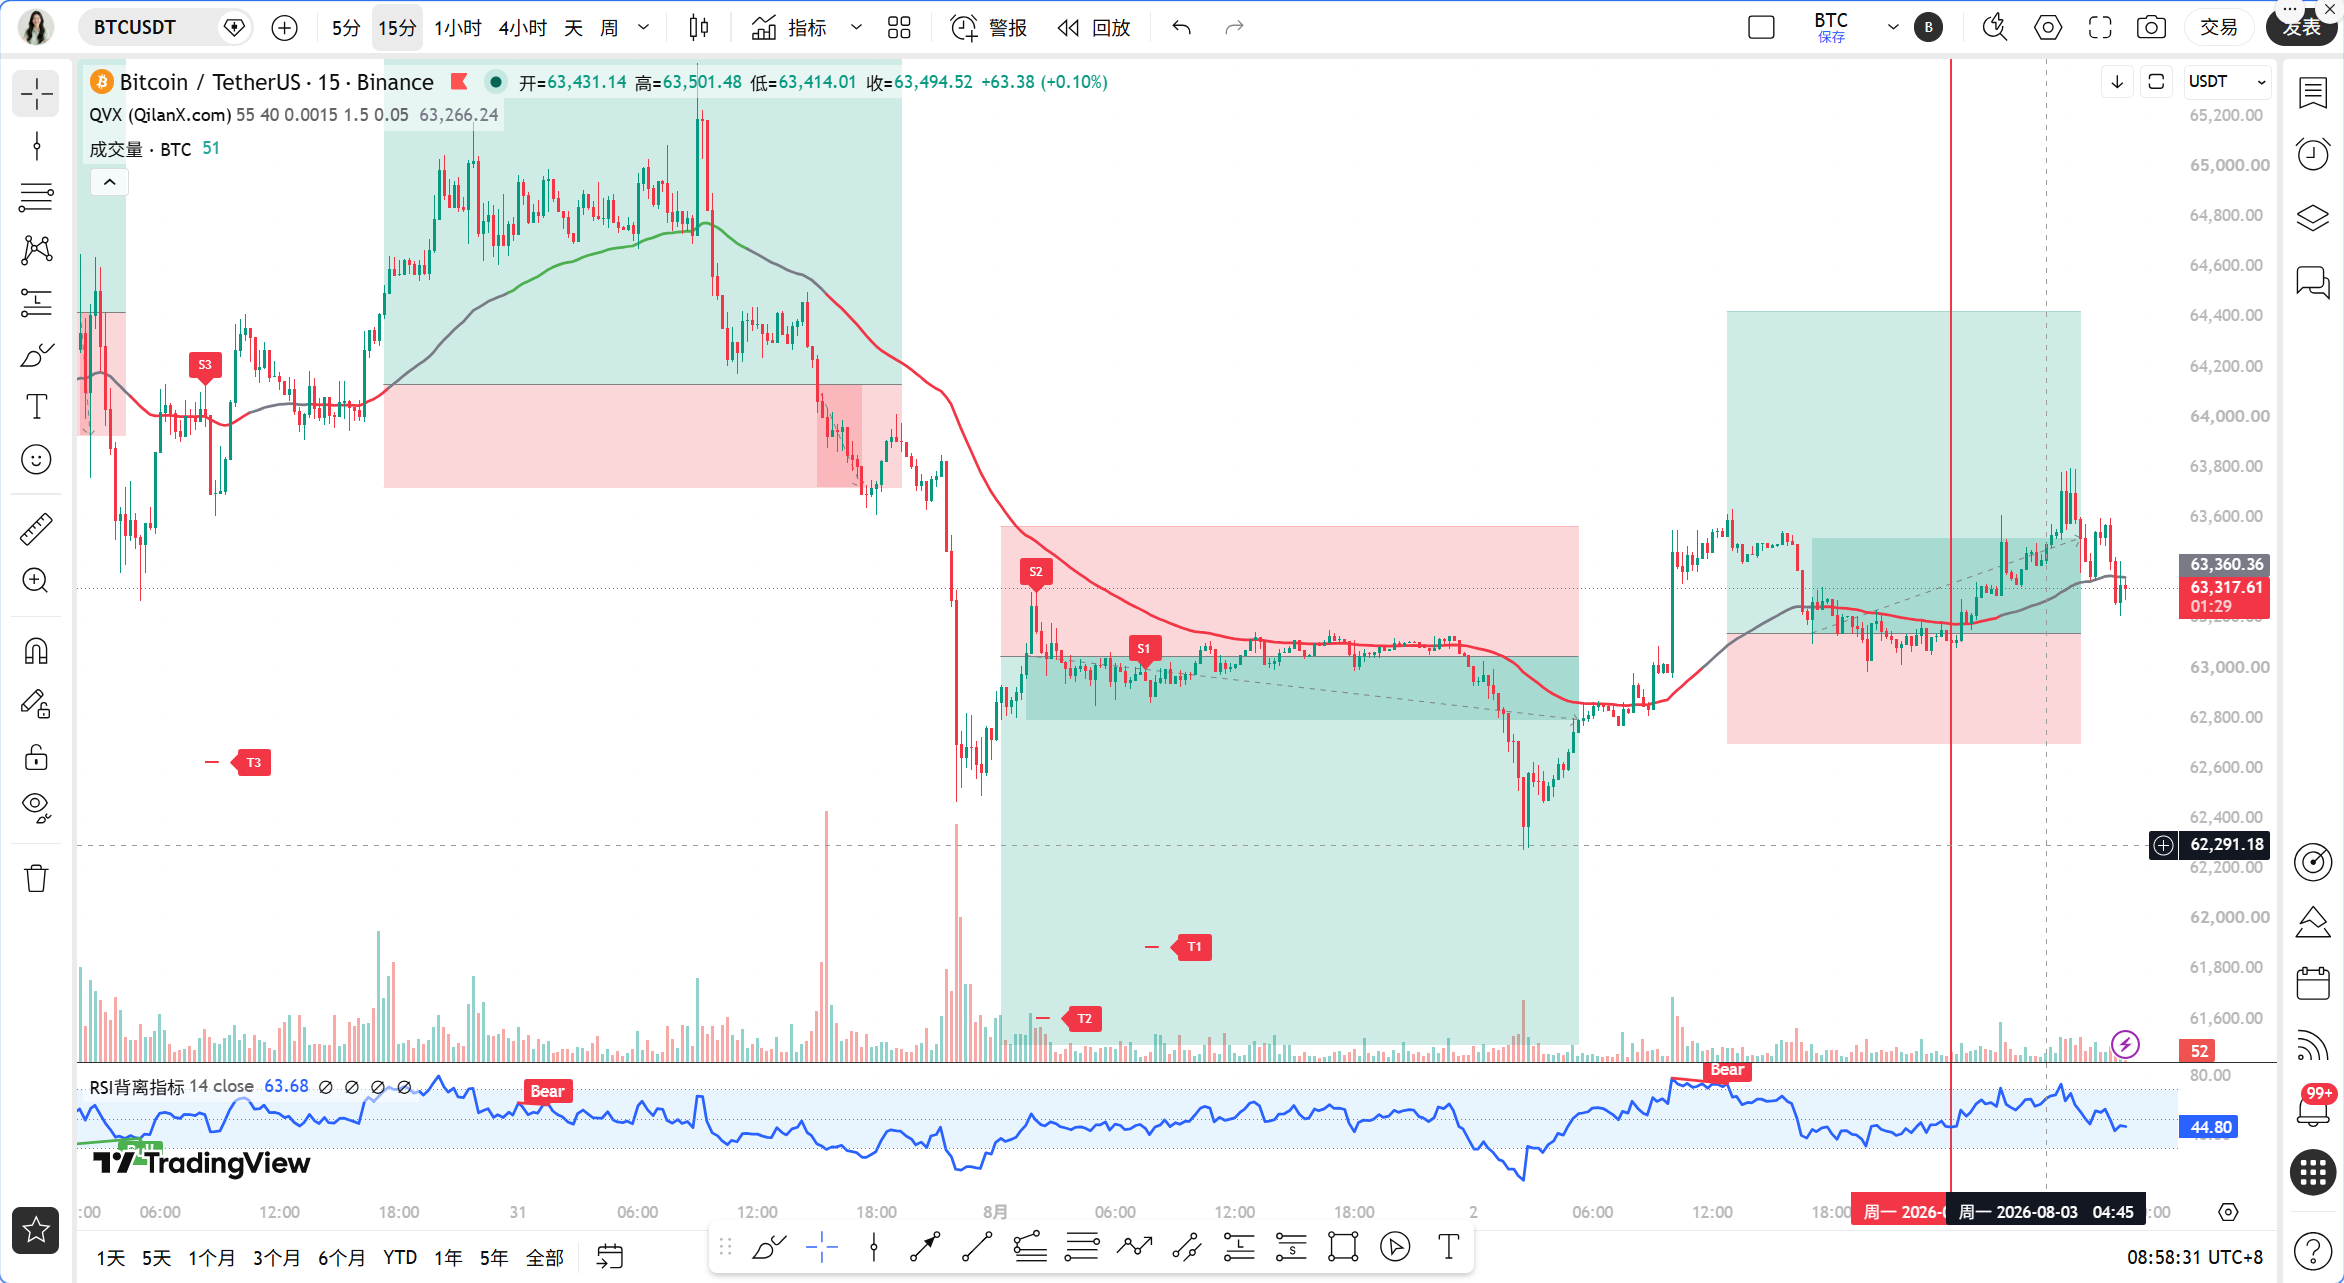
The current time is 8:57 AM on August 3rd, with BTC quoted at 63,318 USDT, a 24-hour increase of 0.81%. The price is exactly hovering around the 1-hour EMA55, with an absolute amplitude from the bulls-bears dividing line of only 0.05%, which is typical line-hugging volatility. The Fear and Greed Index is at 28, with market sentiment still in the fear zone, but BTC's market share is at 56.27%, indicating that funds are still seeking refuge in BTC and there has not been a massive exit.
First, let's look at the larger cycle. On the daily level, MA5 is at 63,475, MA10 is at 63,880, and MA30 is at 64,125, with moving averages arranged in a bearish sequence. The MACD histogram is at negative 206, the DIF is below the zero axis, and the RSI is only at 40.86, indicating an overall bearish trend. However, note that there are positive signals at the 4-hour level; the MACD histogram has turned positive with a value of 75.17, the DIF is recovering from deep negative values, and the RSI is back to 55.65, indicating that the medium-term downward momentum is waning and there are signs of a bottom forming at the 4-hour level. At the 1-hour level, the price is above EMA55, the MACD histogram is at positive 17.74, and the RSI is around 54, indicating a short-term bullish trend. The 15-minute level appears hesitant, with the MACD histogram at negative 37 and the RSI falling back to 41.8, indicating short-term pullback pressure.
Let's verify with the Qinglan TPV system. The current 1-hour EMA55 is at 63,346.84, and the current price is 63,318, which means the price is just a little below EMA55. In the past 8 one-hour candlesticks, the closing price has been above EMA55 6 times and has crossed EMA55 2 times. According to system rules, this does not meet the definition of a consolidation range, but the price distance from EMA55 is less than 0.3%, which counts as line-hugging volatility, increasing the probability of consolidation. For long positions, the price has not had 2 consecutive one-hour candlesticks closing steadily above EMA55, so the first condition is not met, hence no chasing longs. For short positions, the price also has not had 2 consecutive one-hour candlesticks closing below EMA55, which similarly does not meet the criteria. The current state is a typical prelude to a change, with both bull and bear signals incomplete, and the system's judgment is to wait and see for directional confirmation.
On-chain data shows that there is a large amount of buy order support below BTC, with the buy wall from orders placed at the low of June currently in effect, limiting short-term downward space. However, the chips are highly concentrated at $63,000, with 890,000 BTC piled up at this level; if it breaks down, stop-loss and liquidation orders could trigger a cascading effect. Glassnode data indicates that the Bitcoin futures basis has consistently been below U.S. treasury yields, and historically, this signal often appears at the bottom of cycles, but there may not be an immediate rebound in the short term; time is needed for digestion. Additionally, after the Coldcard attack, small BTC transfers surged to new highs post the FTX crisis, indicating that some users are transferring assets for safety, which puts some pressure on market sentiment.
The key support and resistance levels are as follows: The first resistance level above is in the region of 63,500 to 63,600, above the 1-hour EMA55, which serves as a short-term watershed for bulls and bears. A breakthrough and stable hold above this level can open up upside space. The second resistance level is near the 4-hour MA30 at around 63,650; this area overlaps with a previous dense trading area, making it heavier resistance. The first support below is at the psychological barrier of 63,000, which is also the core area of the buy wall. The second support is between 62,500 and 62,600, which is close to the June low, and if it breaks below, it can open up further downside space. On the daily level, if below 62,500 is breached, the next target is 61,500.
Trading strategy: At the current stage, do not chase trades, only take trades confirmed in the direction. For long positions, we need to wait for the price to have 2 consecutive one-hour candlesticks closing steadily above EMA55, which means above 63,450, and at the same time show a long lower shadow or bottom formation configuration, and the MACD histogram should contract for 2 consecutive candlesticks. A small position can be taken for longs, entering the range of 63,450 to 63,550, with a stop loss below 63,000; the first target is 64,000 and the second target is 64,500. For short positions, we need to wait for the price to have 2 consecutive one-hour candlesticks closing below EMA55, meaning below 63,250, and at the same time show a long upper shadow or top formation configuration. After confirming the lack of strength in the rebound, we can enter for a short trade, with entry in the range of 63,100 to 63,200 and a stop loss above 63,650; the first target is 62,500 and the second target is 62,000. If the price oscillates repeatedly between 63,000 to 63,600 without meeting TPV system direction conditions, then stay out and wait, not participating in the oscillation.
Risk warning: The concentration of chips at $63,000 may lead to severe directional choices, and any breakout in either direction may accompany pin bar movements; it is essential to control positions and strictly implement stop losses.
Follow Qinglan Crypto Classroom to grasp more trading opportunities! Welcome to visit the official website www.qinglan.org
📊 Qinglan TPV Trading Strategy Backtest Reference
🕒 Last Backtest Time 08-03 07:00:02
Total Analysis: 3364 Backtests: 3360 Accuracy: 81.9% (2752/3360)
免责声明:本文章仅代表作者个人观点,不代表本平台的立场和观点。本文章仅供信息分享,不构成对任何人的任何投资建议。用户与作者之间的任何争议,与本平台无关。如网页中刊载的文章或图片涉及侵权,请提供相关的权利证明和身份证明发送邮件到support@aicoin.com,本平台相关工作人员将会进行核查。