Li Ying's discussion on currency: Latest market analysis of 8.3 Bitcoin (BTC) and Ethereum (ETH)
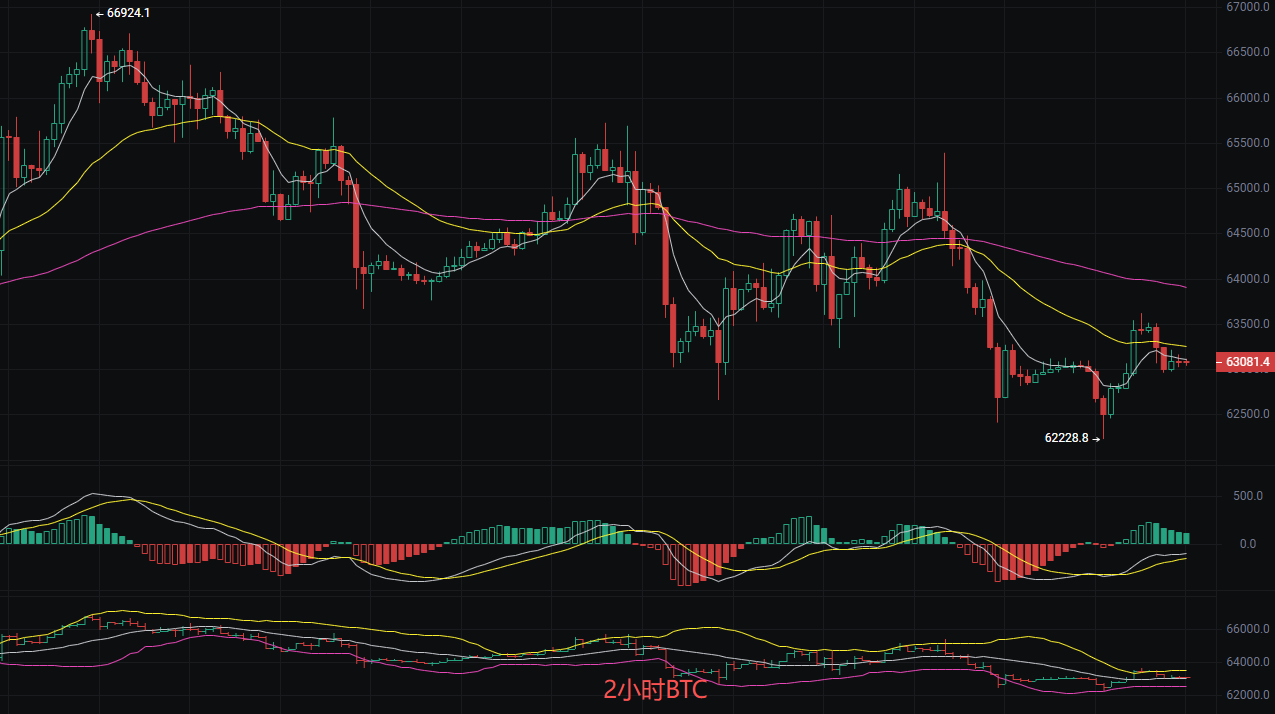
Currently, Bitcoin is at 63100. From the chart, it has gone through a phase of high gains followed by a pullback and is currently in a consolidation phase, with the market digesting previous gains while waiting for a new direction. The EMA moving average system shows the short-term EMA7 and EMA30 are converging around 63124 and 63256, indicating a balance between short-term bullish and bearish forces, while the long-term EMA120 forms upper pressure at 63914. In the MACD indicator, the DIF and DEA are operating below the zero axis, indicating that short-selling momentum has weakened but not completely dissipated. The price is around the mid-band at 63034, with the upper band at 63504 and the lower band at 62564 forming a narrow oscillation range, and the narrowing opening suggests an impending change in trend. Overall, the technical outlook presents a weak oscillating pattern, and we need to wait for an effective breakout signal to confirm direction.
Short-term trading thoughts:
Long position between 63000-62500, stop loss at 62000, target at 64500 aimed at 65000.
Short position between 65000-65500, stop loss at 66000, target at 64500 aimed at 63500.
Ethereum
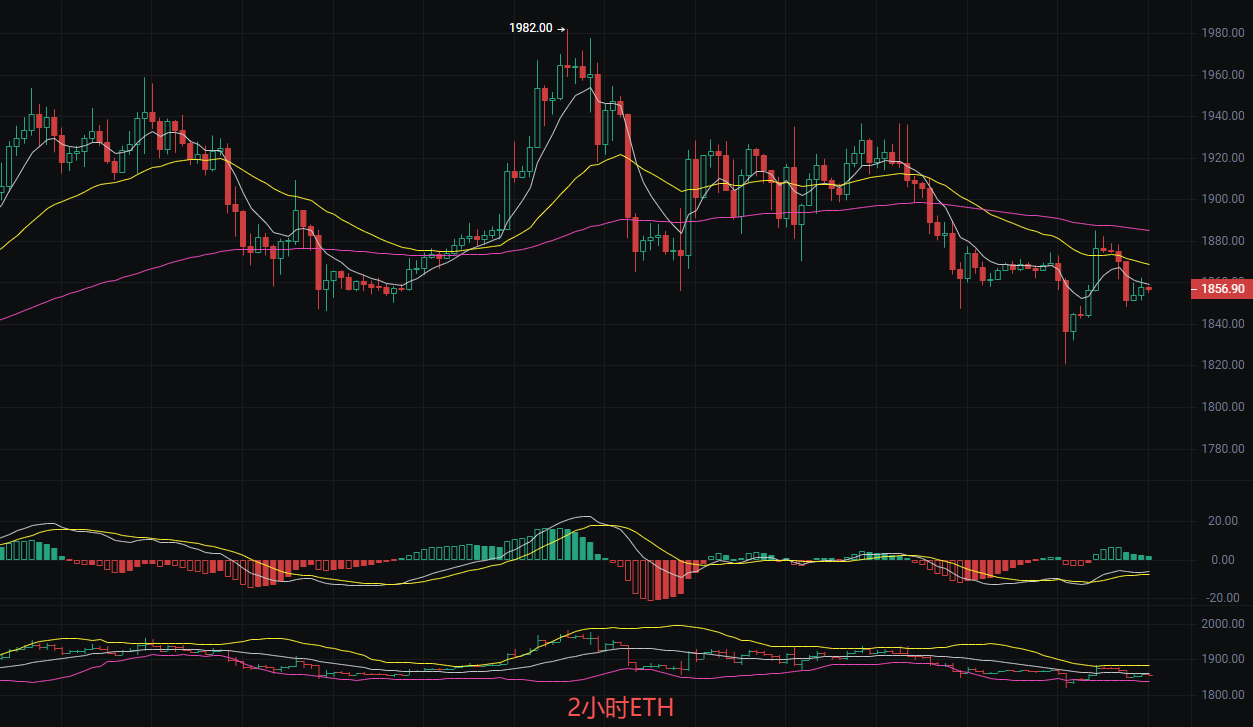
Currently, Ethereum is priced at 1860; it has gained too much previously and needs to digest profit-taking. Now both bulls and bears are tugging back and forth in the 1850 - 1860 range, neither breaking key support nor strongly breaking through resistance, typical of a consolidation phase. In the technical indicators moving average system, EMA7 and EMA30 form resistance above the current price, while EMA120 is a medium to long-term resistance point, indicating a bearish short-term trend; the MACD indicator shows DIF and DEA operating below the zero axis, with bearish strength still prevailing; regarding the Bollinger Bands, the price is close to the lower band at 1839, the mid-band at 1861 is key resistance, and the upper band at 1883 is temporarily out of reach. Overall, the indicators resonate with a weak short-term oscillation, and we need to be cautious of the risk of breaking through the lower support.
Short-term price reference:
Long position at 1850, defend at 1830, stop loss at 1800, target at 1960 aimed at 2000.
Short position at 1980, defend at 2010, stop loss at 2040, target at 1920 aimed at 1890.
The above content is exclusively original by Li Ying. Please indicate the source when reprinting! The article's publication review has a delay; market conditions change rapidly, and the above suggestions are for reference only, with risks borne by the user.

Warm reminder: The above content is only created by the author on Weibo; the advertisements at the end of the article and in the comment area are unrelated to the author, please discern carefully. Thank you for reading.
免责声明:本文章仅代表作者个人观点,不代表本平台的立场和观点。本文章仅供信息分享,不构成对任何人的任何投资建议。用户与作者之间的任何争议,与本平台无关。如网页中刊载的文章或图片涉及侵权,请提供相关的权利证明和身份证明发送邮件到support@aicoin.com,本平台相关工作人员将会进行核查。