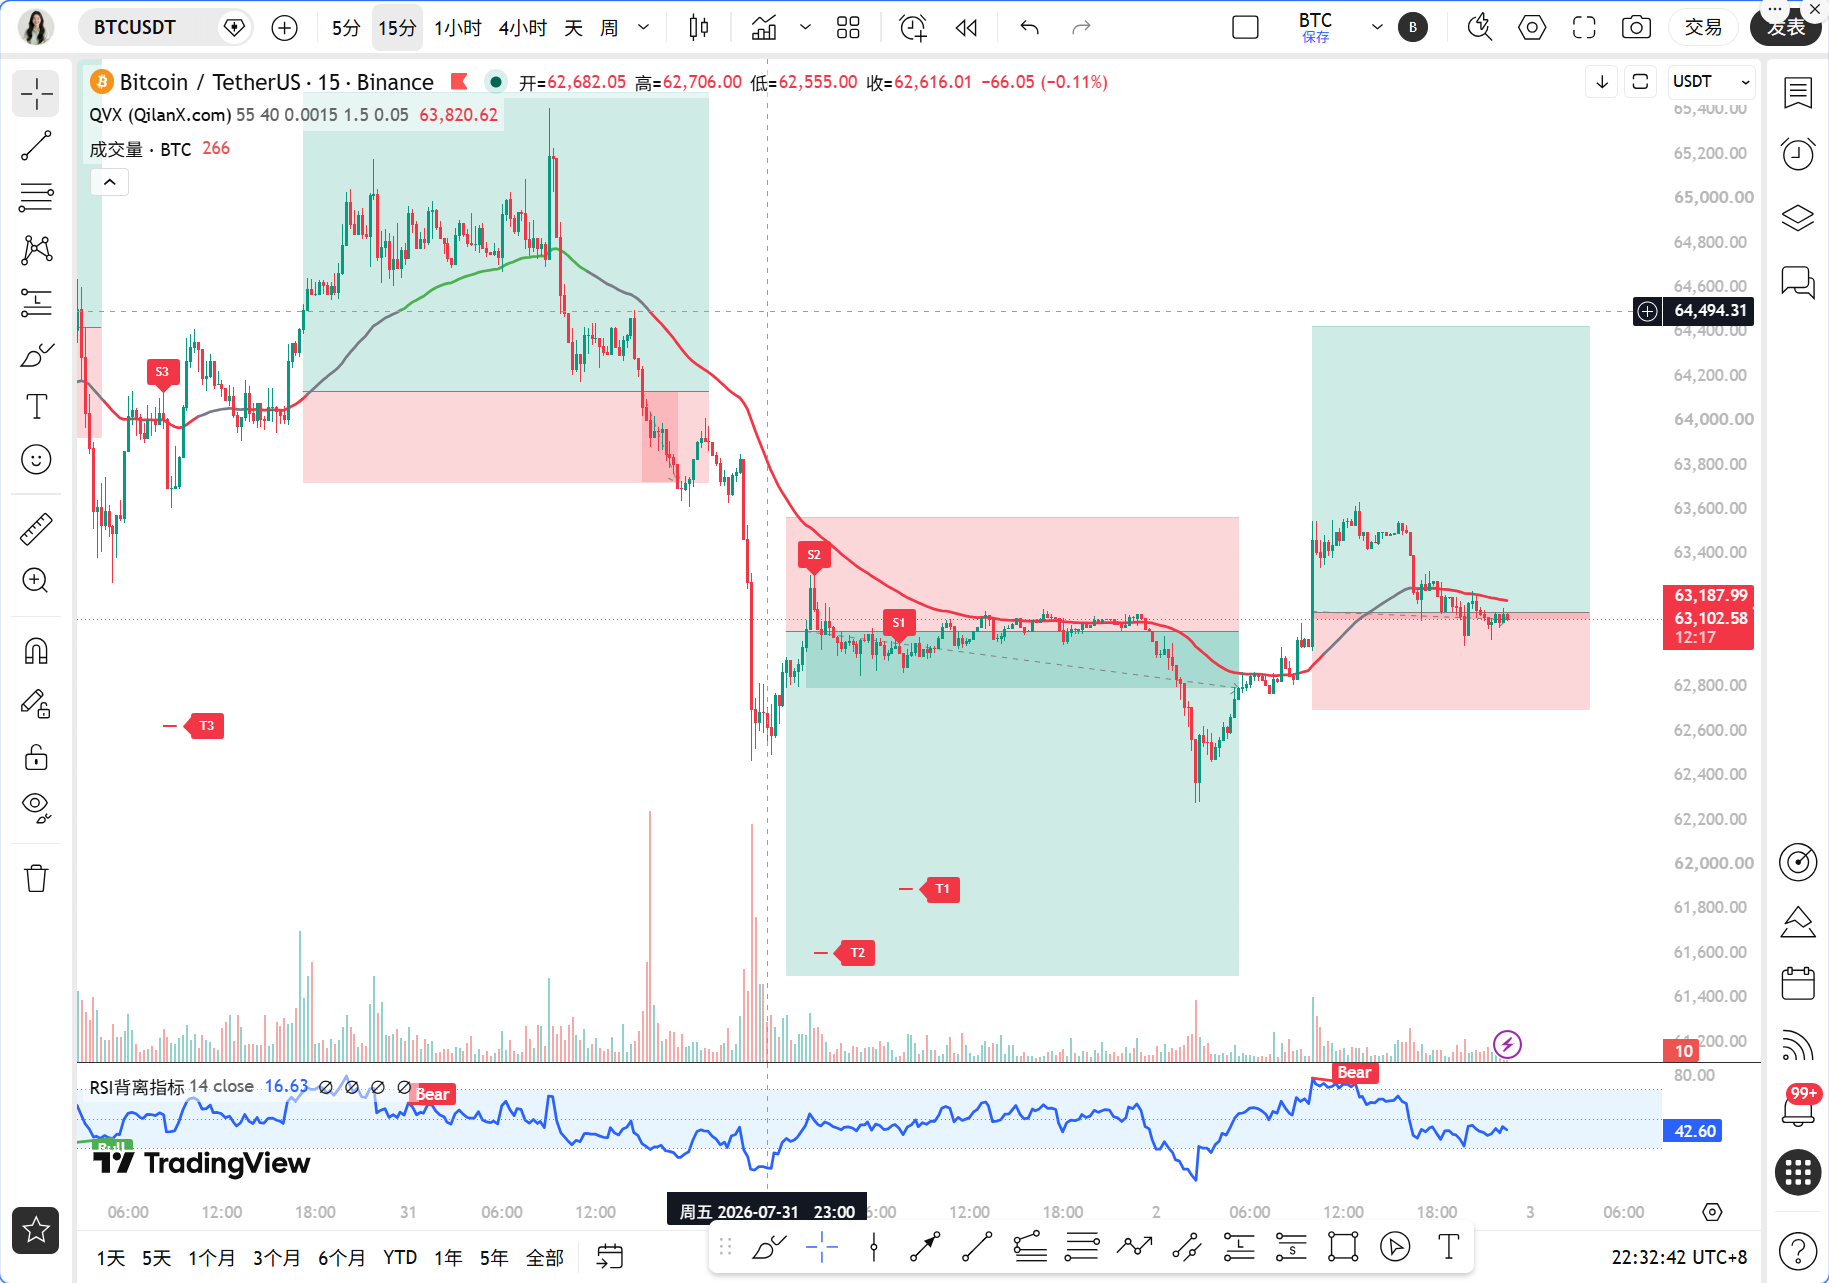
Dear teammates, tonight's market is quite interesting. BTC is oscillating around 63,000 USD, while there was sudden news from South Korea saying they would implement emergency measures to reduce the leverage of ETFs to 1.5 times. Although on the surface this move is aimed at traditional finance and does not directly name crypto assets, the market is very sensitive, and speculative sentiment tends to pull back at the slightest hint of change. Additionally, Bitcoin has fallen below the 63,000 USD mark tonight, and after a short-term breakdown, technical selling pressure could emerge at any time. With these two factors combined, the 63,000 mark has become a battleground for bulls and bears.
First, let's look at the current market situation. It is now 22:33 on August 2nd, Beijing time, with BTC priced at 63,111 USDT, and the 24-hour price change is basically flat, at only 0.01%. This price is quite delicate, just slightly below the 1-hour EMA55, representing typical line-bound fluctuations. The fear and greed index is only 27, indicating that market sentiment is still in the fear zone, which means most people are not daring to make large directional bets.
Let's go through the multi-timeframe state. On the daily level, the MACD histogram is still declining, with negative values expanding to -242.30, DIF at -125.36, and DEA at 116.94, showing no obvious signs of exhaustion in the bearish momentum. RSI is at 42.27, somewhat weak but not extreme. On the 4-hour level, there is a bit of interest; the MACD histogram has turned positive, at 23.32, with DIF at -295.85 and DEA at -319.16, indicating a narrowing of the medium-term bearish momentum, suggesting a potential for recovery. However, RSI is only at 39.07, showing limited rebound strength. On the 1-hour level, the MACD histogram is at -12.49, DIF at 18.94, and DEA at 31.43, indicating that the short-term momentum is still in a declining process. On the 15-minute level, the MACD histogram is at 2.77, with RSI at 44.96, showing signs of stabilization in the short term but not strong.
Using the Qinglan TPV system to verify the signals. The core rule is that the 1-hour EMA55 acts as the boundary between bulls and bears, with the current EMA55 at 63,277.73, and the price at 63,111, which is below the moving average. Looking back at the last 8 hourly candles, the closing price was above EMA55 only once, with one crossing, indicating a bearish trend. However, the absolute distance from the EMA55 is only 0.26%, which is below the 0.3% threshold; line-bound fluctuations suggest an increased probability of sideways movement. According to the system rules, although it does not meet all the conditions for confirming sideways behavior, this line-bound state is not suitable for aggressive positioning. For shorting conditions, there have been two consecutive hourly candles with closing prices below EMA55, which is currently barely satisfied, but confirmation of support stabilizing and depletion of downward momentum still needs K-line movement to validate. The conditions for going long are even less mature, as the price hasn’t even stabilized above EMA55, so that can't be discussed. Therefore, the conclusion given by the TPV system is: direction uncertain, wait for a breakout confirmation.
We should also take a look at the on-chain and funding data. BTC market share is 56.26%, still maintaining a pattern dominated by mainstream coins. The funding rate has turned positive, indicating that short selling pressure has eased somewhat, but the market has not fully turned bullish; at most, it can be seen as a marginal recovery. Notable traders have been buying in batches between 54,000 and 64,000, having already invested 35% of their funds; indeed, there are buyers at this level. However, on the other hand, the Coldcard theft incident is still unfolding, with hackers taking away 1,367 BTC, raising concerns about self-custody safety, which may induce panic selling. The interplay of bullish and bearish factors means neither side holds an absolute advantage.
It’s essential to clearly identify the key attack and defense levels. The first resistance level above looks at the 63,278 area where the 1-hour EMA55 is located. If this level can't be held, the bulls are merely making a weak rebound. Further up, the 63,500 to 63,700 range is a densely compressed area of the 4-hour MA30 and daily MA5; a breakout above 63,700 would open up rebound space. For support below, we first look at the densely traded area from 62,800 to 63,000; a breakout below 62,800 would lead us to the 62,000 round number, where there is a liquidation cluster. A drop below 62,000 will trigger the liquidation of 330 million long positions, which could lead to a chain reaction. Alternatively, if the price breaks above 65,000, it will trigger the liquidation of 478 million short positions, so 65,000 is a medium-term dividing line for bulls and bears.
As for trading strategies, I provide plans in two directions, but the core principle is don't chase after line-bound movements; wait for confirmation before acting. For the short direction, if there are two consecutive hourly candles with closing prices stabilizing below EMA55, and a rebound into the 63,200 to 63,300 range shows long upper shadows or top patterns, with the MACD histogram shortening for two consecutive periods, one can try shorting with a light position, placing a stop-loss above 63,650, targeting 62,500 for the first goal, and 62,000 for the second goal. For the long direction, we need to wait for the price to stand back above EMA55, meaning consecutive hourly candles would need to close above 63,278, while also showing bottom patterns or long lower shadows for stabilization signals, with the MACD histogram increasing above the zero line again; then one could enter a long position, placing a stop-loss below 62,800, targeting 64,000 for the first goal, and 65,000 for the second. If the price continues to consolidate in a low-volume sideways pattern between 62,800 and 63,300, then it’s best to stay out and wait for the market to decide the direction.
Risk warning in a nutshell: line-bound fluctuations can lead to false breakouts at any time; be strict with stop-losses and do not hold onto positions.
Follow Qinglan Crypto Classroom for more trading opportunities! Welcome to visit the official website www.qinglan.org
📊 Qinglan TPV trading strategy backtest reference
🕒 Last backtest time 08-02 07:00:01
Total analysis: 3352 Backtests: 3348 Accuracy: 82% (2747/3348)
免责声明:本文章仅代表作者个人观点,不代表本平台的立场和观点。本文章仅供信息分享,不构成对任何人的任何投资建议。用户与作者之间的任何争议,与本平台无关。如网页中刊载的文章或图片涉及侵权,请提供相关的权利证明和身份证明发送邮件到support@aicoin.com,本平台相关工作人员将会进行核查。