This round of rapid collapse in the Korean stock market has made many traditional retail investors, used to "holding on until death," experience the fear of being forcibly liquidated by the system. Many people's principal not only dropped to zero instantly, but they also owe large sums to financial institutions.
What exactly is "liquidation"? Why, after adding leverage, does a small drop in the market lead to the total evaporation of funds?
Today, let's take advantage of this hot topic to systematically break down for beginners and advanced players: in the crypto space, how does liquidation actually happen? How to understand the liquidation data in the market?
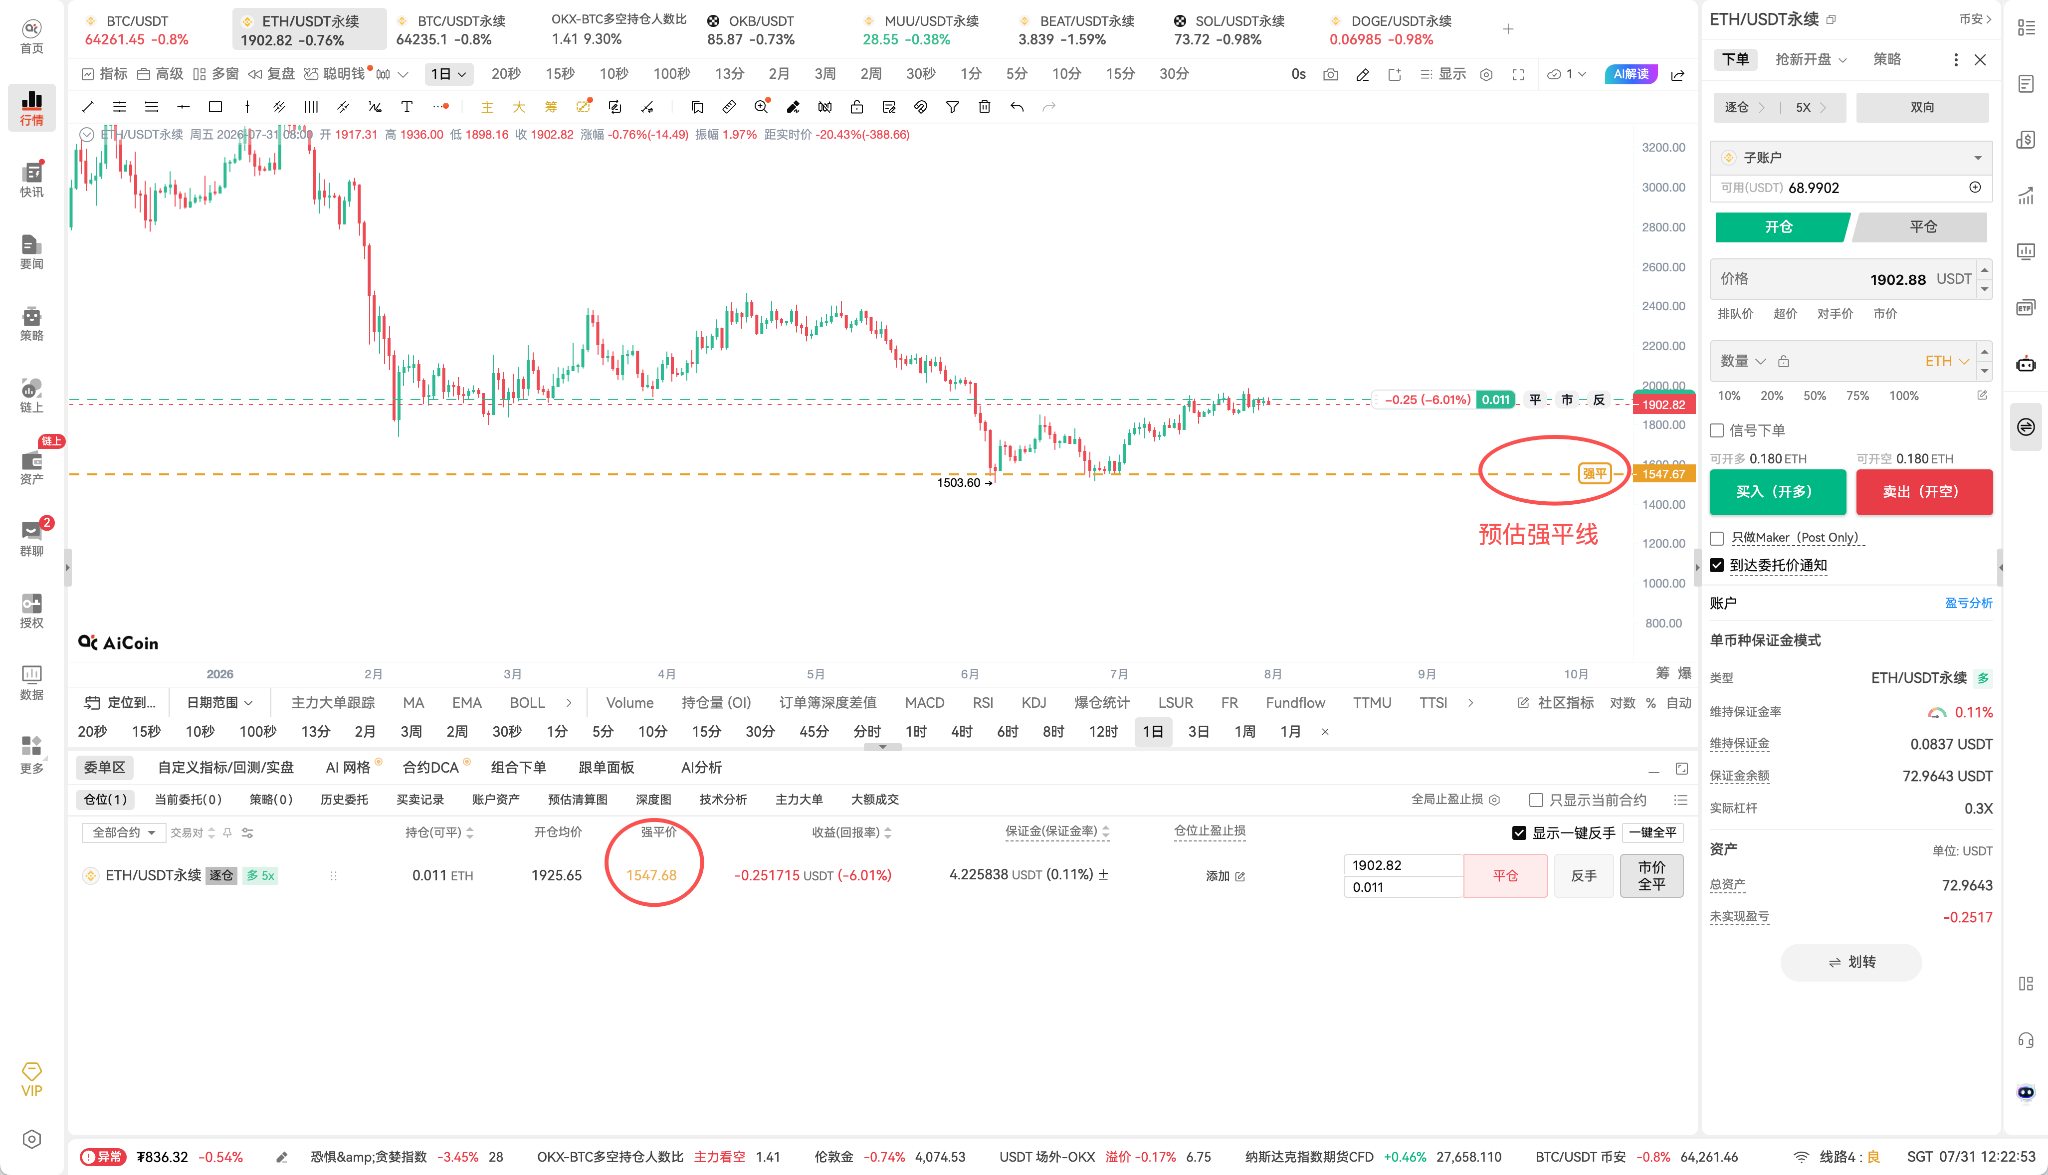
What is liquidation?
In one sentence: liquidation occurs when you borrow money to trade stocks/cryptocurrencies/futures, and when the market moves against you, and your losses reach the margin limit, the exchange's liquidation system forcibly takes over and sells your position to prevent your account from going into debt.
To avoid liquidation, you must understand these three core indicators in your trading software:
1. Margin: Your own capital invested when entering the market, serving as collateral to bear losses.
2. Leverage: The ratio of borrowed funds. 10x leverage means you control $100,000 in assets with a $10,000 principal.
3. Maintenance Margin: The "minimum safety line" stipulated by the broker or exchange. If your total asset value minus borrowing falls below this ratio, the system will issue a warning, requiring you to "add margin" (Margin Call). If you do not supplement the funds, the system will forcefully liquidate.
The mathematical trap of liquidation: The higher the leverage, the smaller the fluctuation space it can withstand:
- 2x leverage: If the underlying asset drops 50%, the principal goes to zero.
- 5x leverage: If the underlying asset drops 20%, the principal goes to zero.
- 10x leverage: The underlying asset only needs to drop 10%, and the principal instantly goes to zero.
Negative feedback loop (death spiral): Leveraged ETFs and brokers' force liquidation systems are all automated executions. The exchange selling large amounts of forced liquidation orders acts as a market catalyst, instantly breaking through the next price level, triggering more people's liquidation lines, leading to a "contagious liquidation."
Three unique liquidation analysis tools in the crypto market
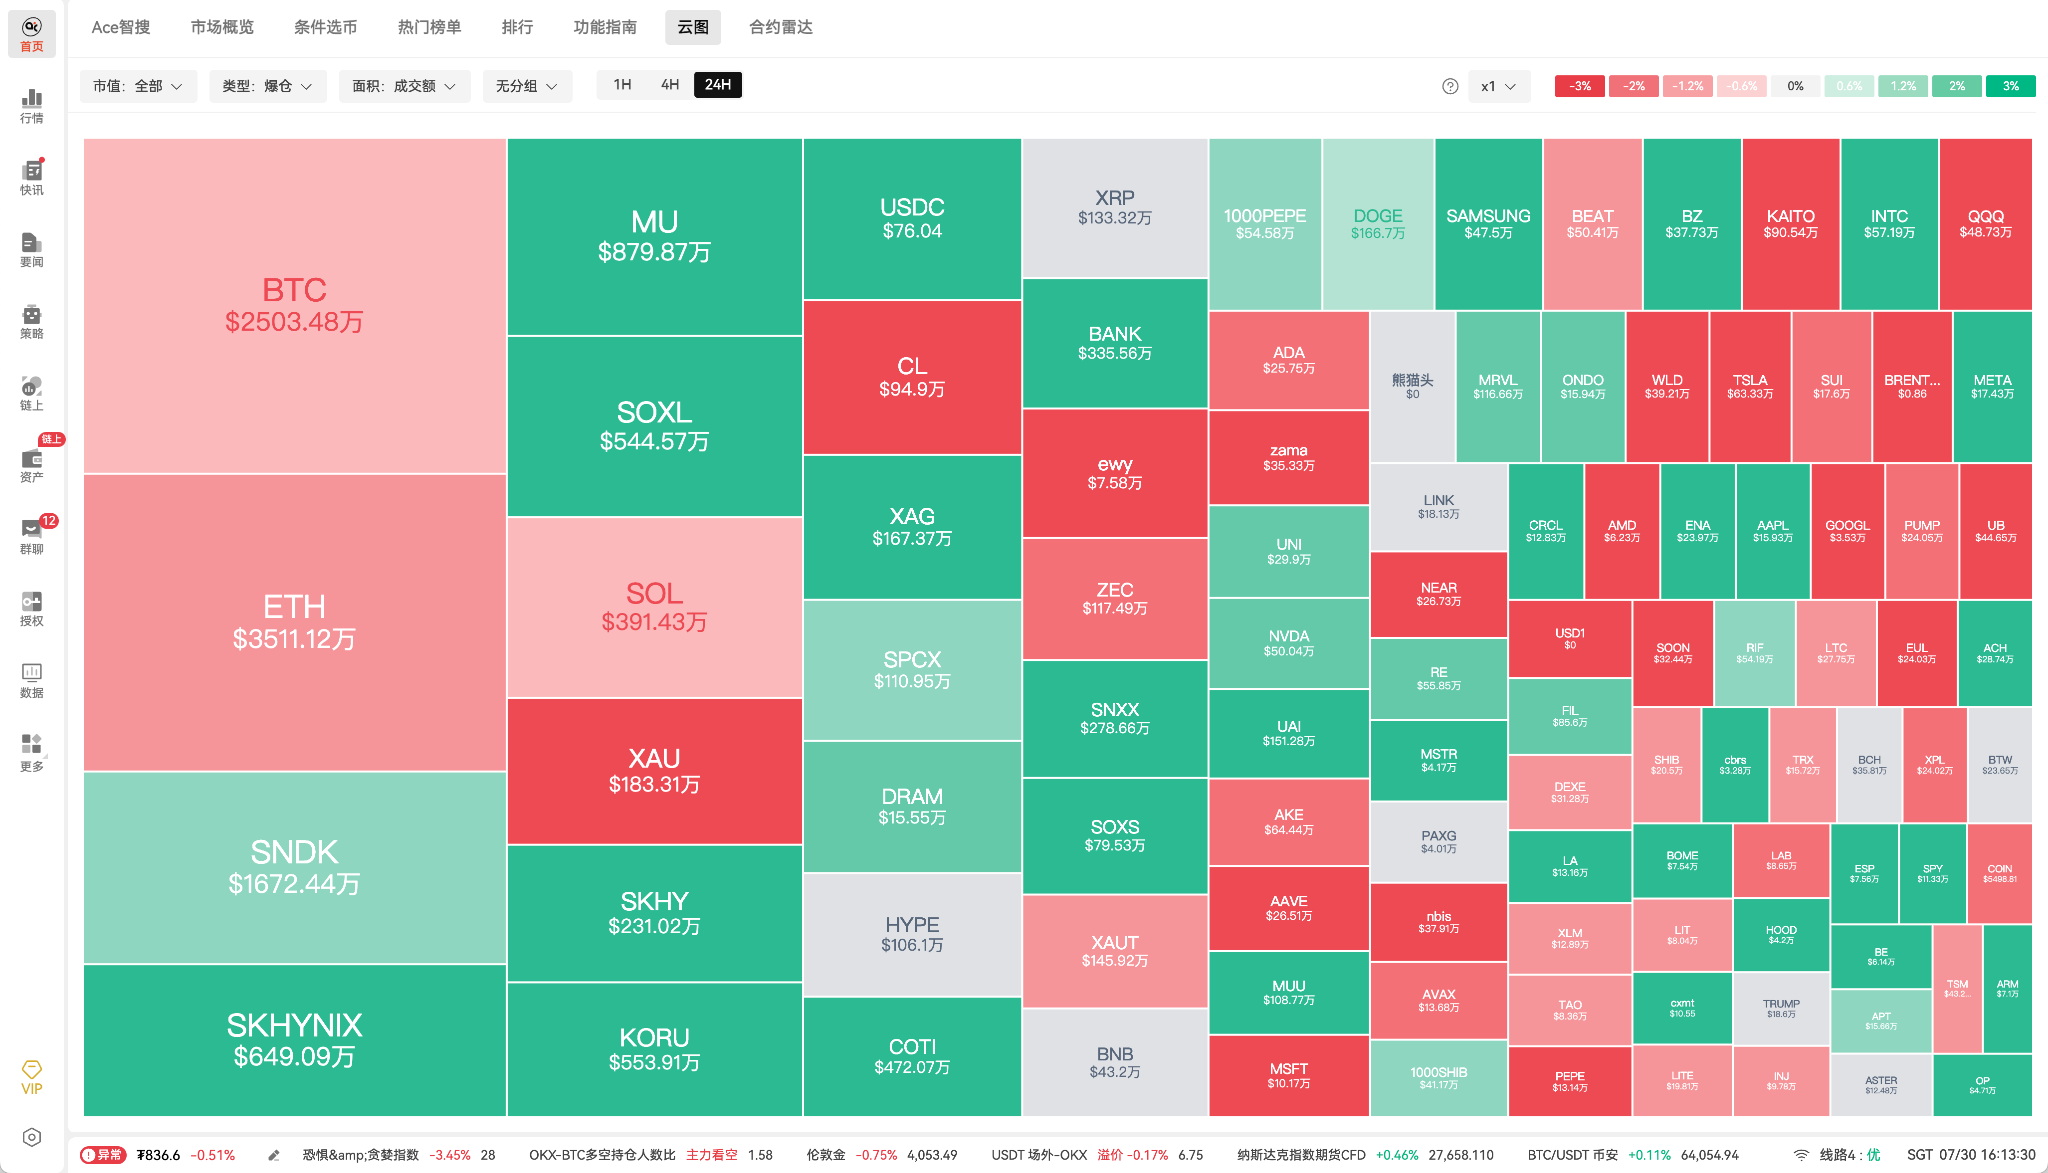
In the crypto space, liquidation is not only an individual risk but also the ultimate signal of a capital battle across the network. Major players and high-frequency trading institutions love to utilize the forced liquidation points of retail investors to seek liquidity (hunting stop losses/liquidation points).
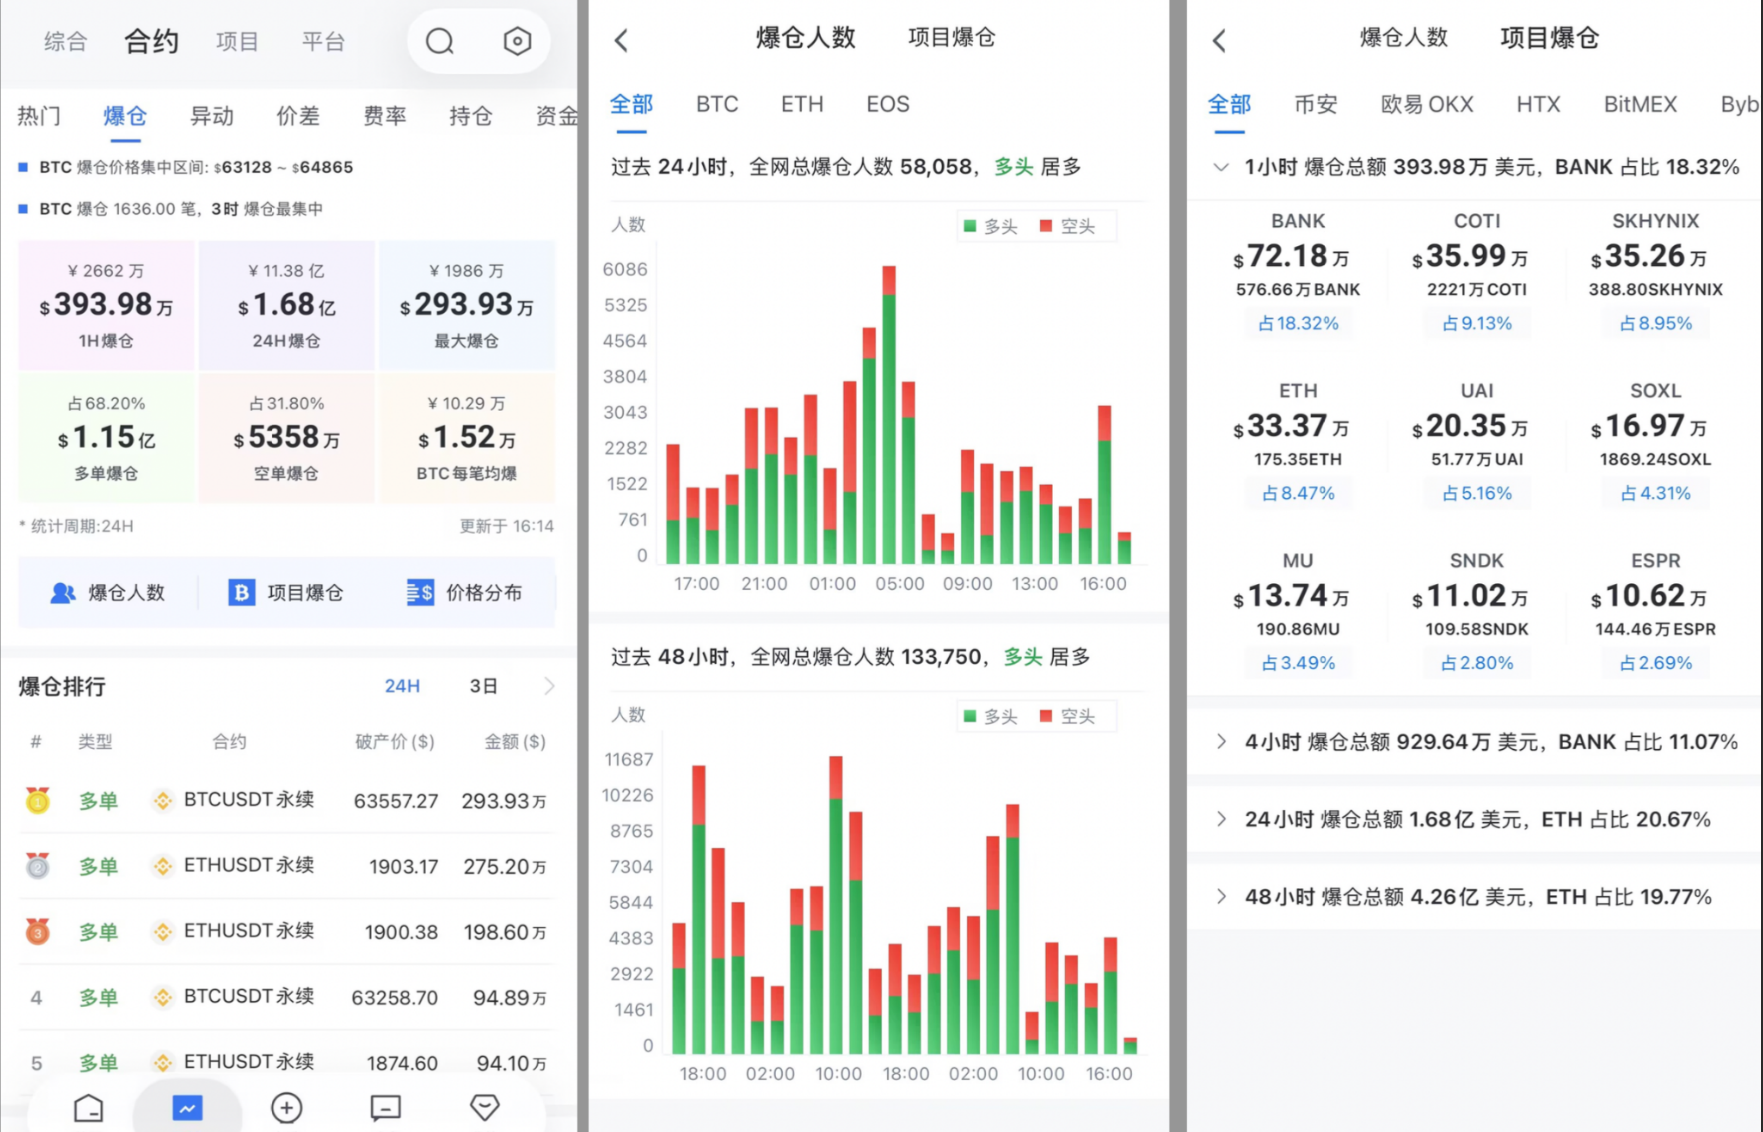
1. Global liquidation data
Liquidation data records the total amount forcibly liquidated across the network within a specific time period (such as the past hour or 24 hours), the ratio of long to short positions, and the largest single liquidation order.
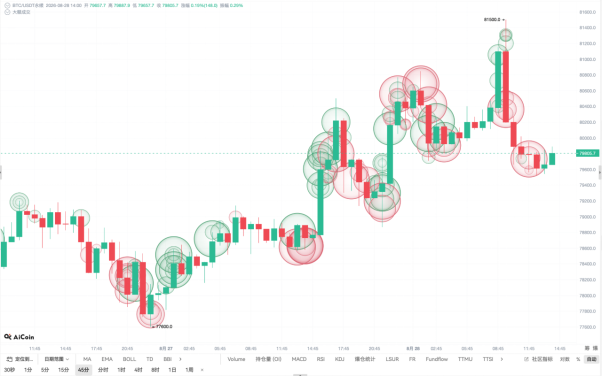
2. Estimated liquidation chart
The estimated liquidation chart is based on deep data analysis, predicting the potential liquidation amounts (liquidation volume) of various cryptocurrency contracts over a specific time period. It shows potential liquidation (liquidation) activities at different price levels, helping traders identify market trends and potential risks.
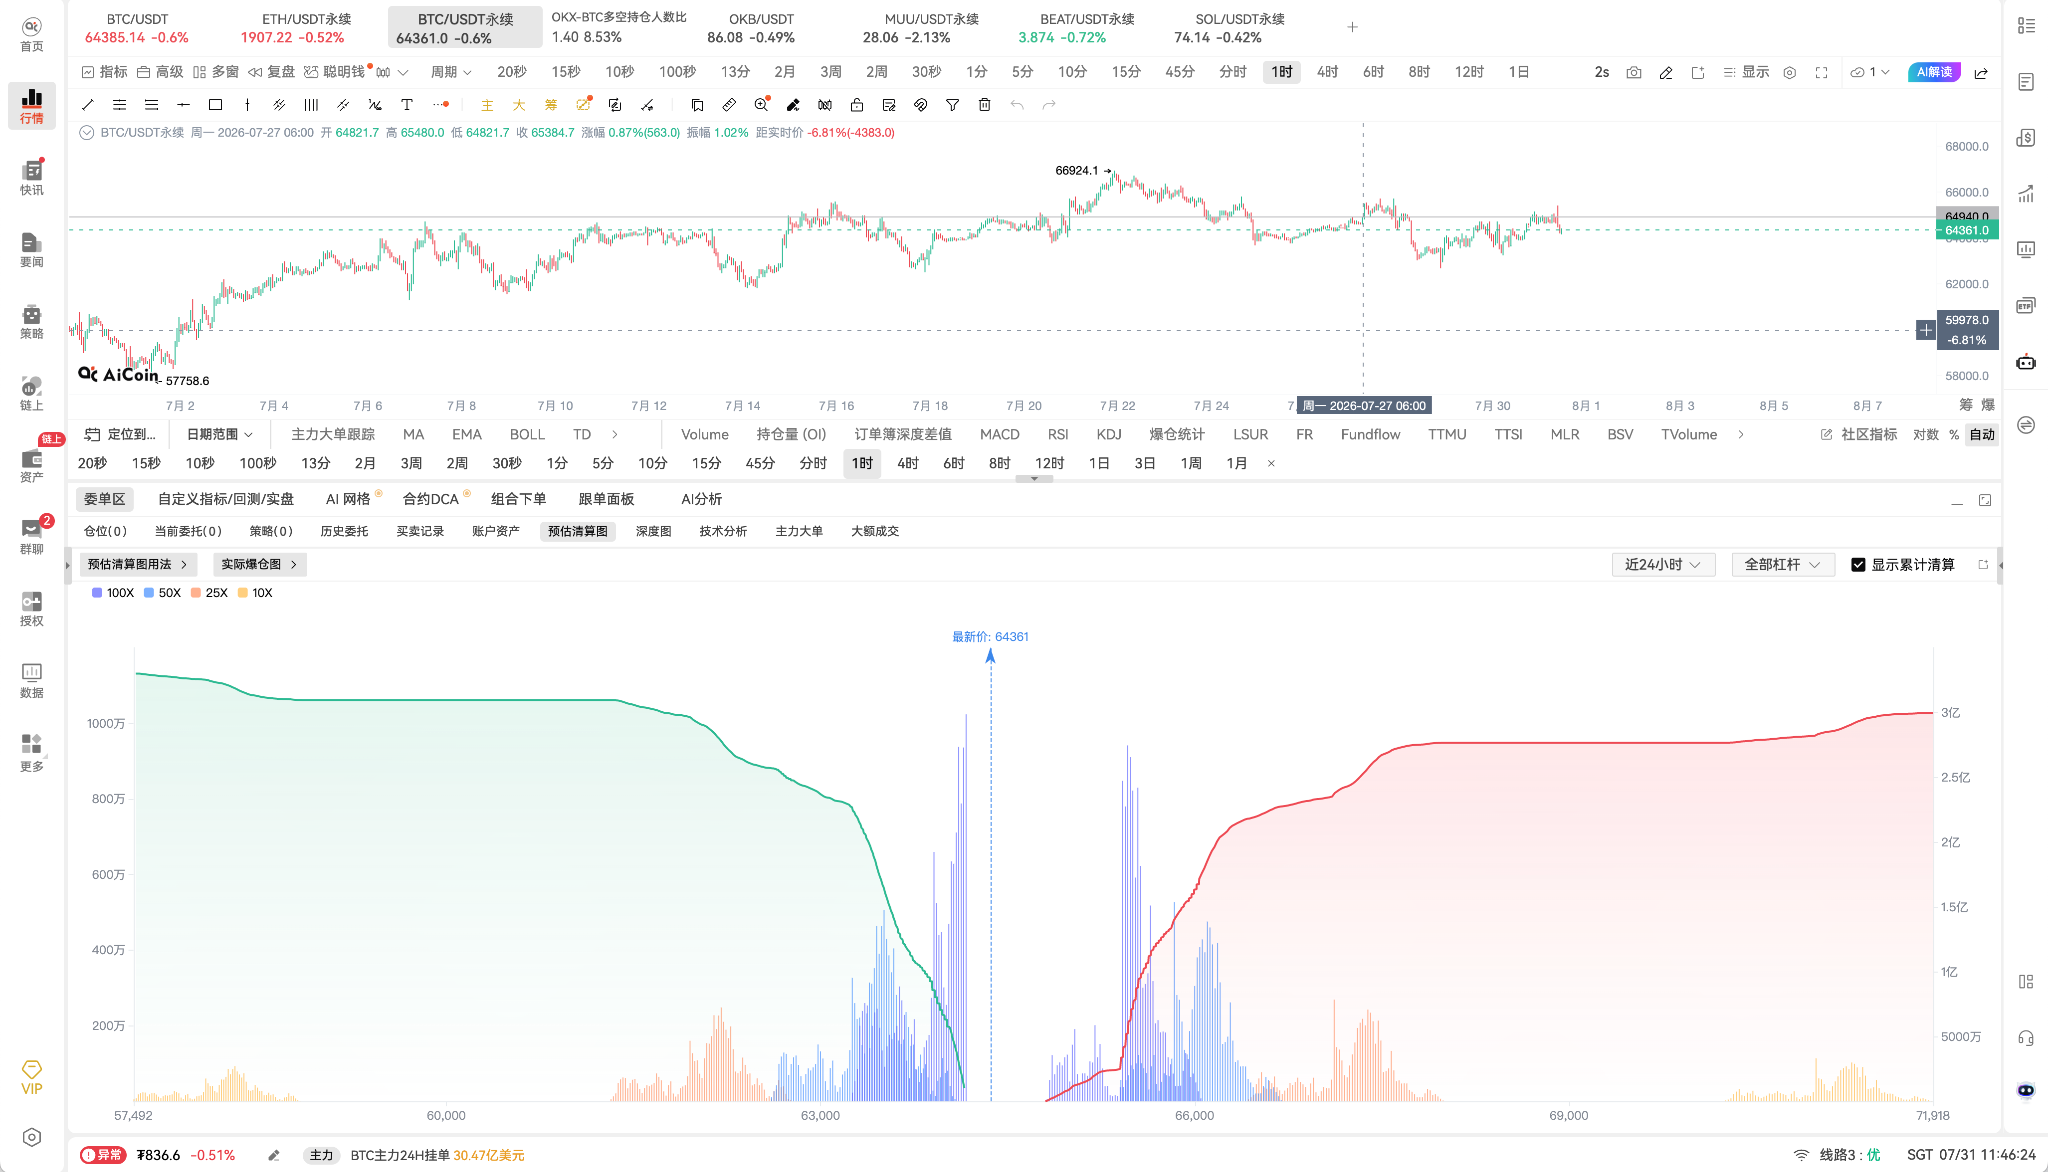
Green/red lines: Represent the estimated amount of capital for long or short positions likely to be forcibly liquidated within that price range.
If, within the same price deviation range, the predicted long liquidation volume is much greater than the short liquidation, it indicates that most of the market players are going long. According to the "80/20" principle, choosing a minority faction has a higher potential profit.
For specific usage recommendations, please read
Estimated liquidation chart—predicted liquidation volumes at different price levels, forecasting market volatility - AiCoin
https://www.aicoin.com/article/375042.html
3. Estimated liquidation heatmap
The liquidation heatmap is the most commonly used "global overview" for crypto derivatives traders. It combines price ranges with time and uses various shades of color to show the evolution of liquidation density.
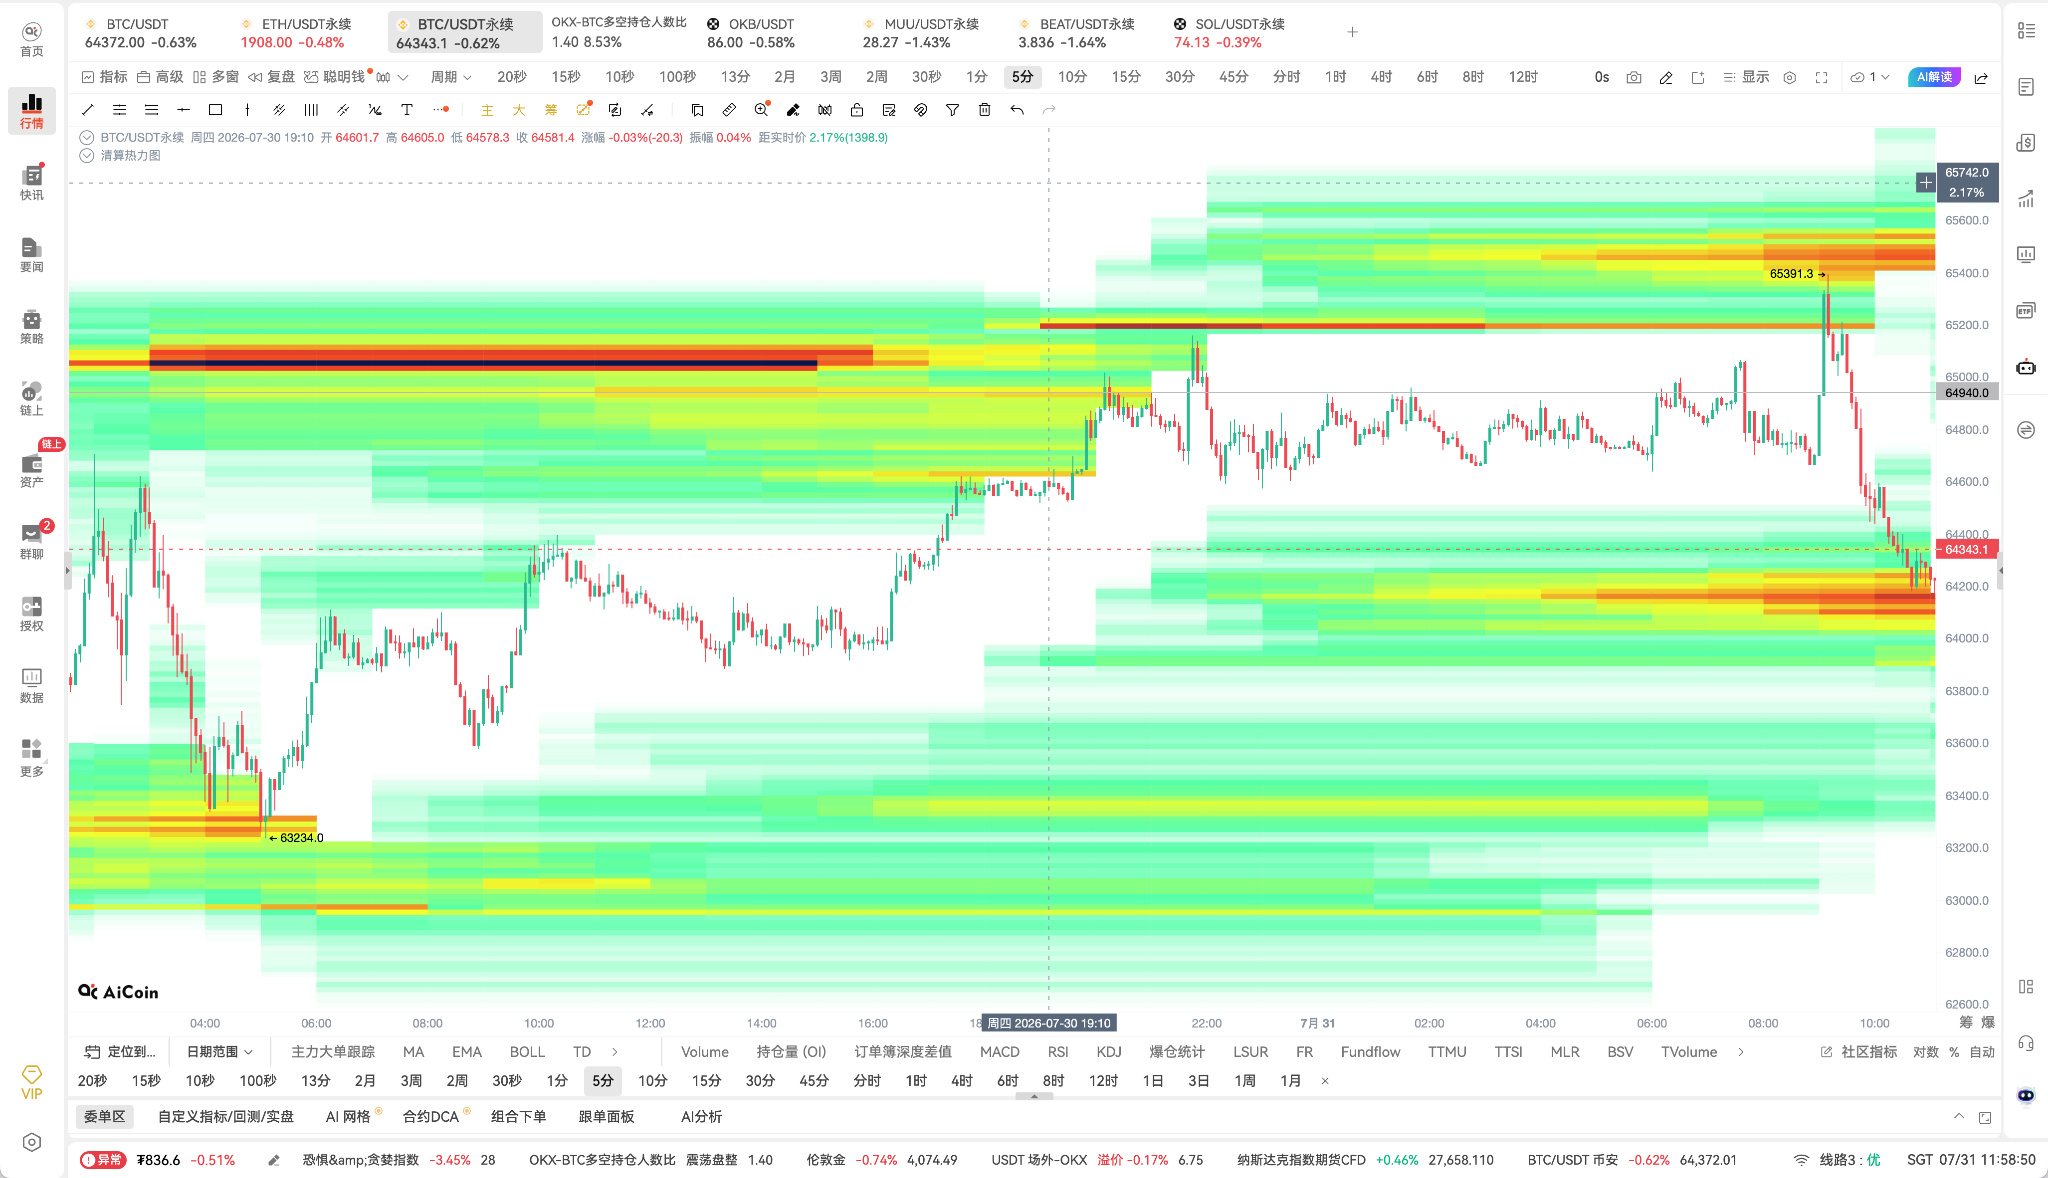
Legend explanation:
- Dark areas (black, purple, red): The darker the color, the larger the estimated potential liquidation volume at that price level, indicating a high concentration of market liquidity.
- Light areas: Indicate fewer leveraged positions near that price, with low liquidation intensity.
Liquidation is both the grave for retail investors and the "liquidity hunting ground" for institutions and technical traders.
If you are involved in margin trading, leveraged ETFs, or contract trading, please strictly adhere to the following three life-saving rules:
1. Strictly set stop-loss lines
Do not hand over the decision to close positions to the system. Set a stop-loss point before entering (for example, if you lose 5% or 10%, you must exit unconditionally). Manual stop-loss, although painful, preserves your capital for future trades; being forcefully liquidated means losing even the option to choose.
2. Use liquidation data to avoid "hunting zones"
Before opening a position, take a glance at the heatmap. If your stop-loss point or liquidation line happens to fall in a densely dark liquidation area, decisively adjust your stop-loss position. This is because major players often take advantage of the momentum to "clear liquidations," pushing you out of the market before moving to the expected trend.
3. Abandon high leverage
Reducing leverage (such as 2x-3x) can greatly widen your liquidation line, allowing you to survive against extreme black swan price spikes of 10%-20%.
The most dangerous thought in the market is "this time it's different; I can get rich overnight through leverage." The fundamental rule of capital markets remains unchanged — leverage amplifies gains while also accelerating the speed of destruction at the same ratio.
Risk warning: The views mentioned in this article are for technical analysis learning and reference only and do not constitute any investment advice. Cryptographic assets carry high risk, trading based on this is at your own risk.
Join our community, let’s discuss and become stronger together!
Official Telegram community:
AiCoin Chinese Twitter:
Group chat - Wealth Group:
https://www.aicoin.com/link/chat?cid=10013
免责声明:本文章仅代表作者个人观点,不代表本平台的立场和观点。本文章仅供信息分享,不构成对任何人的任何投资建议。用户与作者之间的任何争议,与本平台无关。如网页中刊载的文章或图片涉及侵权,请提供相关的权利证明和身份证明发送邮件到support@aicoin.com,本平台相关工作人员将会进行核查。