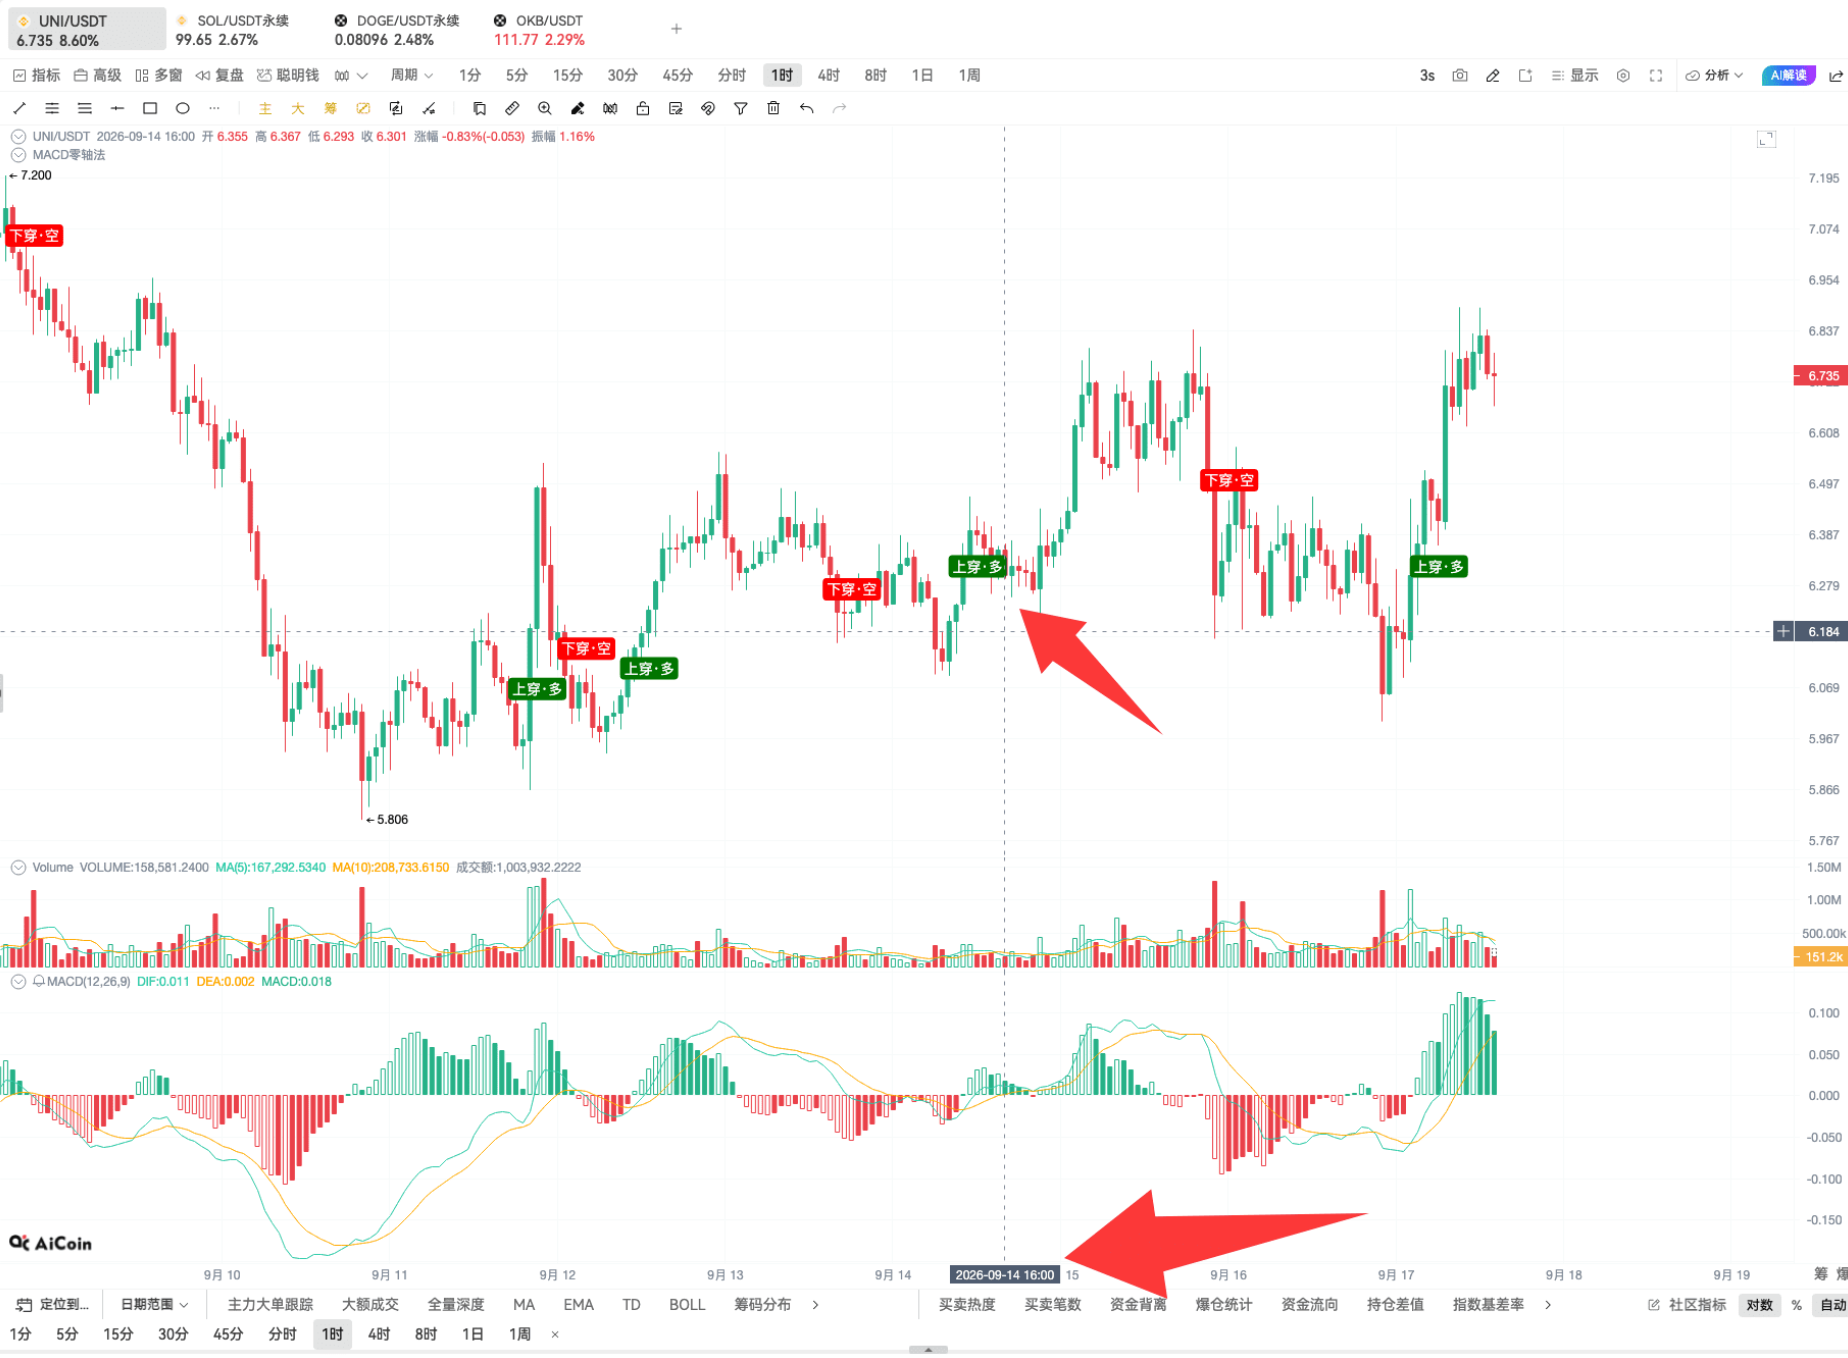
In the cryptocurrency market, price fluctuations are the norm. Many investors encounter a problem: during market oscillations, it is difficult to ascertain the correct direction, but frequently chasing highs and lows easily leads to emotional influences.
Grid trading is an automated trading strategy designed for such market environments. It does not rely on predicting that the market will definitely go up or down, but instead sets price ranges in advance, dividing the market into multiple "small grids", utilizing the continuous price fluctuations to execute "buy low, sell high" and earn the price differences generated by each oscillation.
Simply put: Price drops to a certain level → Automatically buy; Price rises to a higher level → Automatically sell; Repeated oscillation → Continuously capture profits.
However, grids are not a guaranteed profit strategy. The core lies in: choosing the suitable market conditions, setting reasonable ranges and grid parameters, and performing well in risk control.
1. The Basic Principle of Grid Trading: Making Profit from Fluctuations
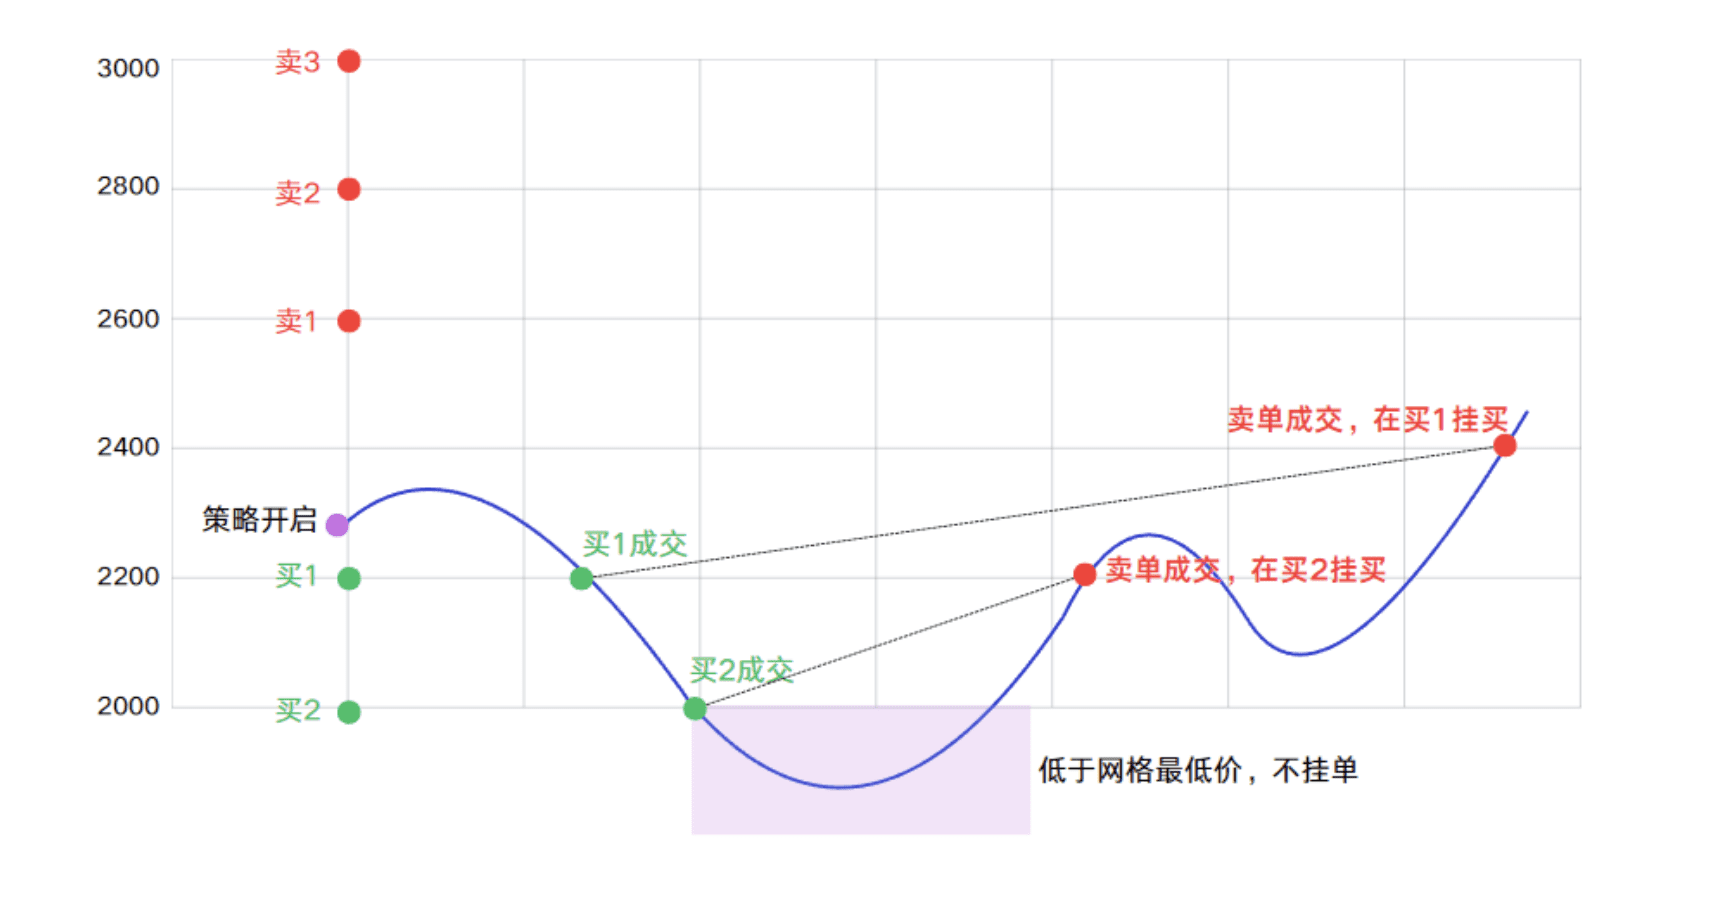
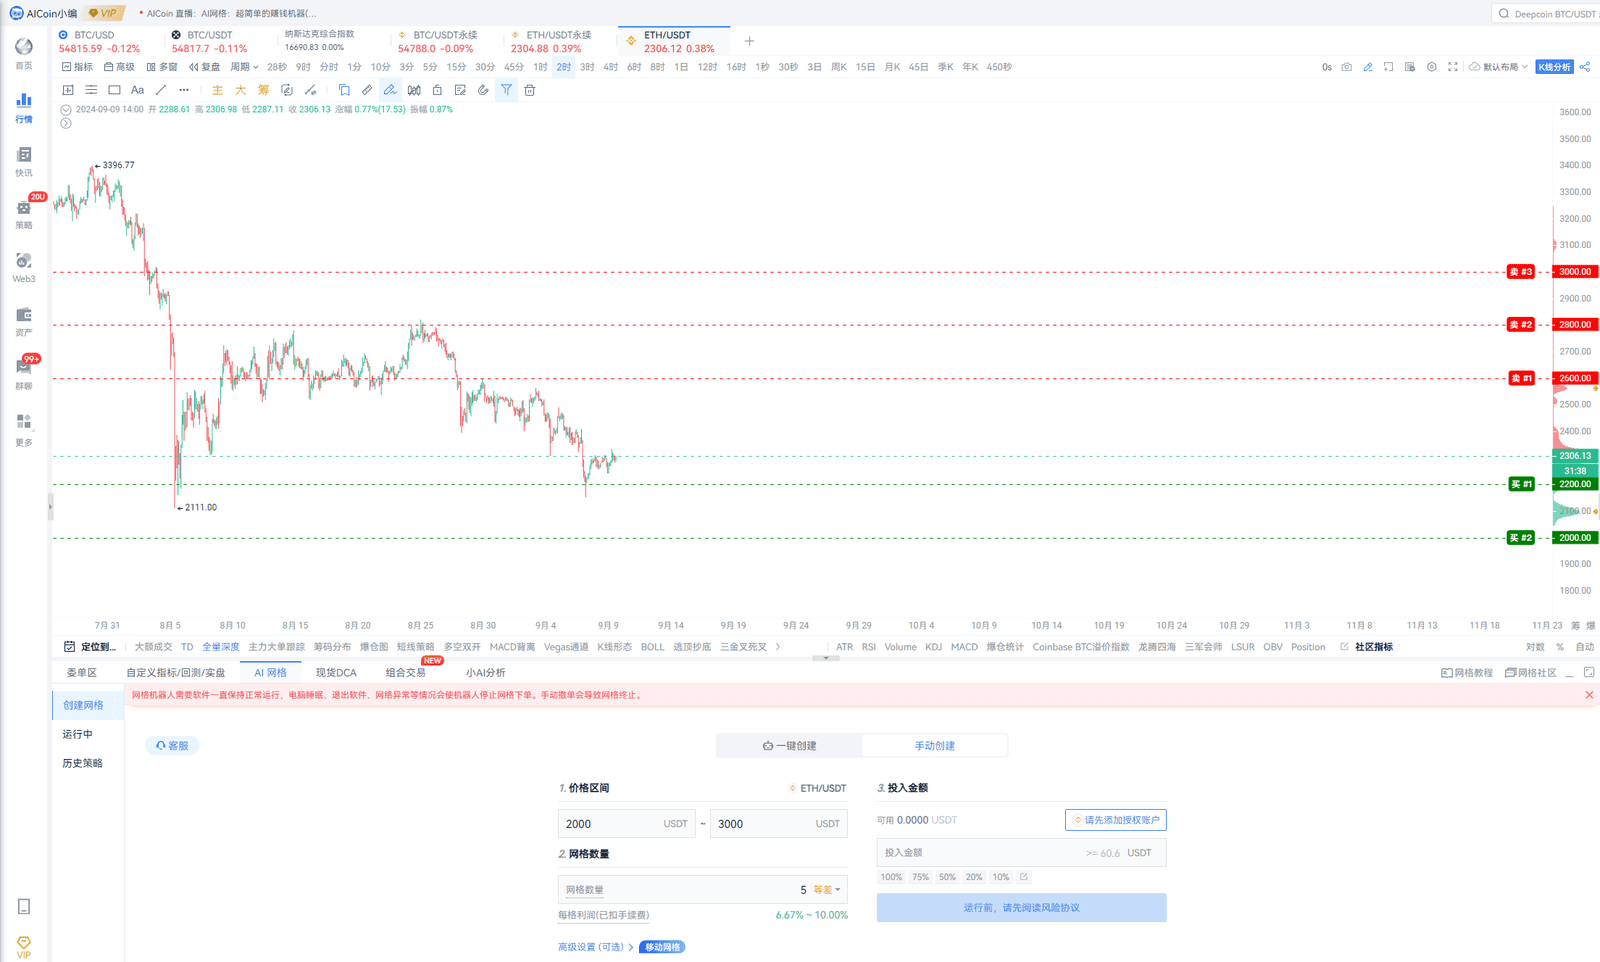
The core logic of grid trading is to divide a price range into multiple trading nodes and then arrange buy and sell orders at different price positions in advance. For example: if the current ETH price is 2306 USDT, and the investor predicts that ETH may oscillate between 2000 and 3000 USDT in the near future. Therefore, the settings can be:
- Lowest grid price: 2000 USDT
- Highest grid price: 3000 USDT
Next, this price range of 1000 USDT is divided into multiple grids. Assuming 5 grids are set:
(3000-2000) ÷ 5 = 200 USDT
Then the price nodes are: 2000 → 2200 → 2400 → 2600 → 2800 → 3000
The system will automatically place trading orders based on these prices:
When ETH drops from 2306 USDT to 2200 USDT, a buy is triggered; then when the price rises to 2400 USDT, a sell is triggered; completing one instance: Buy low → Sell high → Obtain a grid profit.
If the price continues to oscillate within the range, the system will keep repeating the trades.
Therefore, the profit from grid trading does not come from a one-sided upward market, but rather from the opportunities created by repeated market fluctuations.
2. How to Determine if Grid Trading Should be Initiated?
The most important prerequisite for grid trading is to determine whether there is oscillation space in the market.
If the market is in a long-term sideways oscillation, with price continuously fluctuating up and down, grids can frequently trigger trades; but if the market enters a one-sided upward or downward trend, the effectiveness of the grid may decrease. Usually, the following types of market conditions are more suitable for initiating grids:
1. Oscillation Phase After a Significant Rise or Fall
After the market undergoes a rapid rise or fall, it often enters a stage of reorganization.
For example: if the price of a certain coin rapidly rises from 100 USDT to 150 USDT, followed by several days of oscillation between 140 and 150 USDT. In this phase:
- There is resistance above
- There is support below
- The price fluctuates repeatedly
This is a typical grid operation environment.
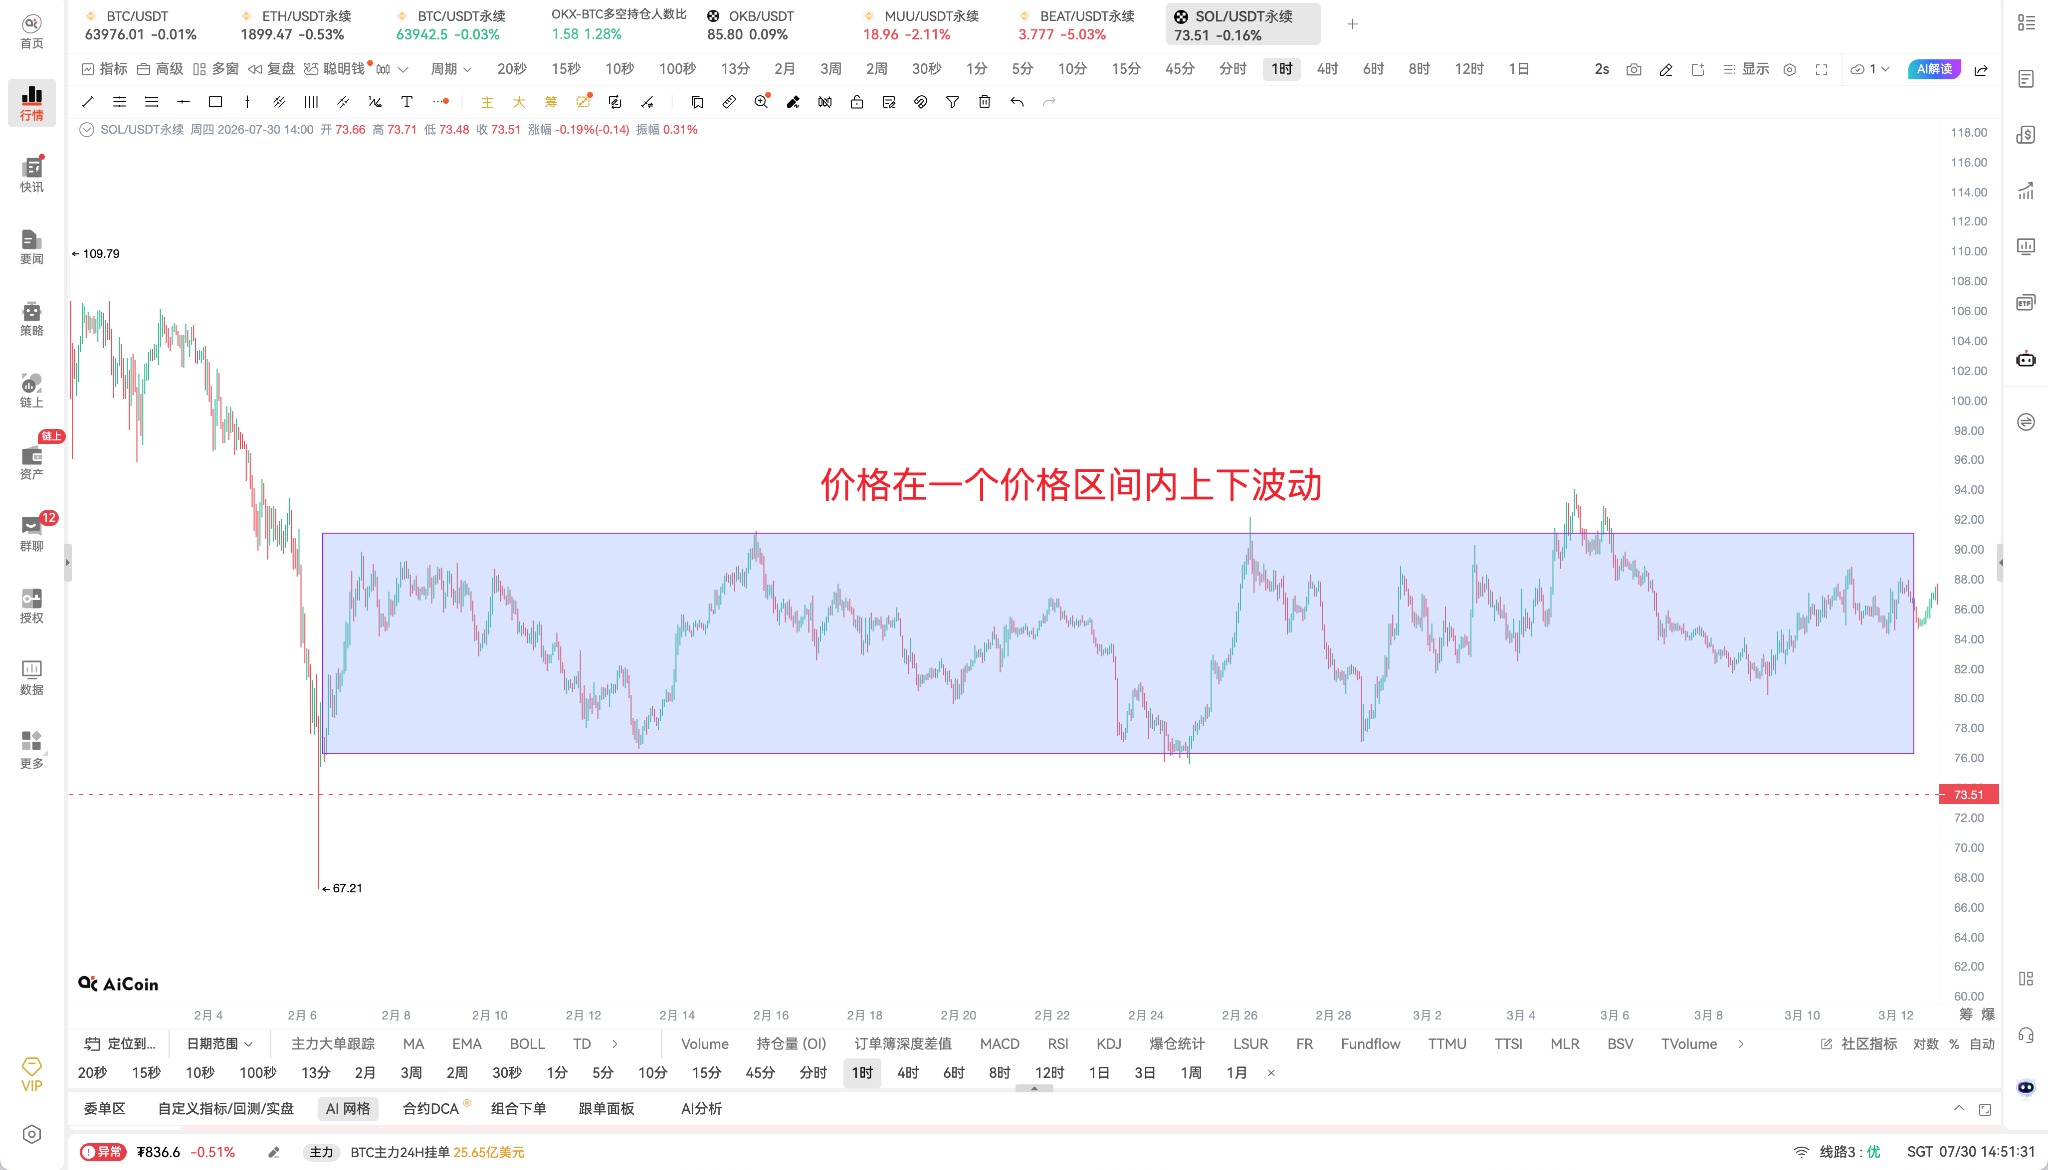
2. Price Operating in a Fixed Range for a Long Time
If observing candlesticks reveals:
- Repeatedly rising to a certain level then retreating
- Repeatedly falling to a certain level then bouncing
- The highs and lows are relatively regular
This indicates that the market has a clear oscillation range.
For example: If SOL runs multiple times between 75 and 95 dollars in a week, then around 75 can be considered the lower limit of the grid, and around 95 can be considered the upper limit of the grid.
3. Avoid Overusing in Strong Trend Markets
If the market is in a clear one-sided upward trend, for example: BTC continuously breaking new highs, with prices continually rising.
At this time, a typical grid might:
- Continuously sell rising assets
- Miss out on subsequent rise profits
If the market is in a one-sided downward trend, it may:
- Continuously buy falling assets
- Result in a large amount of capital being tied up
Therefore, grids are more suited for "oscillating markets" rather than blindly following trends.
3. How to Set Reasonable Grid Parameters?
When creating a grid strategy, the primary settings needed are:
- Grid Range
- Number of Grids
- Invested Capital
- Leverage (Contract Grid)
Among these, the most critical are: Grid range and number of grids.
1. How to Set the Number of Grids?
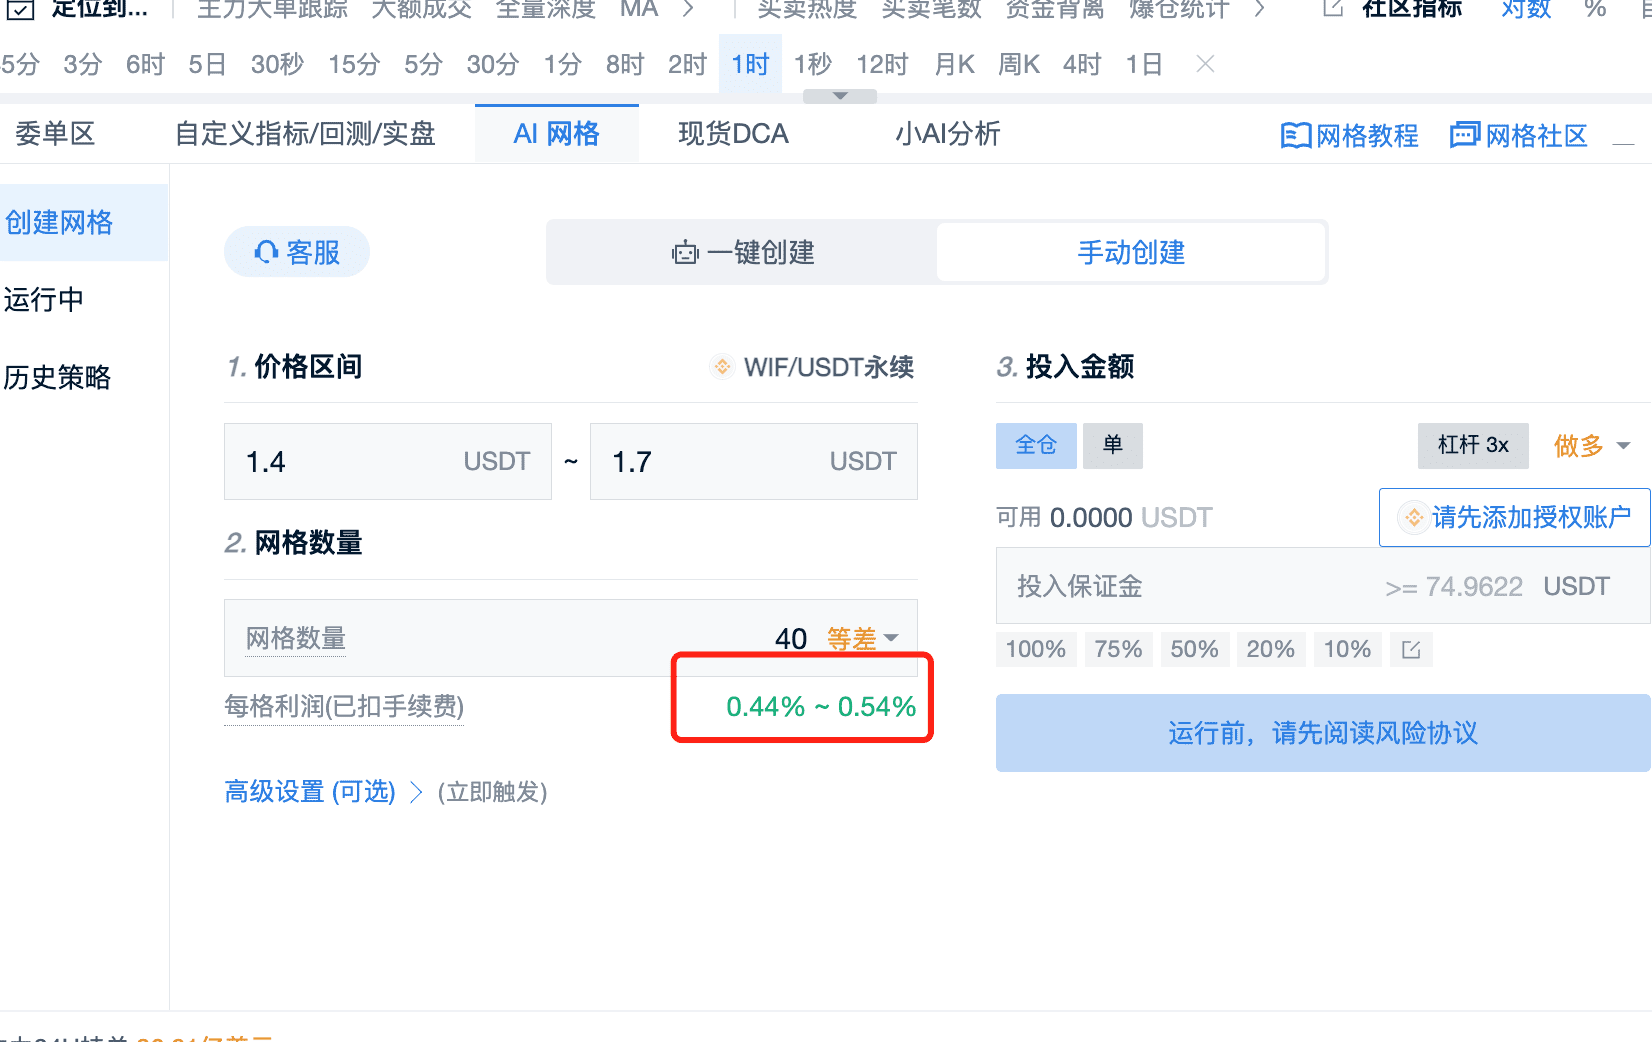
The number of grids determines the trading frequency and individual trade profit. Generally, it is reasonable to control the profit of each grid at around 0.2% to 0.5%. If the profit per grid is too low, it indicates that there are too many sub-grids, and your money may be entirely tied up in pending orders. There may be several grids that have bought in, but the price is falling, thus those grids are stuck. But care should also be taken not to have too few grids, with only two or three grids, the price cannot fall multiple times. Profit can only be made when the price falls back.
2. How to Allocate Invested Capital?
Grid trading essentially involves building positions in batches, so do not invest all funds at once.
If the price continues to drop, multiple buy grids may be executed simultaneously, so enough funds must be reserved.
3. How to Set Leverage for Contract Grid?
Contract grids introduce leverage factors. Although leverage can enhance capital utilization, it also increases liquidation risk.
Recommendations:
- Avoid using excessively high leverage (it is best to keep it below 3 times)
- Maintain sufficient margin
- Set stop-loss prices
The grid strategy relies on profits gained from long-term oscillation, and high leverage may lead to strategy failure due to an extreme market situation.
4. How to Determine a Reasonable Grid Range?
The grid range determines the operating range of the strategy.
If the range is too narrow: it is prone to frequent breaches, leading to trading ceasing.
If the range is too wide: capital utilization decreases, resulting in fewer trading opportunities.
Common determination methods are as follows:
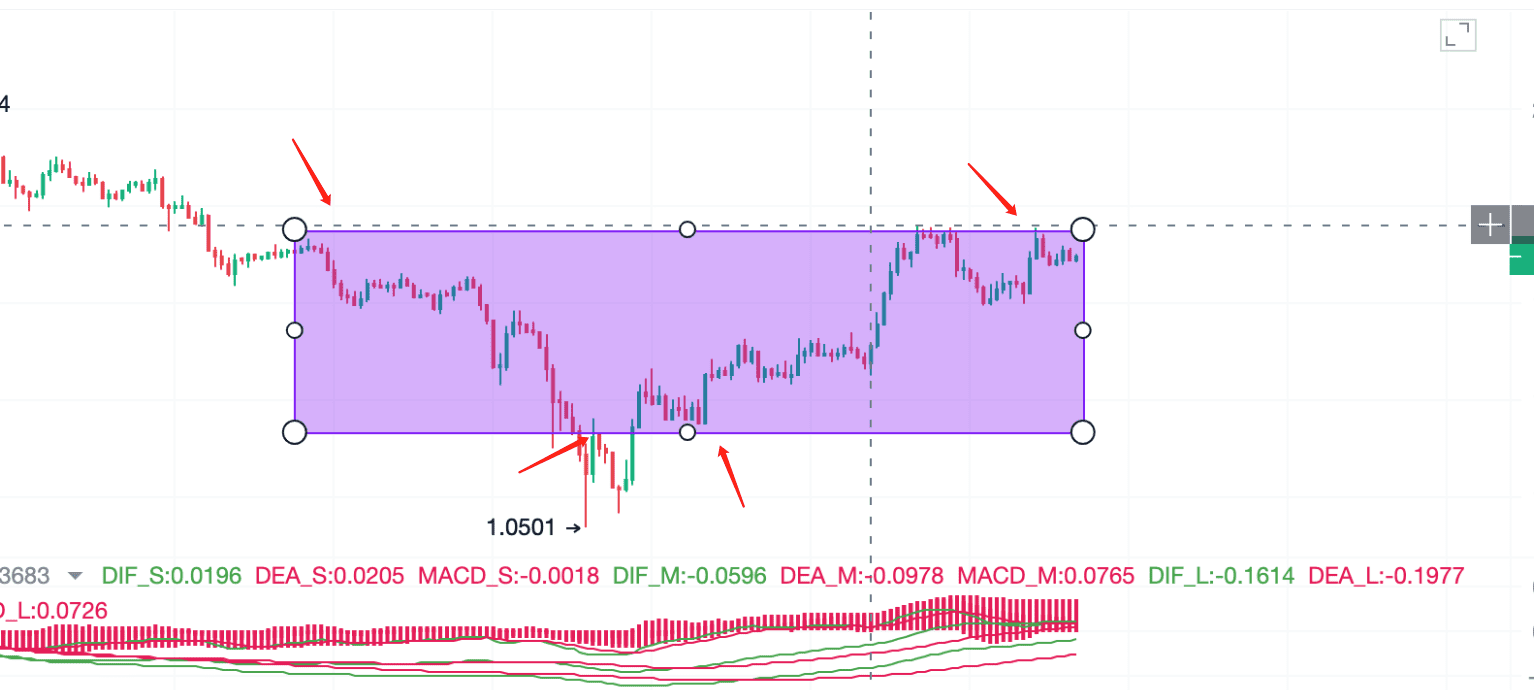
Method 1: Use Support and Resistance to Determine the Range
Support level: a position where buying support can easily be obtained when the price declines.
Resistance level: a position where selling pressure is easily encountered when the price rises.
For example: BTC has bounced near 60000 USD multiple times; retreated near 65000 USD.
Thus: 60000 to 65000 USD could be considered an oscillation range.
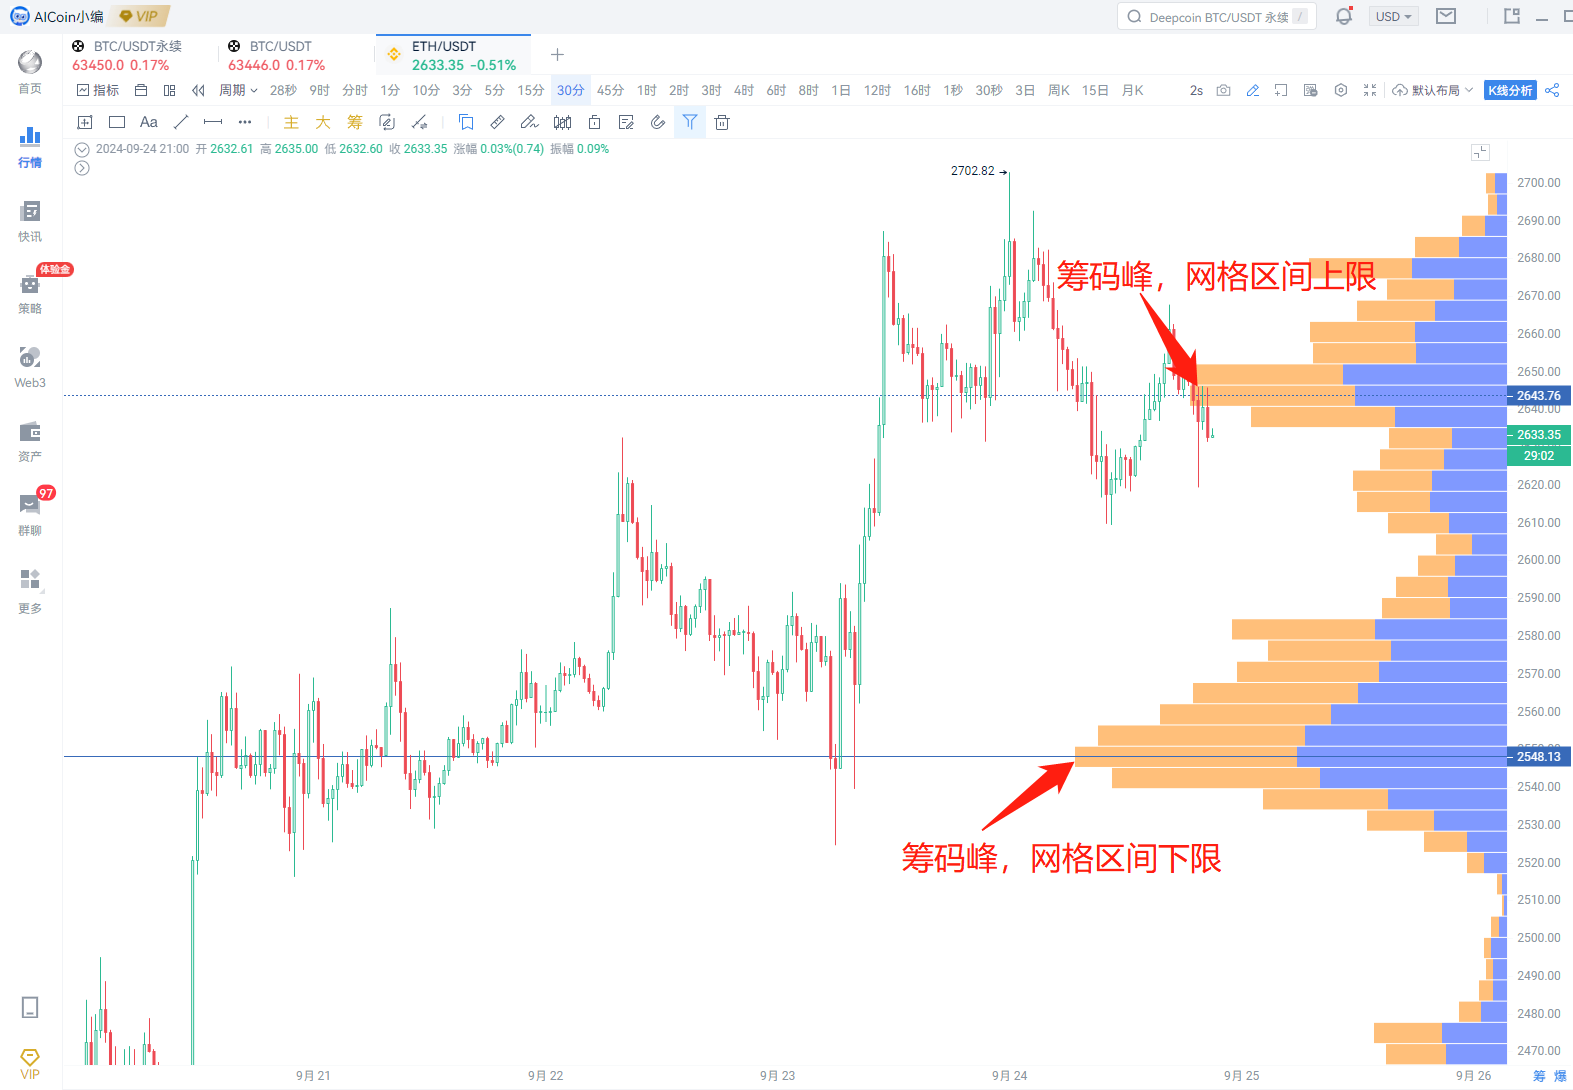
Method 2: Reference Chip Distribution
Areas with dense chips often represent a large number of investors' holding costs. If there is a large amount of chips near a certain price:
It may form support or resistance. The position of the chip peak can help determine the grid's upper and lower boundaries.
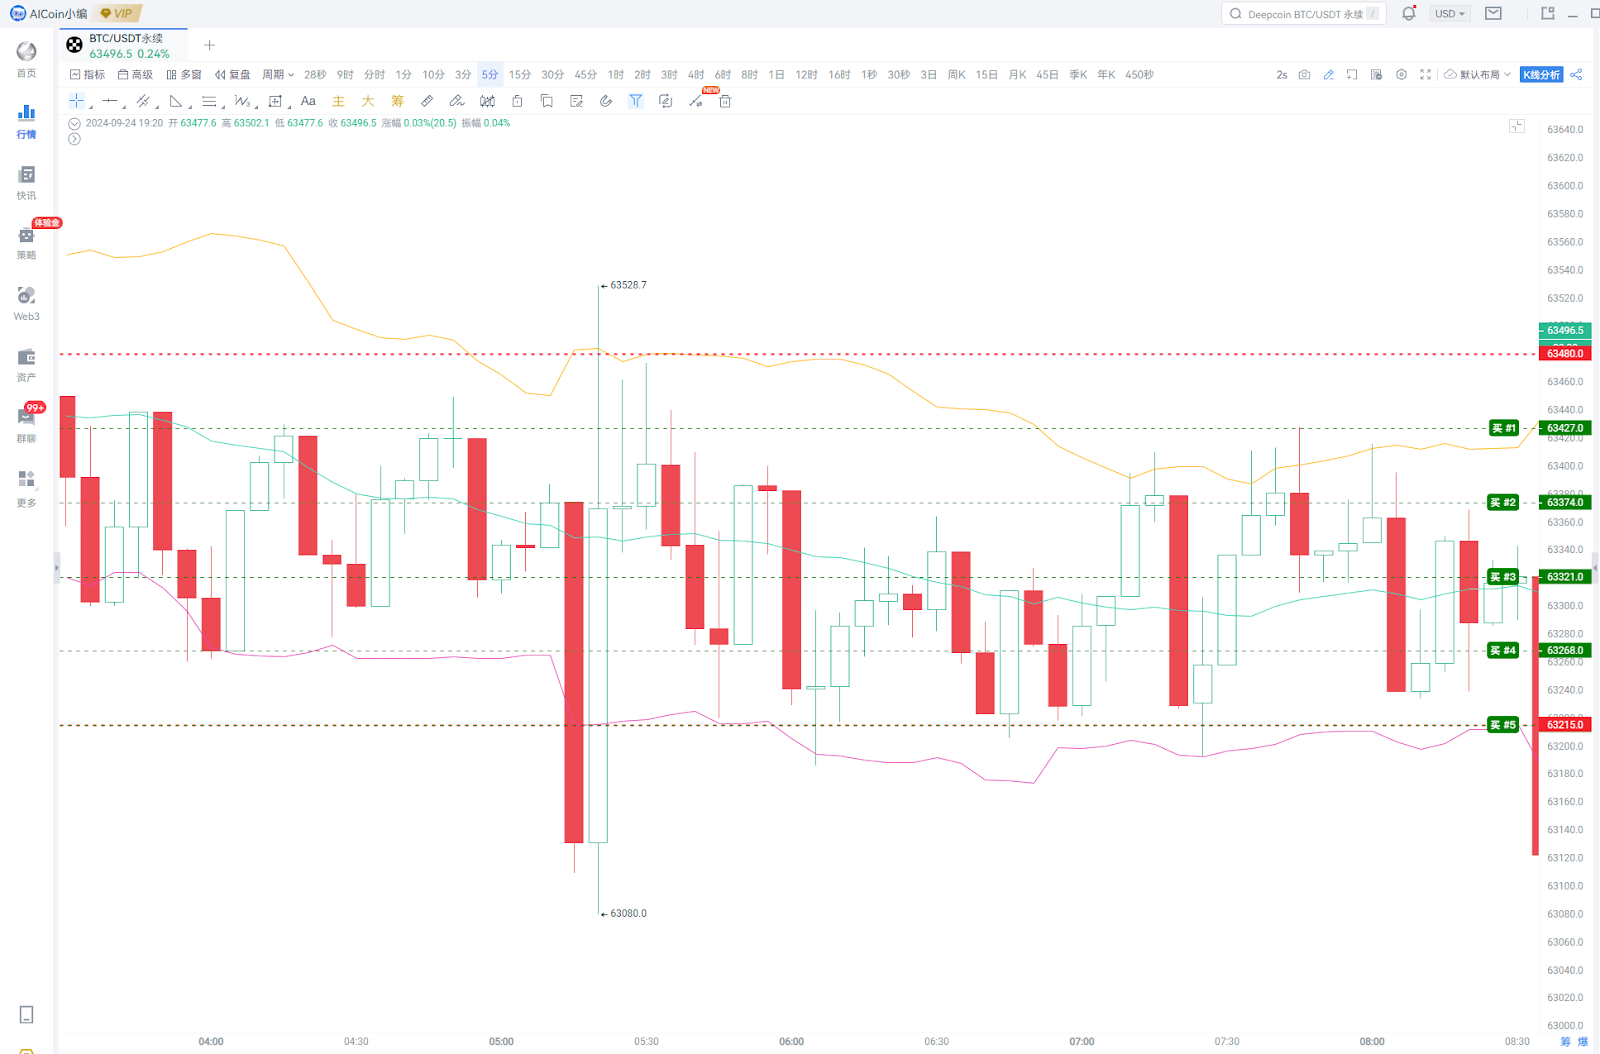
Method 3: Use Bollinger Bands (BOLL)
Bollinger Bands can reflect the price fluctuation range. When the price runs for a long time between the upper and lower bands: it indicates that the market volatility is relatively stable.
You can refer to: the upper band as the grid upper limit; the lower band as the grid lower limit.
Method 4: Reference Historical Fluctuation Ranges
Observe the past:
- One week
- One month
- Three months
The highest and lowest price points. If the price cannot break through for a long time: it can serve as a reference range for the grid.
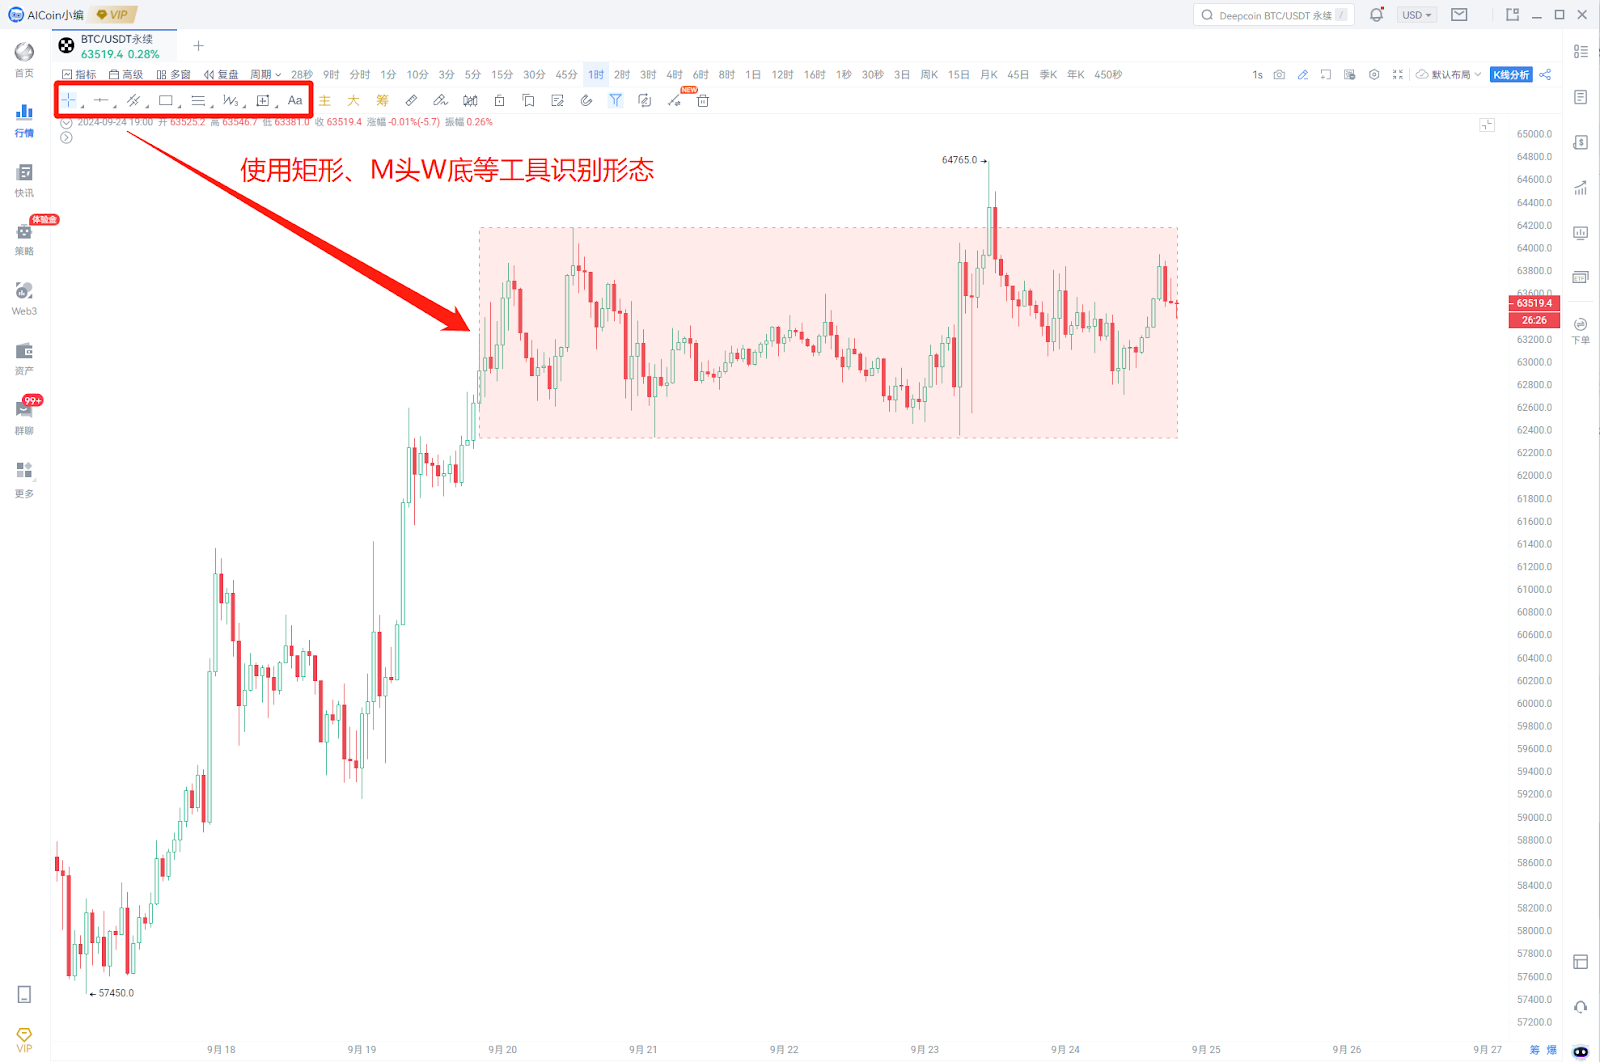
Method 5: Combine with Candlestick Patterns
For example:
- Box oscillation
- Double bottom
- Head and shoulders pattern
The highs and lows in these patterns can serve as references for the grid range.
5. What is a Moving Grid? Why is it Needed?
The biggest limitation of ordinary grids is: the strategy may stop trading once the price breaks out of the set range.
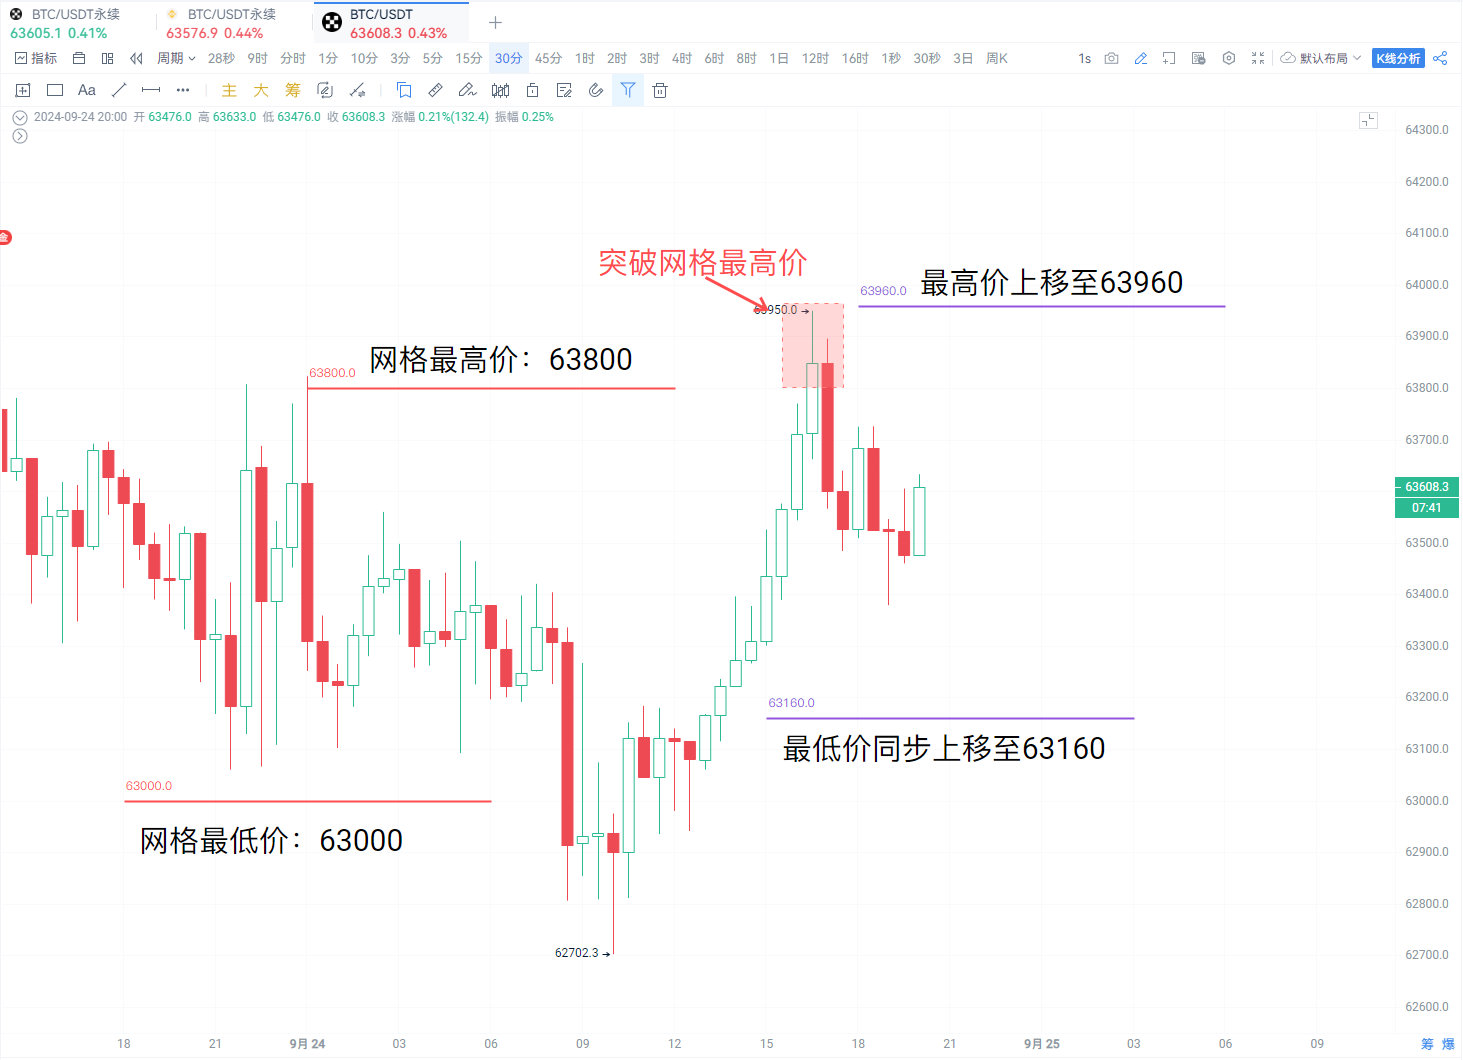
For example, if ETH sets a grid of 2000 to 3000 USDT. If ETH suddenly rises to 3200 USDT: the price has exceeded the upper limit of the grid, and the ordinary grid cannot continue operating.
The moving grid is designed to solve this problem.
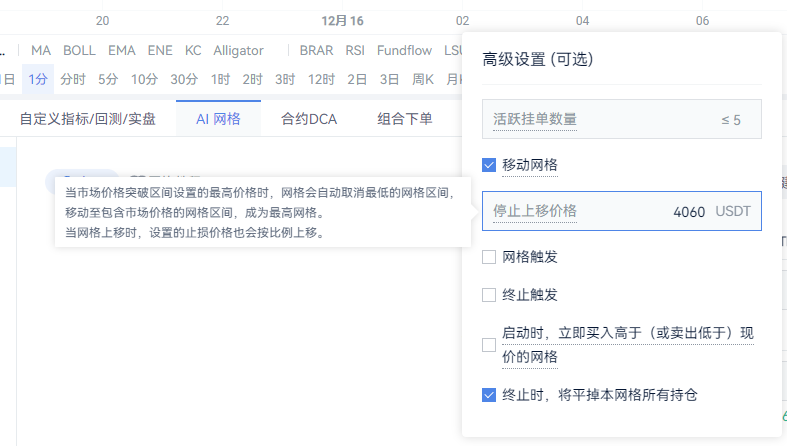
The Operating Logic of Moving Grids
When the price breaks through the original grid range: the system will automatically adjust the position of the grid, allowing it to follow the market.
For instance: original range: 63000 to 63800 USDT, BTC rises and breaks 63800: the moving grid will cancel the lower area grid and move the overall range upwards to 63160 to 63960 USDT, allowing the strategy to continue operating.
Similarly: if the price continues to fall, the moving grid can also adjust the range accordingly.
Summary: The Core of Grid Trading is not Prediction, but Managing Volatility
Grid trading is essentially a "oscillation arbitrage strategy".
It works through: assessing market conditions → setting reasonable ranges → adjusting grid numbers → executing trades automatically → dynamically managing risks
To form a complete trading loop. For beginners, the most important aspect of using grids is not to pursue maximum returns, but rather:
1. Choose mainstream currencies with good liquidity;
2. Avoid overusing in extreme one-sided markets;
3. Set reasonable grid ranges and numbers;
4. Combine stop-losses and moving grids to control risks.
When the market lacks a clear direction, grid trading can help investors reduce the pressure of monitoring, capturing price fluctuation opportunities with a standardized strategy. If you want to further understand the specific operation of AI grids, you can continue reading the following tutorials to gradually build your own grid trading system.
Recommended Reading:
AiCoin has launched a powerful oscillation earning tool - AI Grid on the PC side - AiCoin
https://www.aicoin.com/article/360449.html
免责声明:本文章仅代表作者个人观点,不代表本平台的立场和观点。本文章仅供信息分享,不构成对任何人的任何投资建议。用户与作者之间的任何争议,与本平台无关。如网页中刊载的文章或图片涉及侵权,请提供相关的权利证明和身份证明发送邮件到support@aicoin.com,本平台相关工作人员将会进行核查。