The original text comes fromBlockworks Research
Translation / Odaily Planet Daily Golem(@web 3_golem)

Summary of Key Points:
- The current price of Bitcoin has dropped 50% from its historical high, and the bear market has persisted for over 40 weeks. A series of long-term cycle indicators suggest that the market may be at or near a price and time cycle low;
- This month, Bitcoin reached a historically unprecedented oversold level against the Nasdaq index, and in February of this year, it also reached a historic oversold level against gold. Data close to these extreme levels typically heralds the emergence of long-term cycle lows and suggests that Bitcoin will perform exceptionally over the next 1-3 years and yield positive returns;
- The actual price of Bitcoin (i.e., the total on-chain cost of the circulating Bitcoin supply) is currently $53,000, which is 18% lower than the spot price. Historically, every bear market low has seen Bitcoin prices below the actual price, with Bitcoin prices historically only being below the actual price 12% of the time. Starting from this point, Bitcoin has historically provided considerable returns within a 1-3 year time frame;
- Historical bear market cycles typically bottom around the 60th week after historical highs, indicating that this bear market cycle low might occur at the end of November 2026;
- Overall, the convergence of various factors currently indicates that the period from now until December 2026 may represent an extremely attractive long-term opportunity to accumulate Bitcoin.
Diminishing Returns and the Necessity of Conditional Investing
Since March 2021, the price of Bitcoin has remained stable; since November 2017, Bitcoin’s performance against the Nasdaq index has also remained stable, spanning nearly nine years. From the current time perspective, Bitcoin’s performance relative to stock indices has been quite stable, while its volatility is significantly higher than that of stock indices. When adjusted for risk, Bitcoin's performance lags behind stock indices.
This context is crucial for how to hold Bitcoin. As Bitcoin's price rises and falls, its marginal returns will diminish. The passive, always long strategies that have continuously brought returns to holders in past cycles now seem to be losing efficacy. Therefore, to achieve excess returns, it increasingly becomes necessary to seize opportunities to appropriately increase or decrease Bitcoin holdings.
To identify these opportunity windows, the indicators proposed in this article are based on conditional signals that have been "silent" for most of history, with the strongest signals appearing at the tail end and occurring only a few times per decade.
Currently, these signals have appeared simultaneously and all point to the same conclusion: Bitcoin may be at or near a long-term cycle price low.
Indicator One: Nasdaq/Bitcoin Relative Strength Signals
The first signal is based on the ratio of the Nasdaq 100 index to Bitcoin, calculated from the weekly closing prices over the past 875 cycles. We calculate the 14-period relative strength index (RSI) for this ratio and smooth it using a 14-period simple moving average.
An increase in the RSI indicates that the Nasdaq index is overbought relative to Bitcoin, while a decrease indicates the opposite. This indicator is not an intraday trading technical indicator; it represents the 14-week momentum indicator’s 14-week moving average, with transitions between overbought and oversold states occurring over multi-year market cycles, not just a few days or weeks.
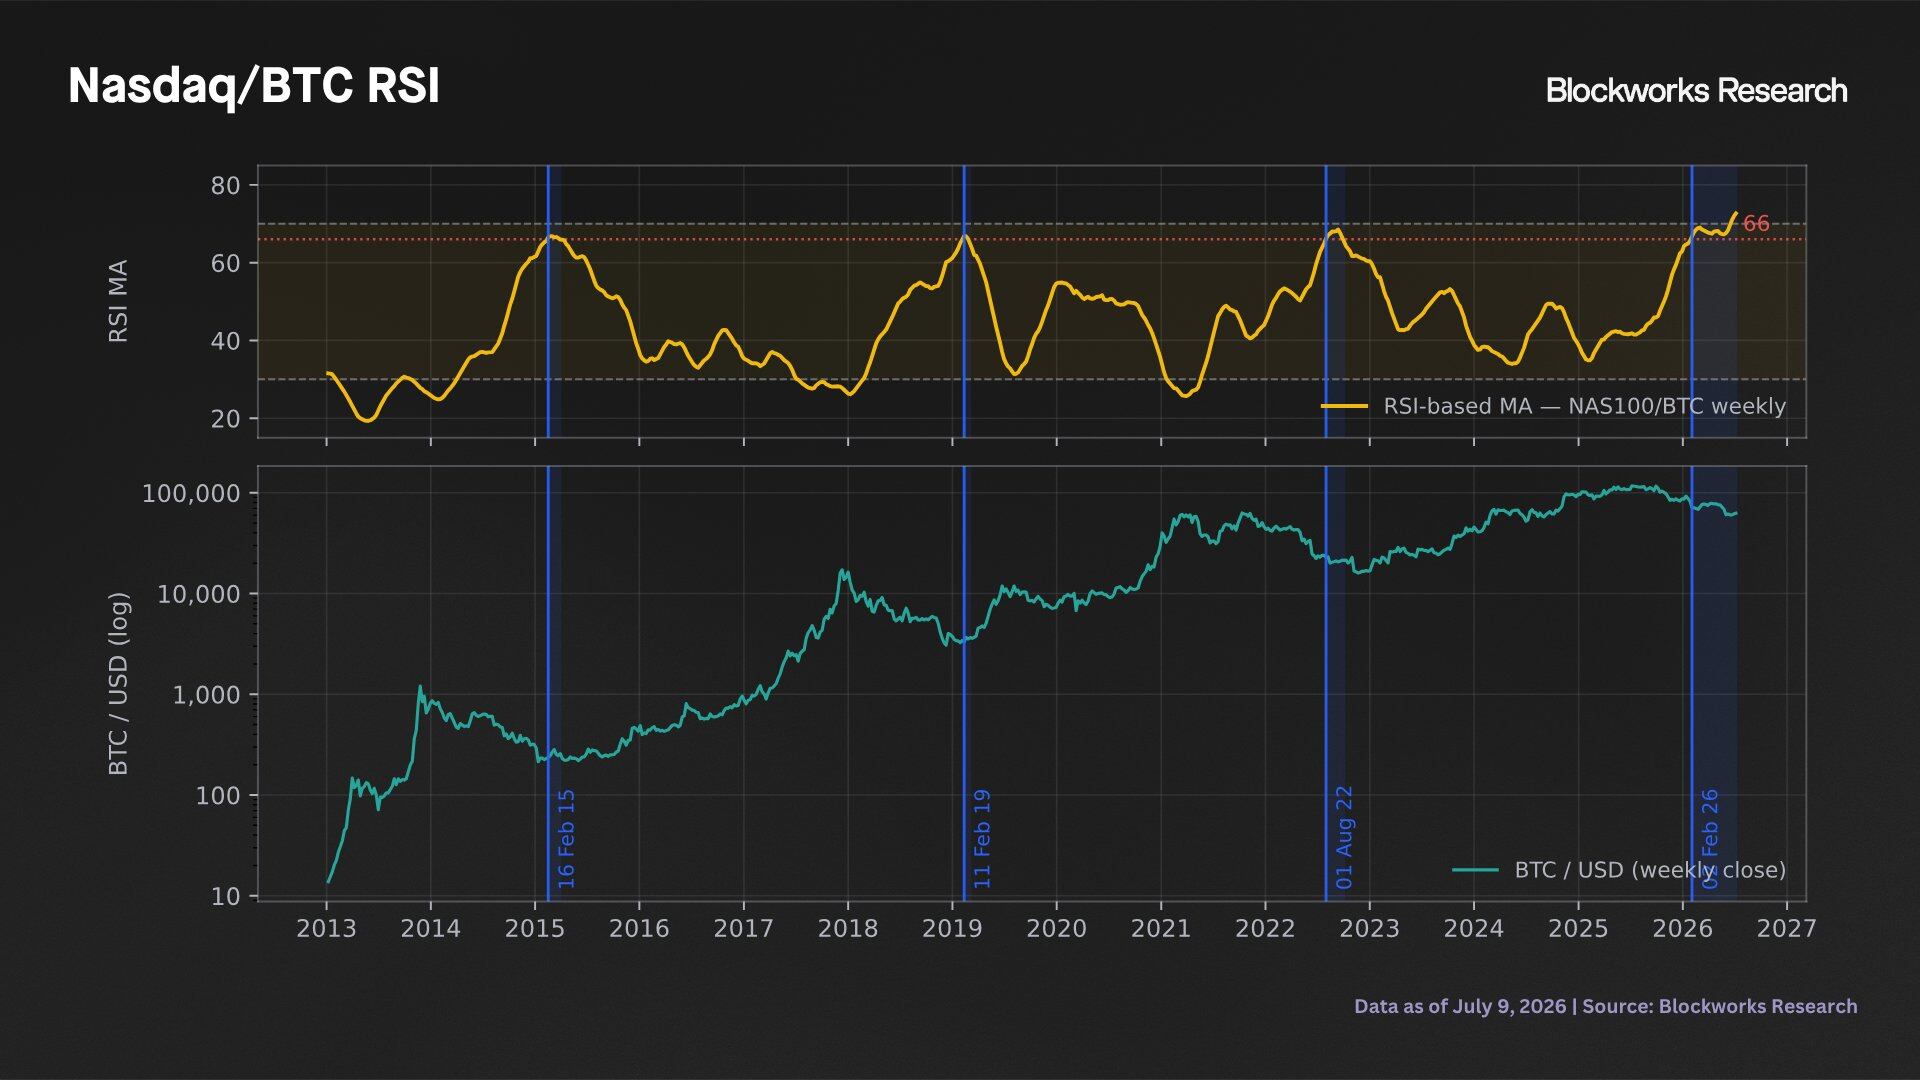
Nasdaq/BTC RSI
Nasdaq's relative overbuying is a rare event. The RSI moving average has been above 65 for only 5.78% of its historical data and above 70 for only 0.35% of the time. These thresholds were breached only in four periods: February 2015, February 2019, August 2022, and the period starting from late January 2026, which continues to this day.
The current value needs to be analyzed from three aspects:
- First, the current level of 72.6 is at a historical high, exceeding the previous peak of 68.5 set in September 2022 by 4.1 points, with all observations above 70 appearing within the past month;
- Second, the current cycle has lasted 24 weeks, marking a historical record, far exceeding the 11 weeks in 2015, 4 weeks in 2019, and 10 weeks in 2022;
- Third, in the past 16 years, it has occurred only four times, making the current situation one of the rarest phenomena of this indicator. Measured this way, this is the most severe overbuying of the Nasdaq index relative to Bitcoin in history; in other words, due to this currency pair and its RSI being able to display inversely, from a longer time frame perspective, this is the most severe overselling of Bitcoin against the Nasdaq index in history.
Indicator Two: Long-Term Expected Returns
Marked by each instance when the Nasdaq/Bitcoin RSI index exceeds 66, the expected return curves for BTC/USD and BTC/NAS100 show upward asymmetry in the three cycles that have already occurred, but only over a longer time frame.
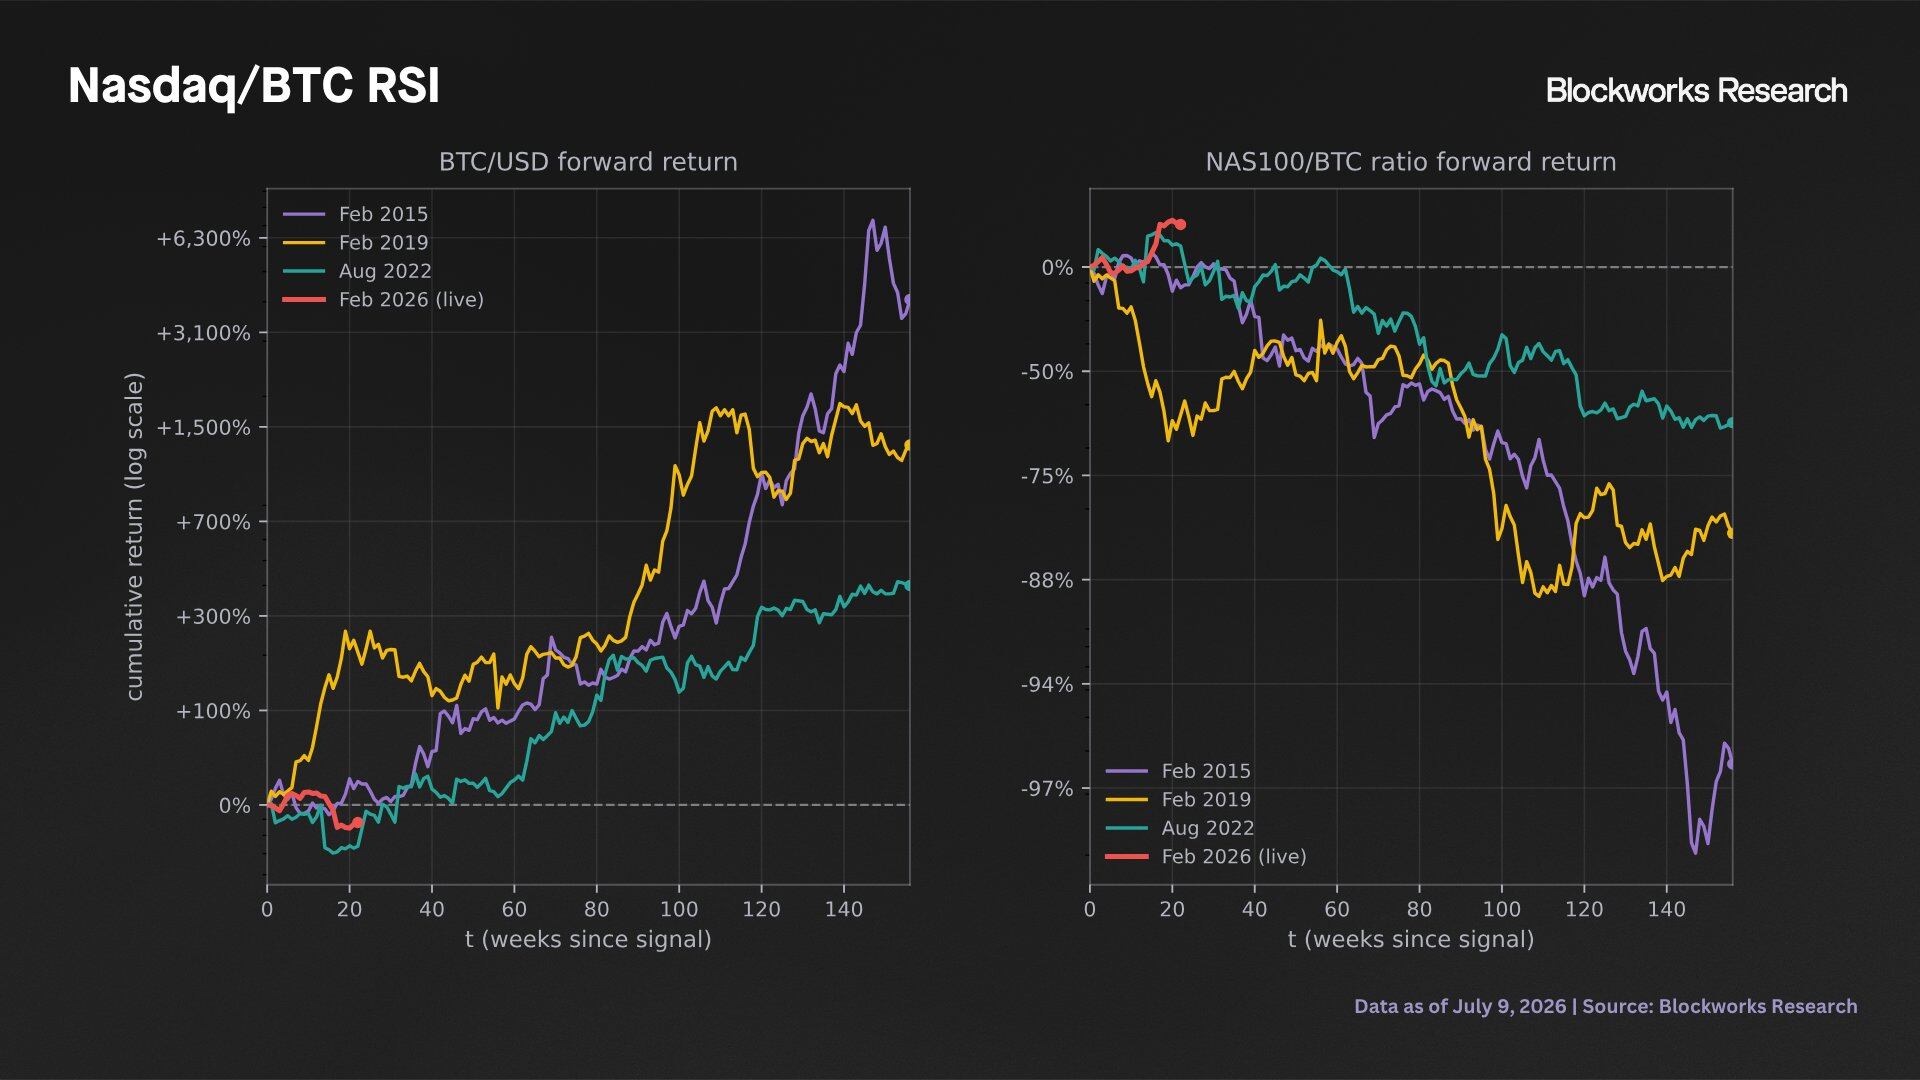
Comparison of Expected Returns for BTC/USD and BTC/NAS100
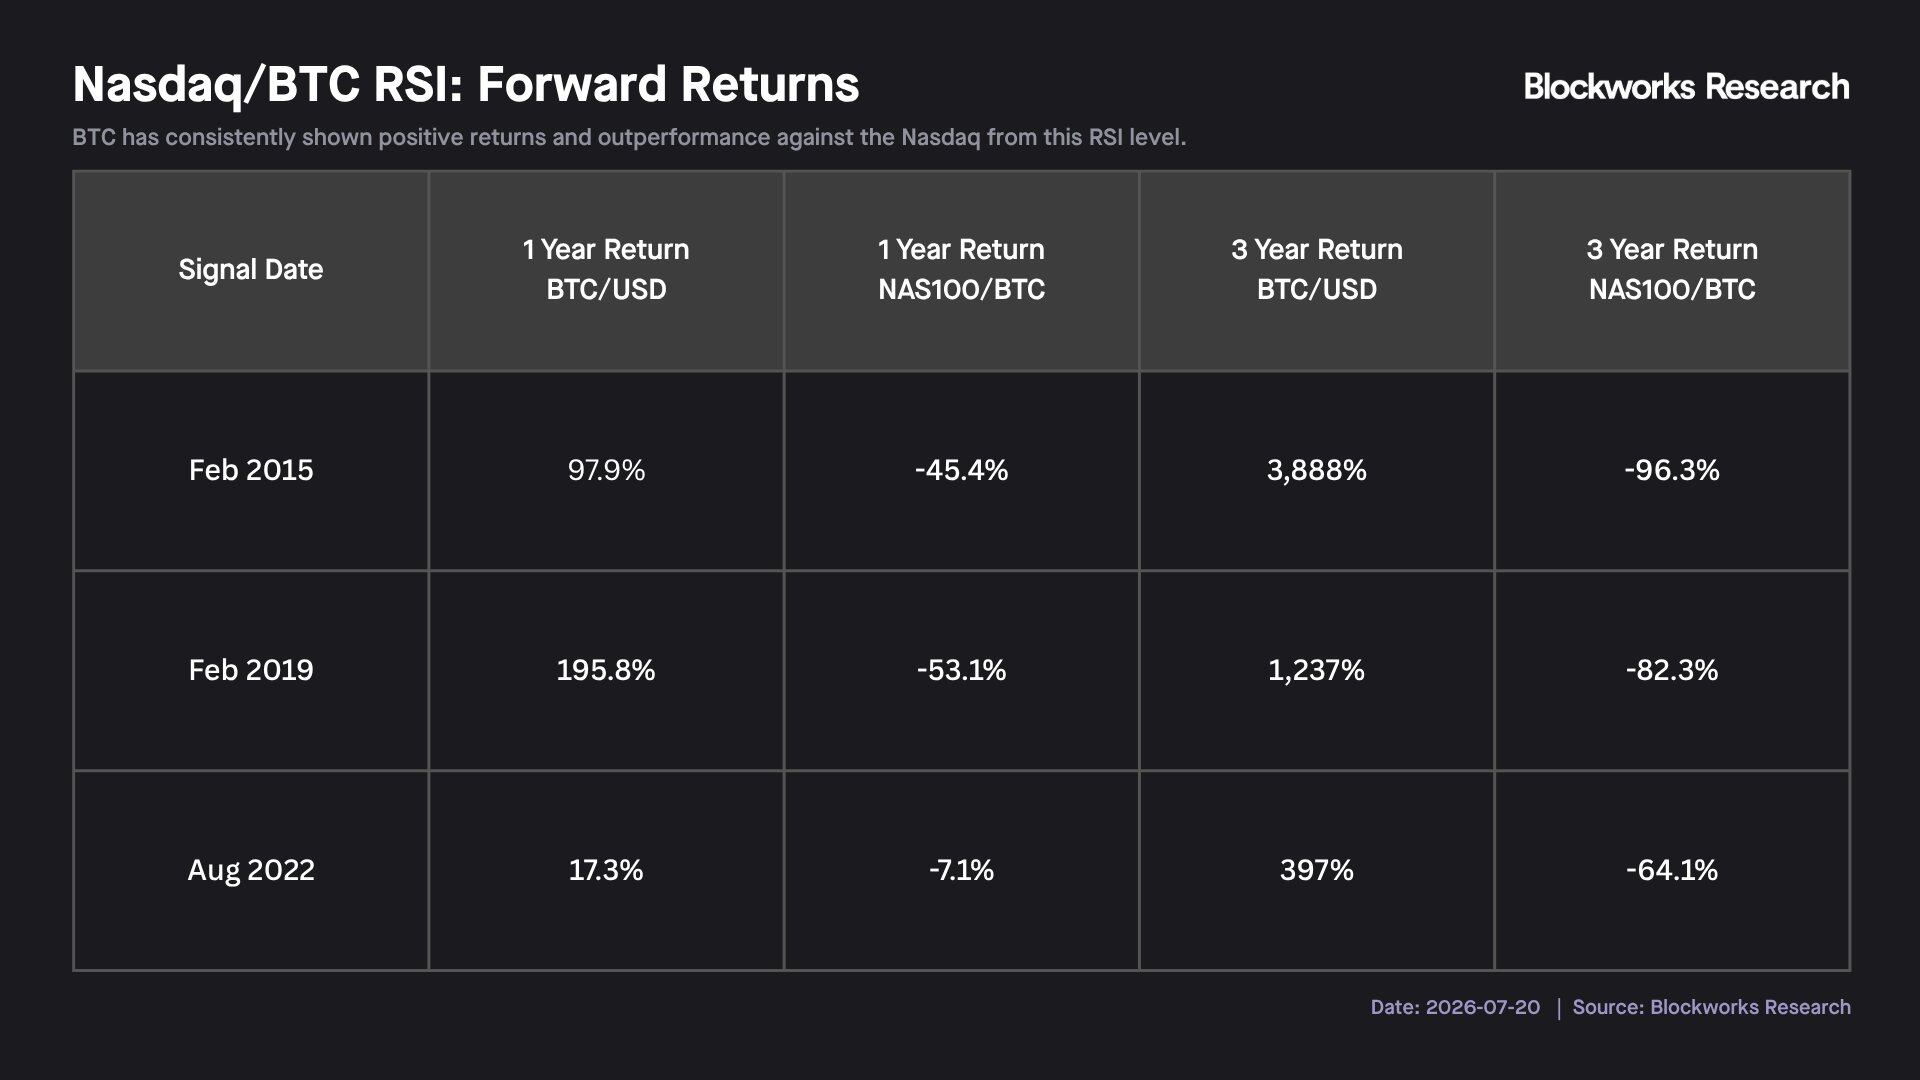
Nasdaq/BTC RSI Expected Returns
This table has two important characteristics:
- The first is the time span. Short-term expected returns have almost no reference value, as the returns within 30-120 days are small and variable in direction; for example, Bitcoin held in 2022 decreased by 29.1% over 120 days but rebounded by 397% three years later. Relative strength signals are not very indicative of trends over the next one to three years.
- The second is the diminishing return amplitude. The three-year Bitcoin return for each cycle is about one-quarter to one-third of the previous cycle, in line with the diminishing marginal returns discussed above. In all observations, Bitcoin has significantly outperformed the Nasdaq index over the following three years.
Indicator Three: Gold/Bitcoin Relative Strength Signals
If the Nasdaq index represents Bitcoin’s status as a risk asset, then gold represents its status as a store of value as a currency.
Constructing a similar indicator on the gold/Bitcoin ratio, we observe similar data, with observations above 66 being rare and exhibiting mean-reverting characteristics, concentrating near extreme values. According to this indicator, February 2026 is the period of the highest level of overbuying in the history of gold/Bitcoin.
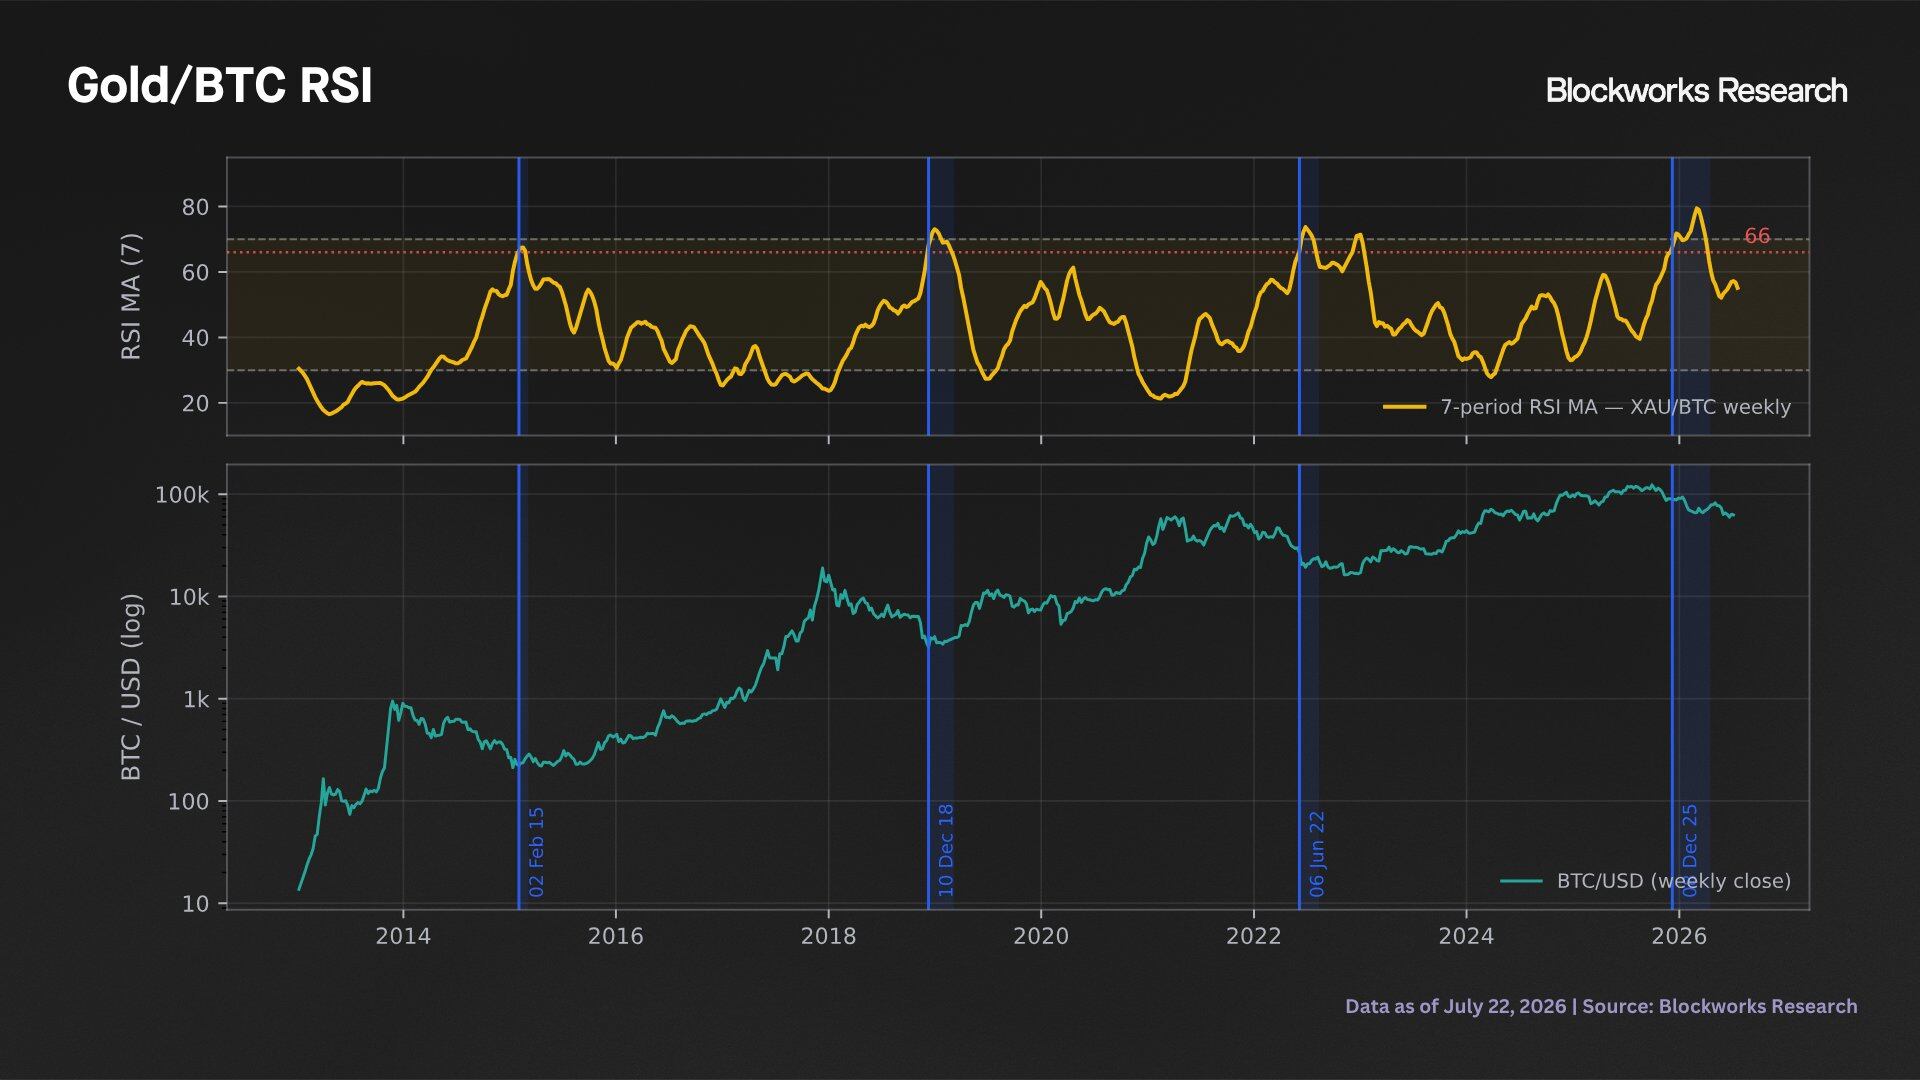
Gold/Bitcoin RSI
The RSI reading of this currency pair rises concurrently with long-term cycle price lows for Bitcoin, demonstrating typical characteristics. The expected return curve of this indicator is similar to the results studied for the Nasdaq; over a 1-3 year time frame, given the extremity of the RSI data, Bitcoin historically has outperformed gold and the dollar.
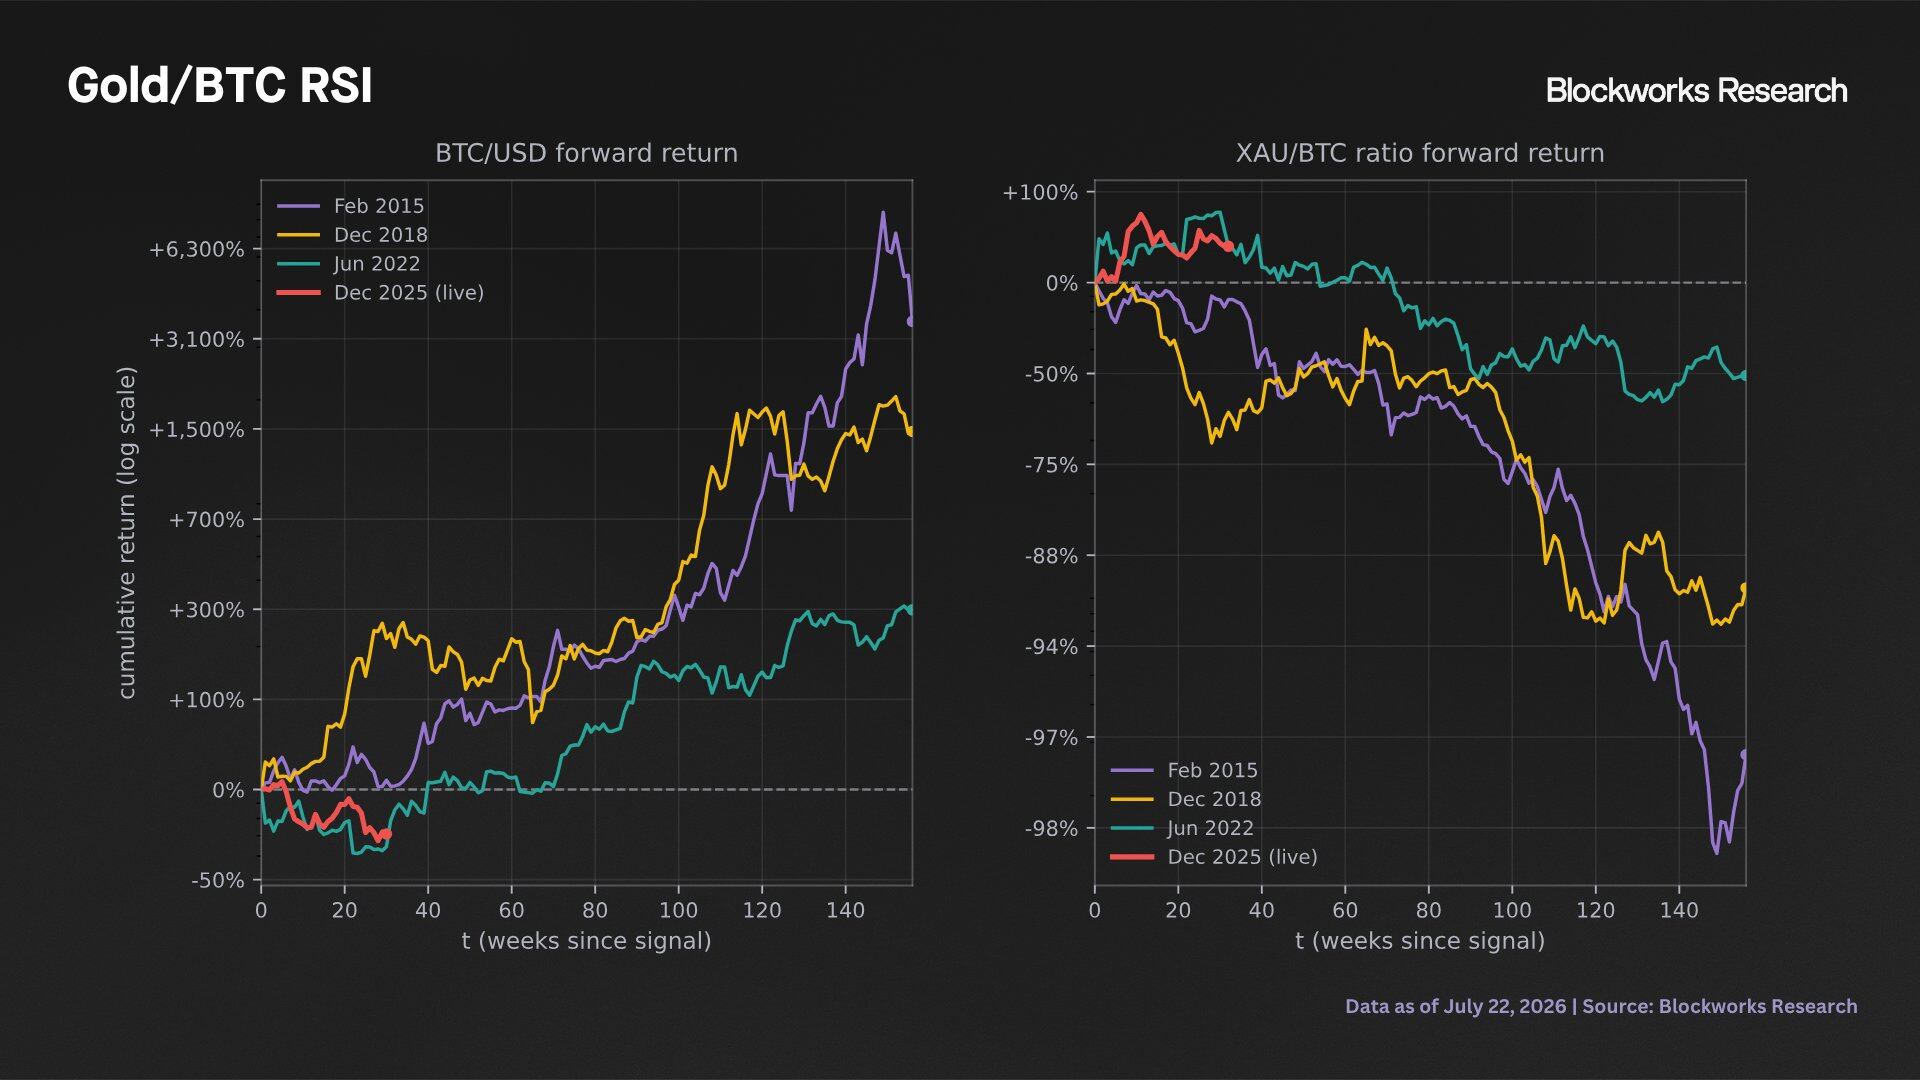
Comparison of Expected Returns for BTC/USD and XAU/BTC
Indicator Four: Actual Price of Bitcoin (On-Chain Cost Basis)
The actual price of Bitcoin estimates the total on-chain cost basis of all circulating Bitcoins. Unlike spot prices that reflect Bitcoin's current market value, the actual price measures the average price of the last transfer of existing supply on-chain, estimating on-chain cost. From historical data, the actual price represents Bitcoin's deep value.
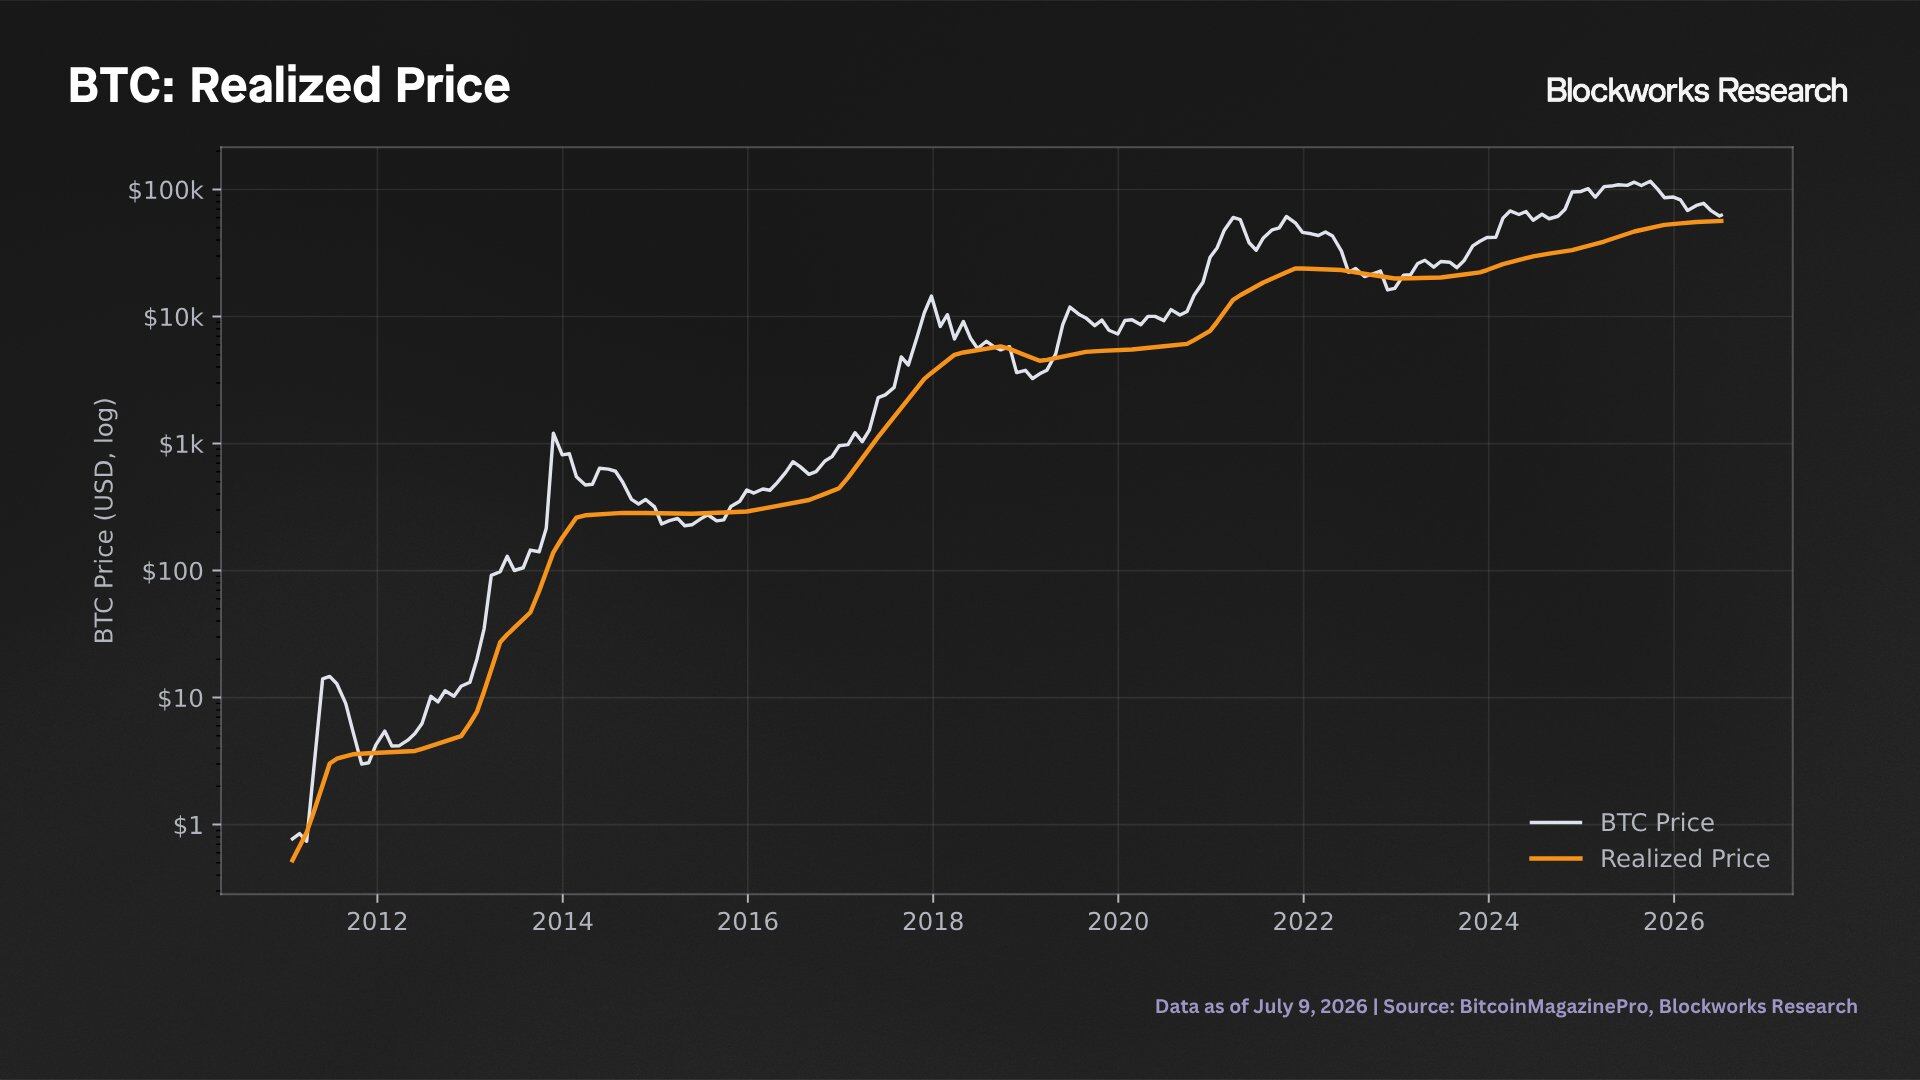
Actual Price of Bitcoin on-chain
The actual price serves as a reference standard rather than a bottom line. Currently, the actual price of Bitcoin is $53,000, which is 18% lower than the spot price, with Bitcoin spot prices historically being below the actual price only 12% of the time.
Similar to the aforementioned RSI indicator, this situation belongs to a cycle tail signal. Each historical bear market low for Bitcoin has been below the actual price, and historically, once in this area, prices typically further decline before bottoming. Therefore, dropping to or below $53,000 aligns with historical patterns rather than contradicting them.
Since entering this area, the expected returns over the long term have been quite substantial.
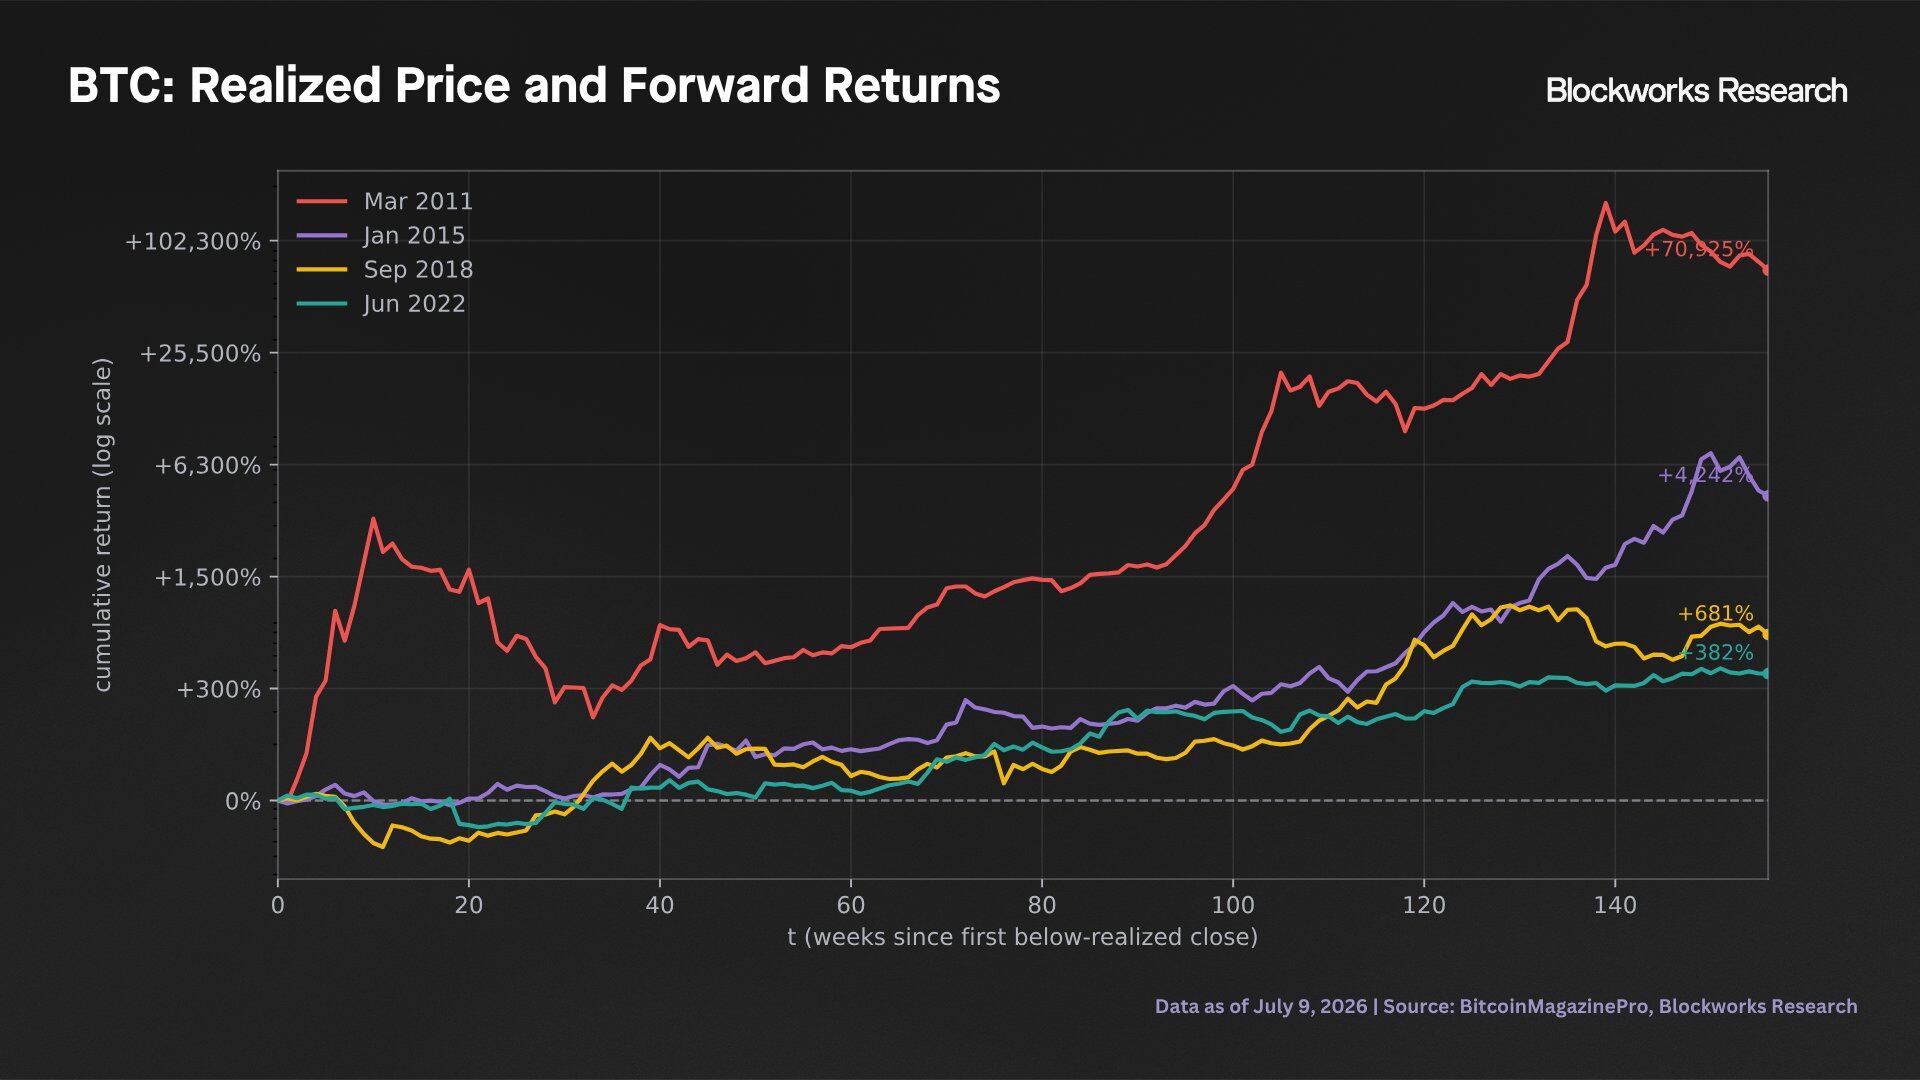
Price Trends after Bitcoin Spot Prices Fall Below Actual Prices
Starting from the first weekly closing price below the actual price within each cycle, historical data shows that there have been significant positive returns within the next 150 weeks. These numbers decline in magnitude with each cycle, consistent with the diminishing trend of the RSI indicator, but the direction is aligned.
Historically, the first weekly closing price of Bitcoin below the actual price marks the end phase of a bear market rather than the beginning or mid-phase of a bear market. Nevertheless, the ratio of Bitcoin's spot price to actual price has significantly retreated from previously elevated levels of 2025, indicating a reduced market risk.
Indicator Five: Cycle Clock
The final indicator is the simplest; it illustrates the historical structure of Bitcoin's bear markets, measured in terms of both price and time.
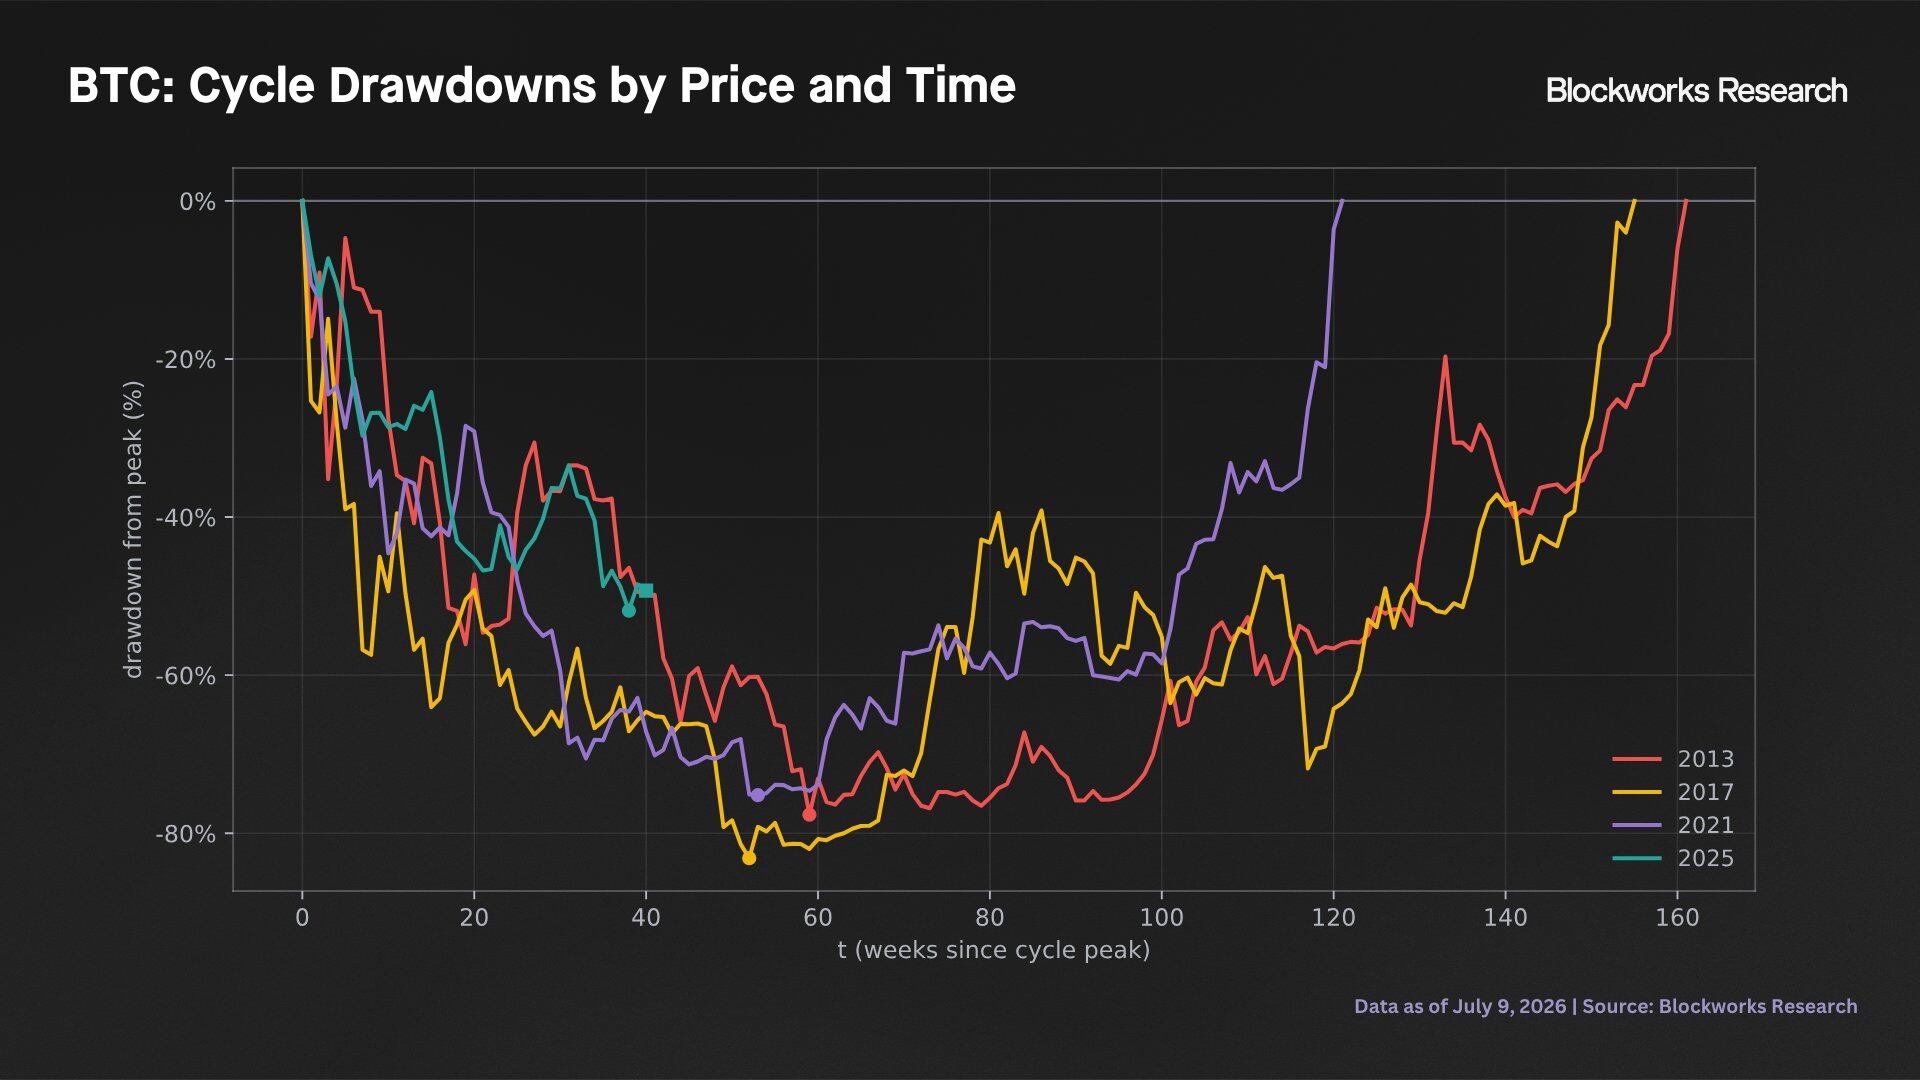
Duration of Bitcoin's Bear Markets
In the cycles of 2013, 2017, and 2021, Bitcoin price lows typically occur around the 60th week after historical highs. The current cycle is in its 40th week, with a 50% retracement, aligning closely with the trends of the previous three cycles. If the trend continues into the 60th week, then Bitcoin's low will be established by the end of November 2026.
Although the RSI indices for both the Nasdaq 100/Bitcoin and Gold/Bitcoin have shown extremes, the current cycle's retracement remains in line with historical retracement paths.
The time dimension also compresses the intervals between cycles, with each cycle falling back to new historical highs in increasingly shorter durations. In other words, the time required to return to the previous high is shorter than in the previous cycle. If this trend continues, then a new historical high should appear within 120 weeks after the last high, indicating a new high before February 2028.
These two observations do not inherently contain any mechanisms; they are merely empirical rules derived from a few limited cycles. Serving as time anchor points, they reinforce the aforementioned conditional signals and limit the remaining downside potential for Bitcoin. If the historical structure holds, Bitcoin is approximately 20 weeks away from its low, or it may have already reached the bottom.
Future Price Trends for Bitcoin
Given the current situation, the following scenario combinations incorporate the backgrounds and historical results discussed earlier, depicting a range of paths that Bitcoin may take over the next three years. This is not a prediction or assertion of possible outcomes but aims to answer a question: if the resolution of the current situation resembles past similar circumstances, where might the price head?
Assuming diminishing marginal returns for both increases and decreases, actual price still presents a discount, and referencing historical retracement paths in price and time, we construct possibilities for Bitcoin's price movements under these conditions. Each possibility is derived from Bitcoin’s three-year performance following the appearance of a certain signal, scaled to different intensities of 0.33 to 0.80 based on periodic returns. The shaded areas in the chart mark the boundaries of historical distributions after decreasing intensity rather than boundaries for possible market fluctuations.
The shaded bands show the range of these possibilities.
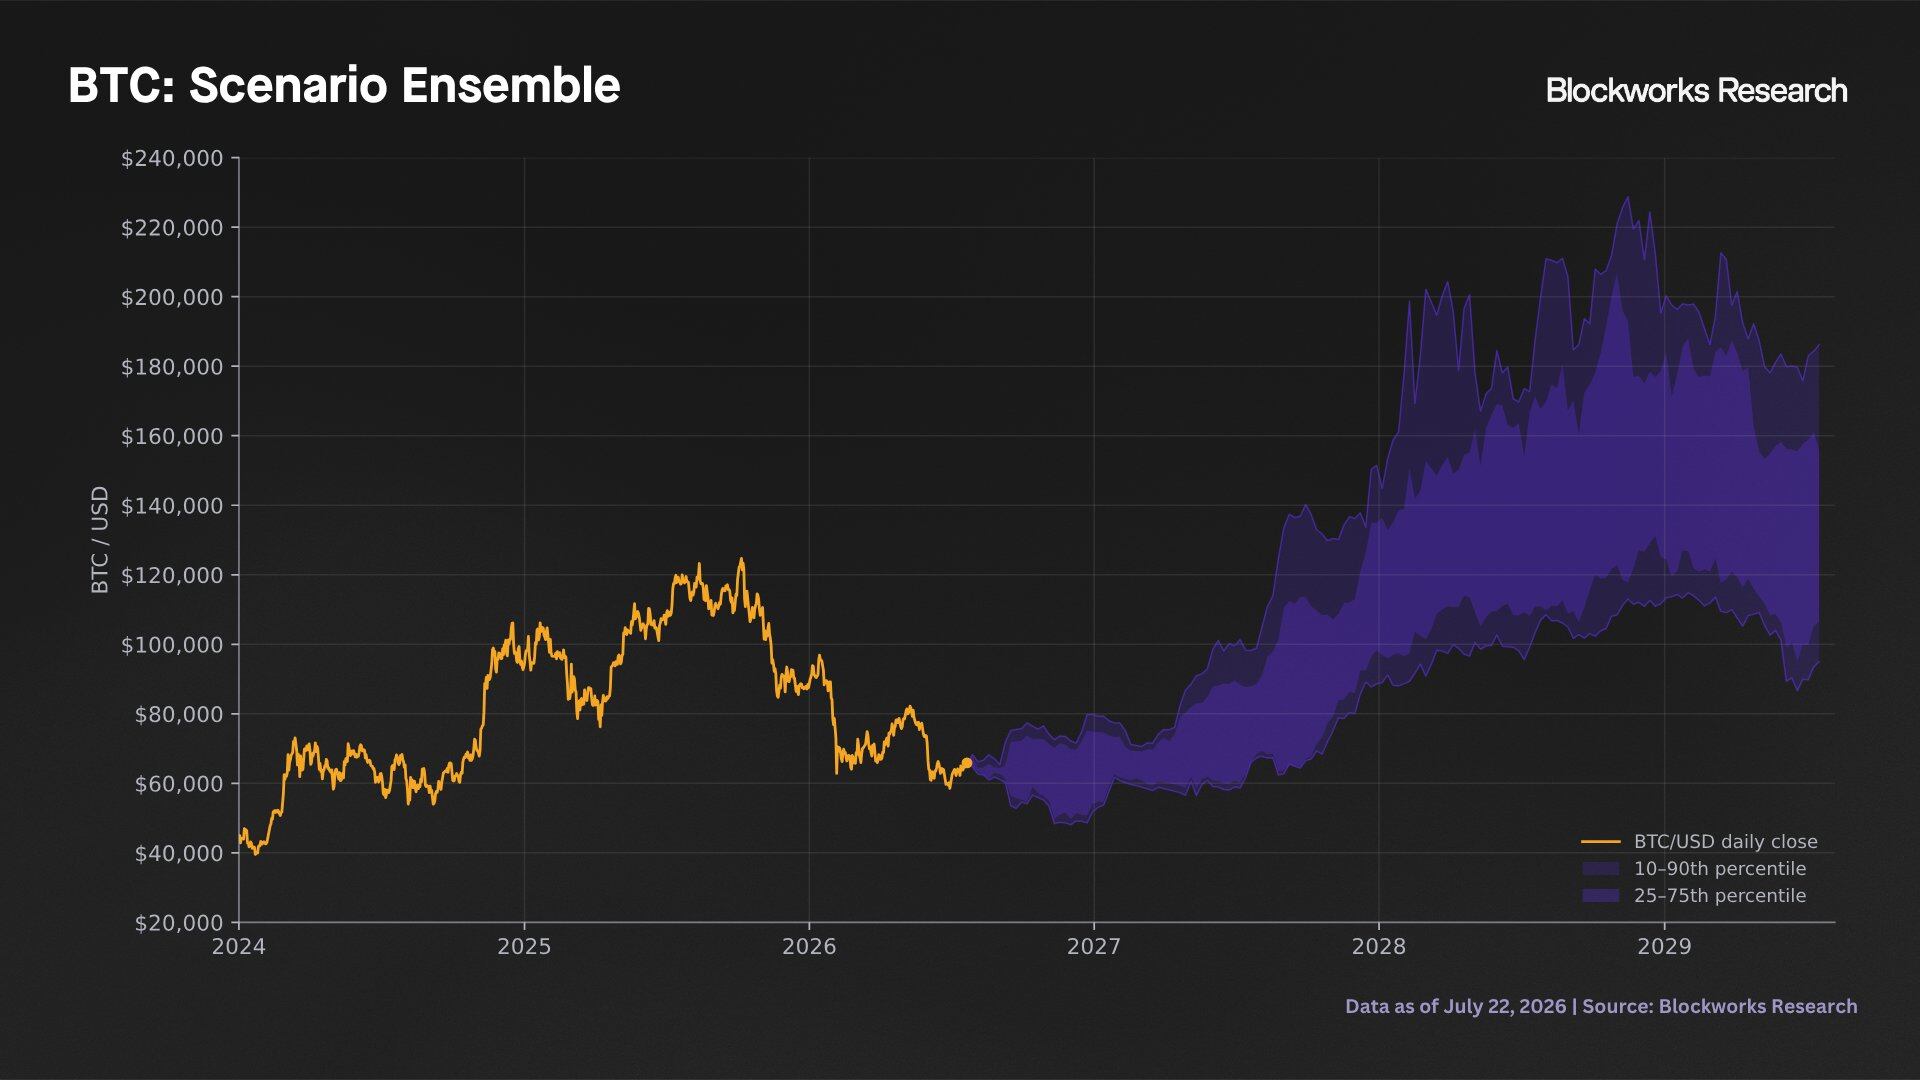
Predictions for Bitcoin's Future Price Trends
These shaded bands are scaled reproductions of the paths following indicator signals in history; all these possible outcomes are satisfactory, describing potential scenarios of historical repetition rather than all possible outcomes and do not include outcomes of signal failures.
While the expected returns vary by the end of 2026, by 2027 and 2028, the distribution of returns will clearly tilt toward a positive and asymmetric upward trend. Given the current market environment and projected paths, the upcoming quarters may provide an extremely attractive opportunity for long-term investment in Bitcoin.
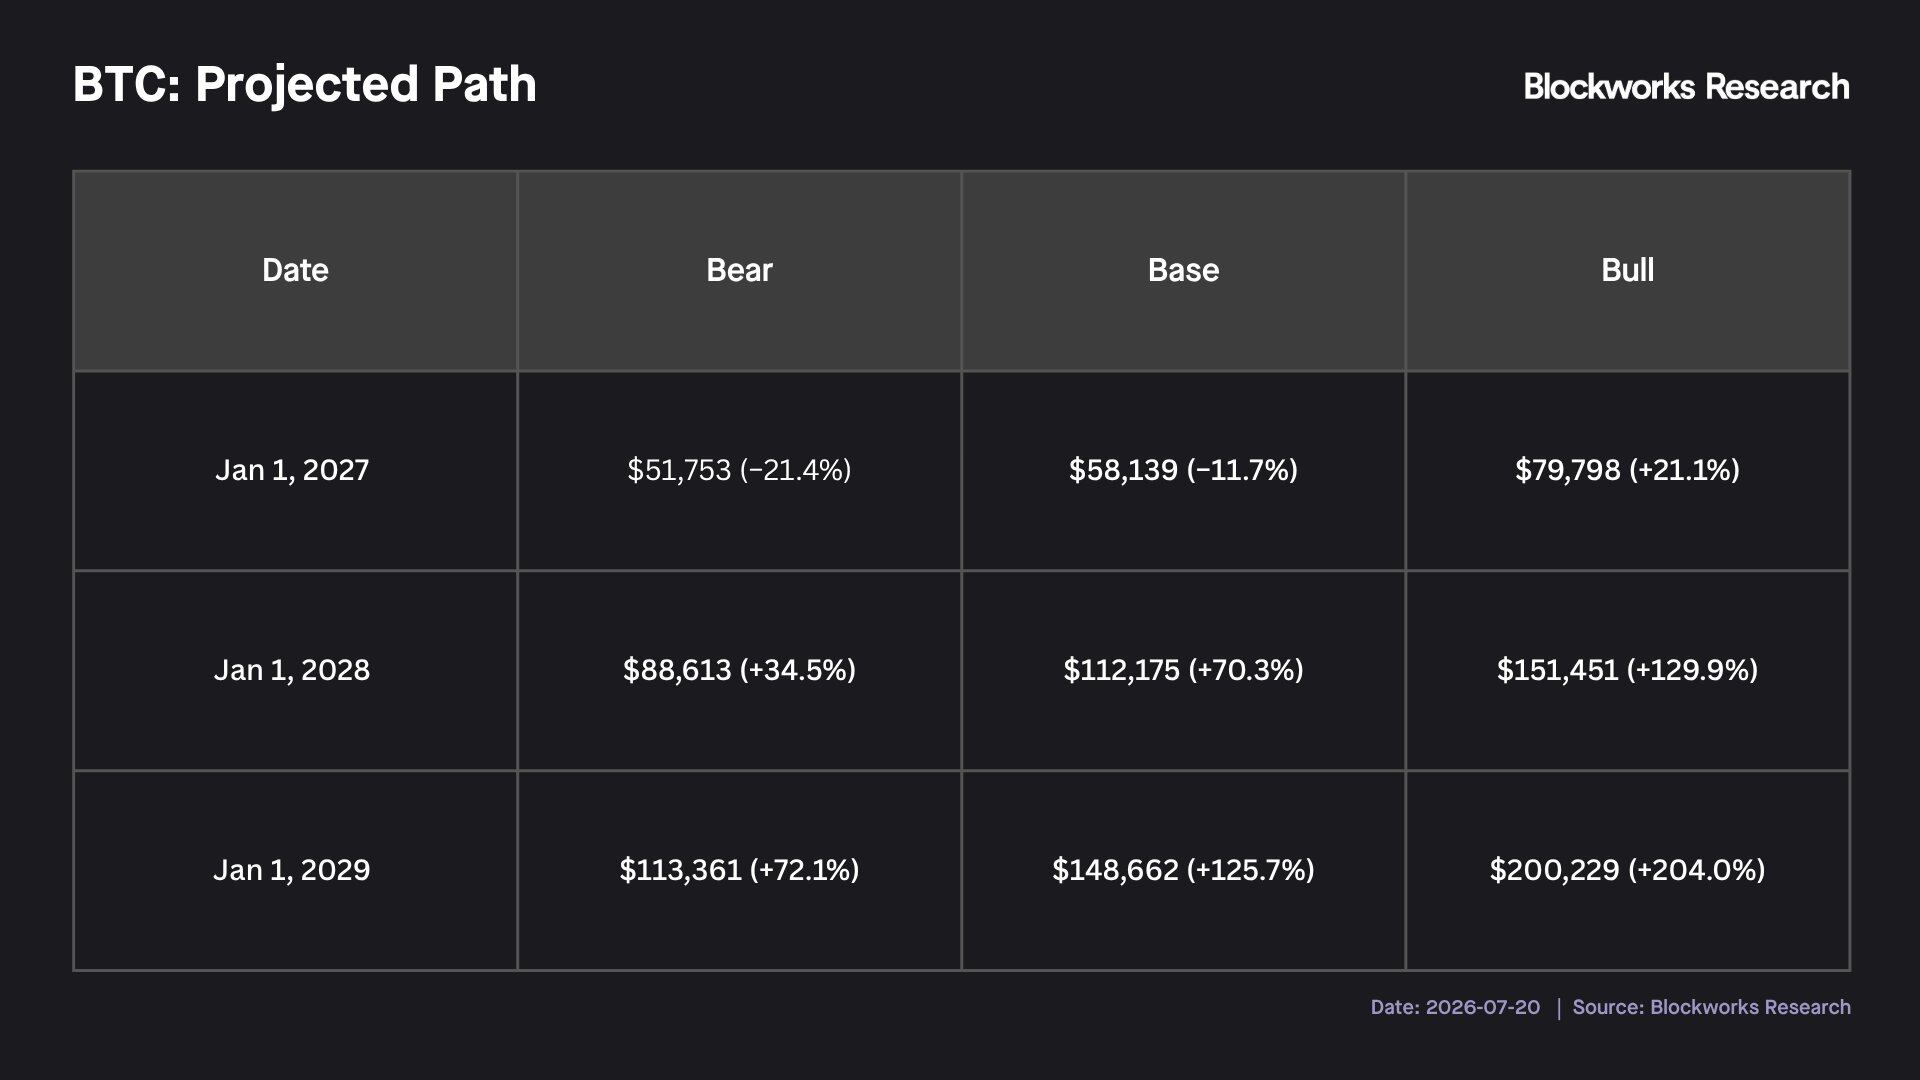
Forecast for Bitcoin's Price over the Next 3 Years
Risks and Limitations
Each indicator should be assessed and weighed according to its own value. These indicators should not be interpreted as mechanisms or causal relationships for Bitcoin cycle lows but should be viewed as manifestations that occur in tandem with long-term cycle lows historically observed.
Additionally, the listed indicators are not exhaustive for approximating long-term cycle price lows. The sample size on which these analyses are based is small; the RSI moving averages illustrate effective samples from four independent cycles, with one cycle yet to be confirmed; the actual price study is based on four cycles, while the cycle symmetry analysis is based on the first three completed cycles. With such a limited sample size, the historical expected return distribution can describe historical trends, but a divergence in one cycle will significantly weaken all presented relationships.
Furthermore, the presented signals should not be viewed as independent corroborations. The RSI indicator, the proximity to actual prices, and the position of the cycle clock largely measure the same fact: Bitcoin has significantly retreated from its peak and is in continued decline. In any prolonged and deep pullback, each indicator should trend towards extremes; thus, their simultaneous appearance is more akin to different measurements of the same observation rather than multiple independent and unique observations.
Structural changes may lead to divergences in this cycle. The current cycle is the first with an ETF presence, substantial corporate holdings, and more complex derivative trading, including options and perpetual futures. The four-year cycle framework may ultimately prove to merely describe four observed results rather than a sustained feature of the asset.
Finally, the RSI indicator signals are relative. Bitcoin outpacing the Nasdaq or gold may indicate that both assets are rising or may mean that both are declining at different rates. Even if the RSI signals are favorable for Bitcoin, if the stock market or gold prices pull back from current highs, the nominal price of Bitcoin may also be dragged down. The signals presented here have little predictive power for movements before November; they merely reflect the asymmetry of price trends for the next 1-3 years.
Conclusion
However, considering the aforementioned indicators, our conclusion is that Bitcoin may be at or near a cycle low, which could form by the end of the year, after which it may resume an upward trend.
Each signal appears near its historically rare extreme values, and each signal has previously indicated that Bitcoin will yield considerable returns in the coming years, outperforming stocks. If the low has not yet occurred, the period from now until that low is likely to represent an extremely attractive long-term accumulation range for Bitcoin. These signals have been largely silent throughout most of history, but they are now issuing "green light signals."
免责声明:本文章仅代表作者个人观点,不代表本平台的立场和观点。本文章仅供信息分享,不构成对任何人的任何投资建议。用户与作者之间的任何争议,与本平台无关。如网页中刊载的文章或图片涉及侵权,请提供相关的权利证明和身份证明发送邮件到support@aicoin.com,本平台相关工作人员将会进行核查。


