1. 4-hour K-line overall interpretation
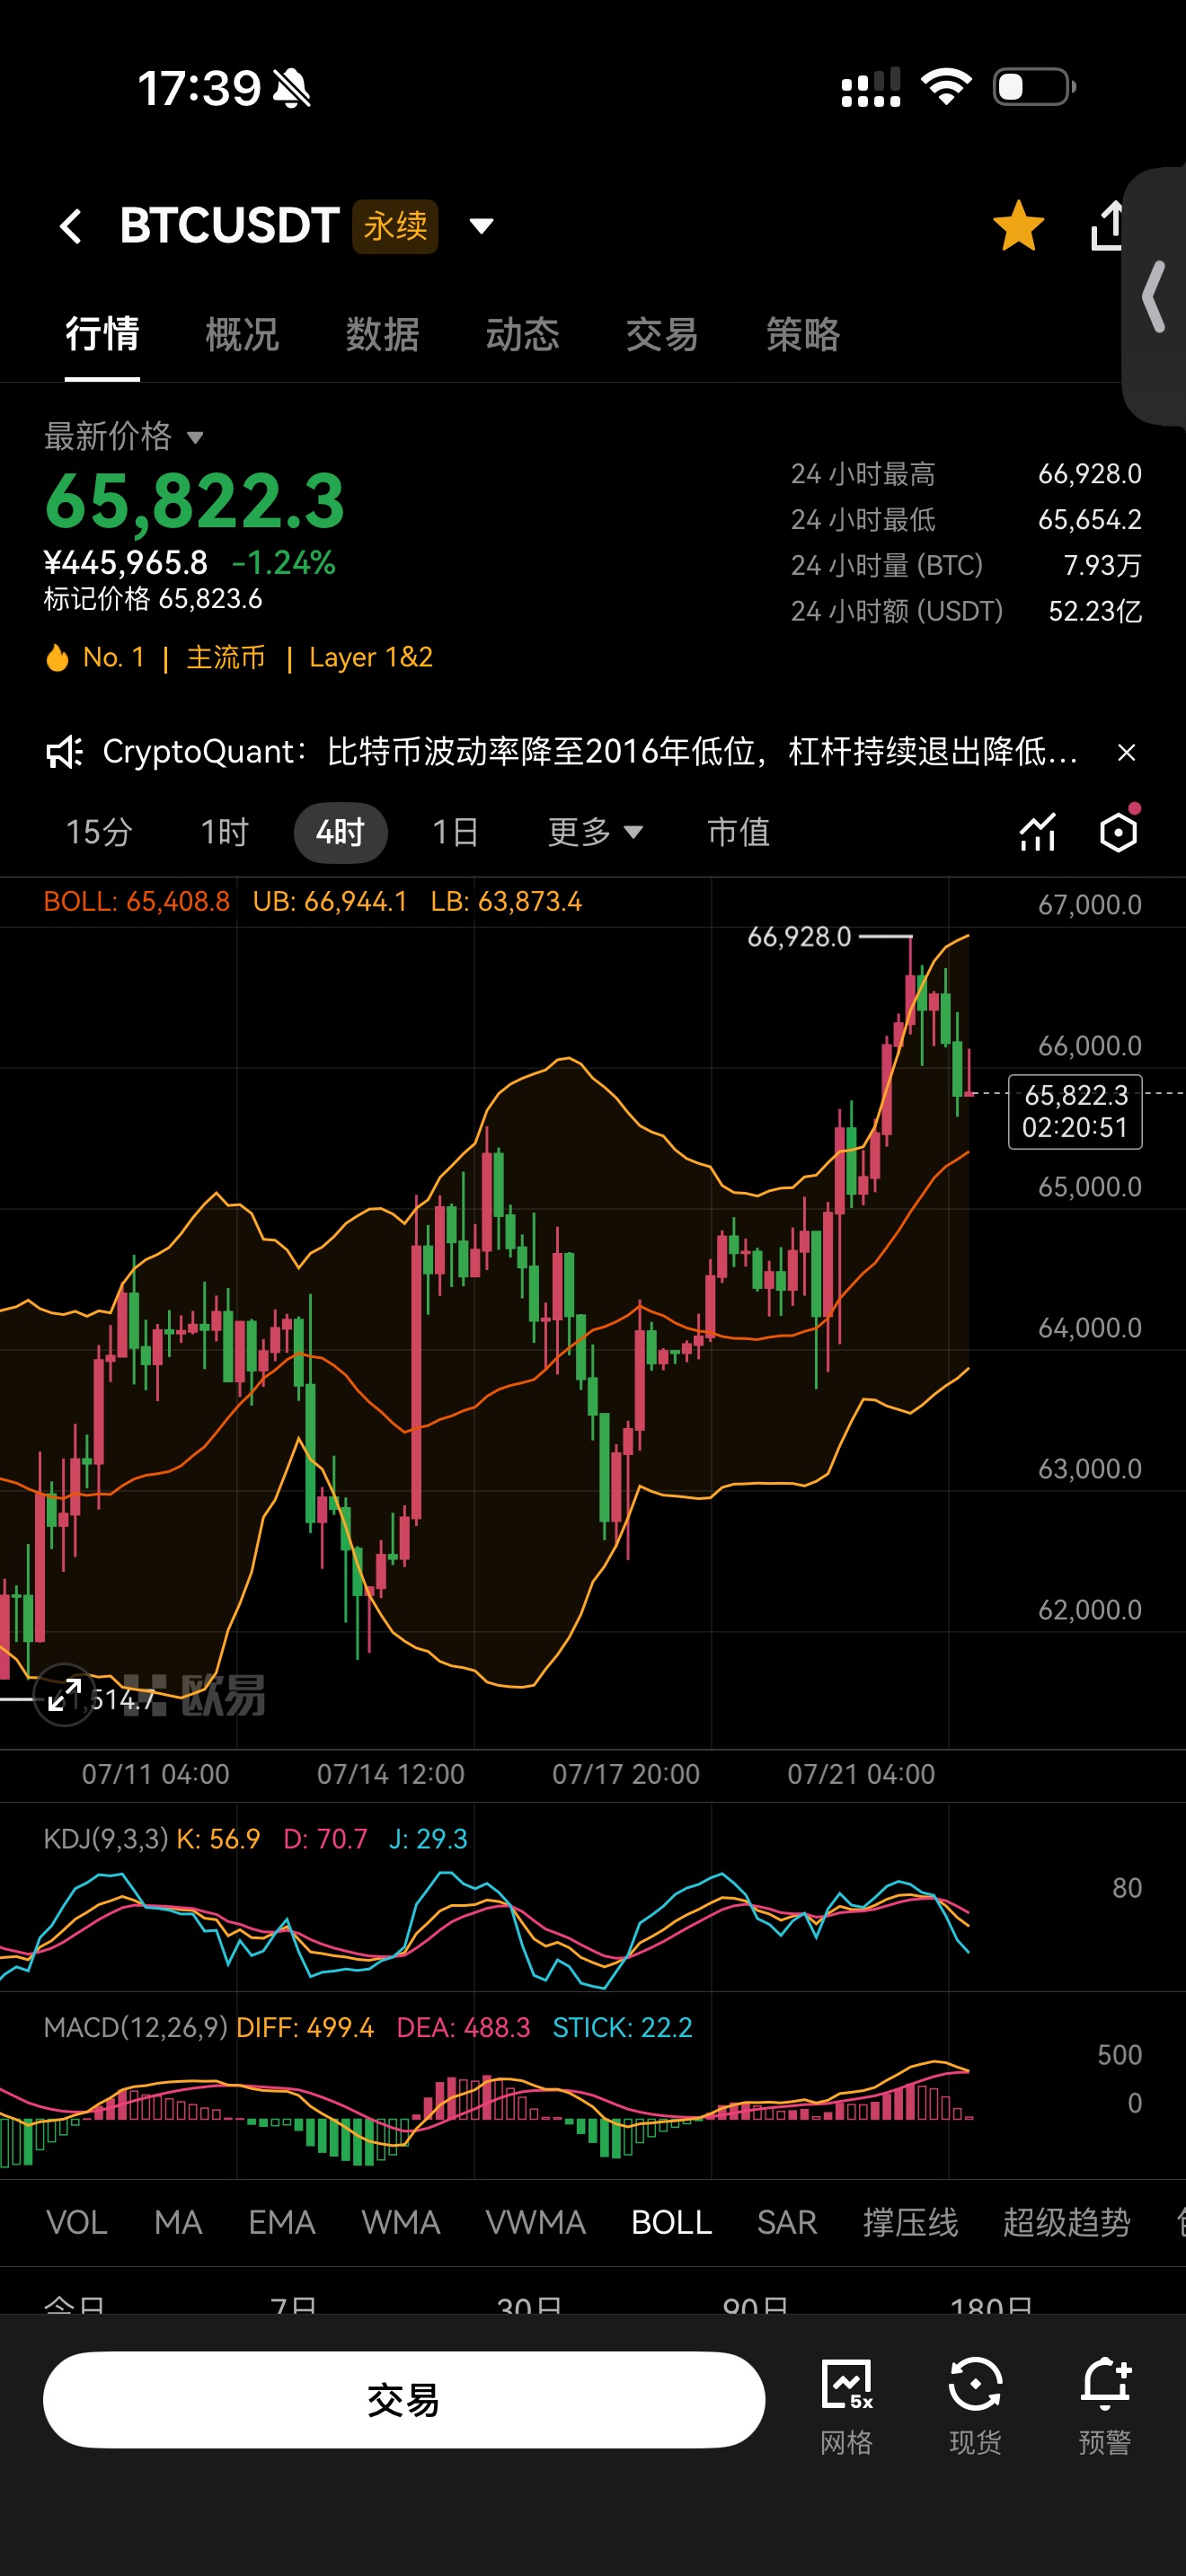
1. Overall Structure: In the medium to long term, it belongs to an upward wave segment where the low points continue to rise. The recent peak at 66928 has seen a retreat; this is merely a short-term pullback after the rise and does not disrupt the overall upward trend. The price has retreated from above the upper Bollinger band back into the channel, and the short-term bullish momentum has weakened, entering a phase of consolidation and adjustment.
2. Short-term Status: A long upper shadow K-line at a high position confirms pressure, followed by consecutive bearish candles. The downward rhythm is relatively mild, without significant volume breaking downward; the current price hovers just above the middle Bollinger band, with bulls and bears engaged in a brief tug-of-war.
2. Level-Based Resistance (Large Level + Short-term)
Resistance Levels
1. First Short-Term Resistance: 66500~66928
This area represents the recent peak, where the long upper shadow K-line has verified that selling pressure is strongest here, making it the primary resistance for rebounds. The market is likely to encounter resistance and retrace if it rebounds to this level.
2. Secondary Intermediate Resistance: 67500 (Bollinger Upper Band Extension Position)
This belongs to the expansion resistance after breaking the previous high. Only if it stabilizes above 66928 will it attempt to test this resistance level.
3. Level-Based Support (Core Support of Large Level)
1. Short-Term Strong and Weak Support: 65400 (Bollinger Middle Band)
This is the lifeline support for the current rise. As long as the 4-hour closing price holds above this line, the upward structure remains intact, with the pullback being merely a washout. If this line is broken, the retracement space will open up.
2. Intermediate Strong Support: 63000 (Bollinger Lower Band)
This is the defensive lower limit for large-level pullbacks and is also the base area for the rise that started this wave. A deep pullback will reach this point, representing intermediate bottom-buying defense support.
3. Extreme Bottom Support: 62000 Previous Rising Platform
This is the starting range of the current rise, representing the last bottom-fishing support that does not break the trend. It will only be touched if the market undergoes a deep adjustment.
Summary of Supporting Market Logic
The current market is in a consolidation period after a high point retreat: holding the 65400 middle band support, a rebound will still attempt to hit the previous high of 66928. If it falls below 65400, the market will seek a deeper retracement to the 63800 Bollinger lower band.
ETH 4-hour K-line market analysis + Support and Resistance Breakdown
1. K-line Patterns and Market Status
1. Overall Trend Structure
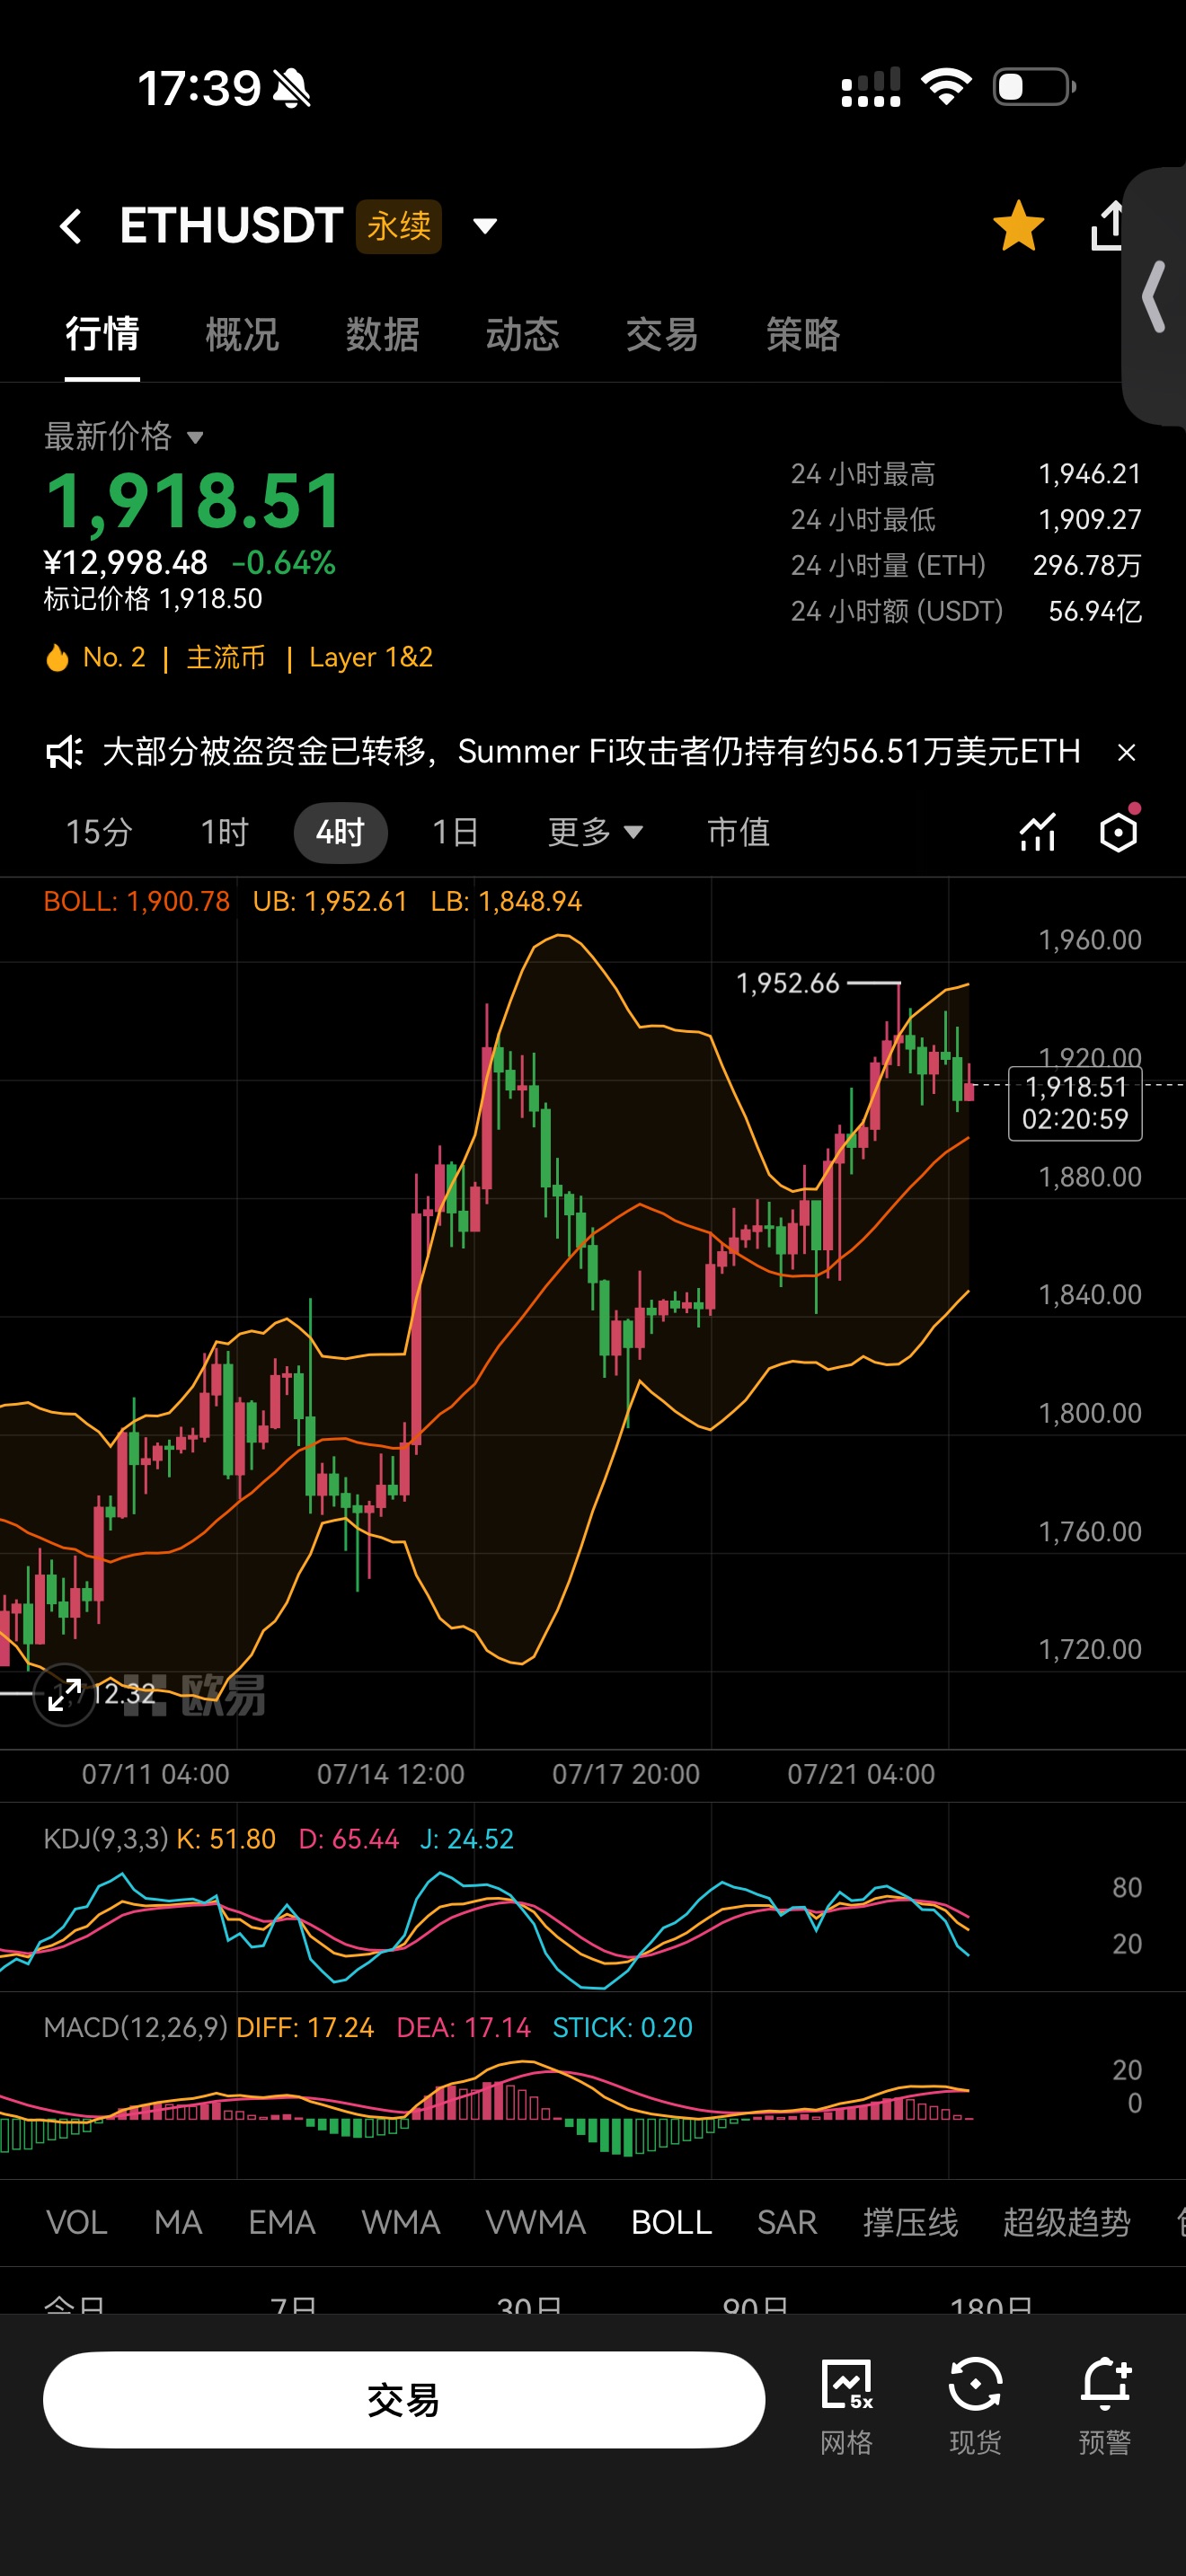
The daily uptrend structure is complete, with movements forming a pattern of gradually rising low points in a consolidating upward manner. The price stopped rising after reaching the previous high of 1952, slightly retreated from the high of the upper Bollinger band, belonging to a high-level horizontal consolidation phase after a rapid rise, and does not signify a trend reversal.
2. Bollinger K-line Performance
The middle Bollinger band at 1900 is the strength pivot for this round of increase, and the current price at 1918 firmly stays above the middle band; the price previously broke through the upper band and returned to the inner channel for a correction, while the upward momentum has been temporarily overstretched, entering a phase of high-level consolidation.
3. Short-term Bull and Bear Signals
The 4-hour K-line has continuously formed small bearish and bullish candles at the 1952 high, indicating that bulls are weak in breaking through; the KDJ indicator's J value has turned downward into the retracement area, and the MACD red bars are substantially narrowing, suggesting a reduction in bull momentum, with the short-term entering a state of bullish consolidation and tug-of-war.
2. Level-Based Resistance
Short-term Resistance
1. First Resistance: 1945 (Previous High + Coinciding Upper Bollinger Band), this is the pressure point for this round of highs, constituting the first strong resistance for rebounds, and the price easily stagnates and retreats when touching this point.
2. Expansion Resistance: 1970, it will only open this upward space if it effectively stabilizes above the 1952 high.
3. Level-Based Support
1. Strong and Weak Watershed Support (Core Short-term): 1900 (Bollinger Middle Band)
If the 4-hour closing price holds above this line, the upward trend remains intact, and the consolidation is merely a washout; once the entity breaks below and closes under this line, the upward structure loosens, and the retracement space widens.
2. Intermediate Strong Support: 1850 (Bollinger Lower Band)
This is the center of gravity for this round of pullback, which will only be touched during a deep retracement, also representing the bottom of a previous round of pullback.
3. Trend Bottom Line Support: 1800 integer barrier
This is the starting platform for the current rebound market and represents the last defensive support that does not break the large-level trend.
Market Summary
The market is currently in a high-level consolidation period after a peak: the price is narrowly grinding between the middle band and the previous high. Stabilizing above the 1900 middle band will lead to a second test of the 1952 high; falling below 1900 will switch the market downward to the 1850 lower band area for a retracement.
Official Account——Bitcoin Big Bear X
(Note: 📣 Due to the timeliness and depth limitations of the information on open platforms, the market changes rapidly. Key turning points, precise operational strategies, and sudden risk alerts must be synchronized in real time on the official account. Here you will receive: real-time strategy push, in-depth analytical support, interactive Q&A, personalized holding risk warnings and optimization suggestions. 🚨 Remember: The market always rewards those who act faster and have more accurate information! Be a winner among the minority.)

免责声明:本文章仅代表作者个人观点,不代表本平台的立场和观点。本文章仅供信息分享,不构成对任何人的任何投资建议。用户与作者之间的任何争议,与本平台无关。如网页中刊载的文章或图片涉及侵权,请提供相关的权利证明和身份证明发送邮件到support@aicoin.com,本平台相关工作人员将会进行核查。