Crypto Circle Academician: Can the 7.21 Bitcoin (BTC) Indicator Golden Cross Continue? Latest Market Analysis and Trading Suggestions Explained
Currently, Bitcoin is at 65500. In this rebound, many friends are restless, having clawed back from the low of 57700 all the way back above 65000. It seems strong, but in reality, it is a typical breather in a downtrend. Don't be dazzled by the red K-line; every rebound now is a key node in the tug-of-war between bulls and bears, not a signal to gamble blindly. Had I known this earlier, when I called for everyone to move north below 60000, I would not have remained indifferent.
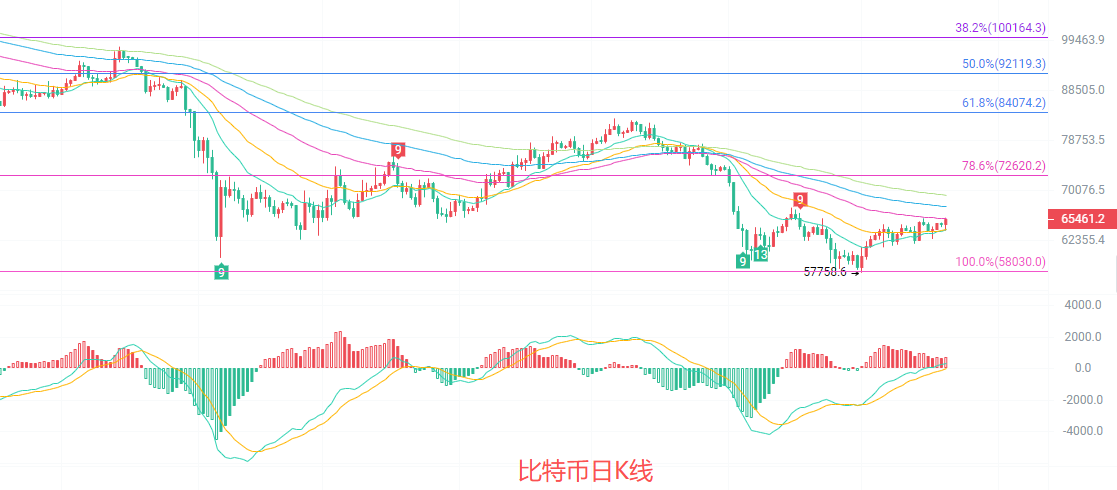
The daily K-line is still in the recovery phase of the downtrend. The price is above the short-term EMA15 and EMA30 moving averages but is under pressure from EMA60 and EMA90, unable to break through key resistance. The MACD indicator's red bars continue to expand, with DIF crossing above DEA to form a golden cross, indicating a short-term recovery in bullish momentum; the middle track of the Bollinger Band at 63499 forms support, while the upper track at 66024 constitutes resistance. The price is still oscillating above the middle track of the Bollinger Band, and the trend has not completely reversed. The Fibonacci 78.6% resistance level of 72620 has yet to be reached, overall presenting a weak rebound pattern after a decline.
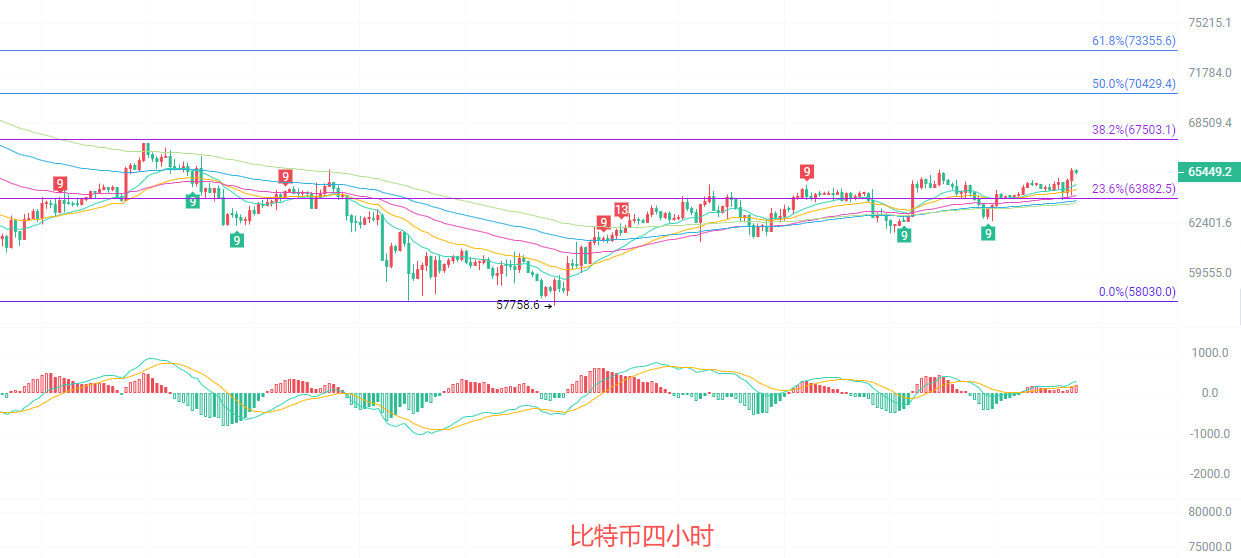
The four-hour K-line is in a clear rebound channel. The price is stabilizing above the EMA15, EMA30, and EMA60 moving average cluster, with strong support from the bullish arrangement in the short term. The MACD red bars are moderately expanding, with DIF and DEA maintaining a golden cross, indicating stable momentum; the Bollinger Band is opening upward, with the price closely following the upper track of 65486, while the lower track at 63458 forms strong support. The current price has broken through the Fibonacci 23.6% resistance level of 63882, and the next resistance level targets 38.2%. In the short term, the bullish trend is dominant, but the trading volume has not seen explosive growth, so be cautious of pullbacks after peaks.
Short-term reference:
If the price does not break below 64300 to 64700, go long, with a stop-loss at 63900 and a target of 66000 to 67500.
If the price does not break below 67000 to 67500, go short, with a stop-loss at 68000 and a target of 65500 to 64500.
Specific operations should be based on real-time market data. For more details, you can consult the author. The article's publication may be delayed, and thus is for reference only. Risks are to be borne by the reader.

Friendly reminder: The above content is exclusively created by the author for the public account. Any advertisements at the end of the article or in the comments section are unrelated to the author. Please discern cautiously. Thank you for reading.
免责声明:本文章仅代表作者个人观点,不代表本平台的立场和观点。本文章仅供信息分享,不构成对任何人的任何投资建议。用户与作者之间的任何争议,与本平台无关。如网页中刊载的文章或图片涉及侵权,请提供相关的权利证明和身份证明发送邮件到support@aicoin.com,本平台相关工作人员将会进行核查。