Dear friends, I am Sister Qinglan. This morning, the market sentiment is quite complex. On one side, large whales are increasing their long positions in BTC, with holdings valued at 108 million USD, which is clearly a bullish signal; but on the other side, the South Korean stock market opened with a drop of over 4%, with Samsung Electronics and SK Hynix plunging 5%, and the risk sentiment in the Asian market is deteriorating, which may transmit to cryptocurrencies. At the same time, U.S. Treasury yields soared to 5.06%, reaching a 16-year high, forming structural pressure on risk assets. This mixed situation of long and short positions is precisely a test for our trading system. In Qinglan's Crypto Classroom, we emphasize data-driven trading, not trading based on feelings. Today, we will use the TPV system to analyze the current market conditions.
Current Price and Time
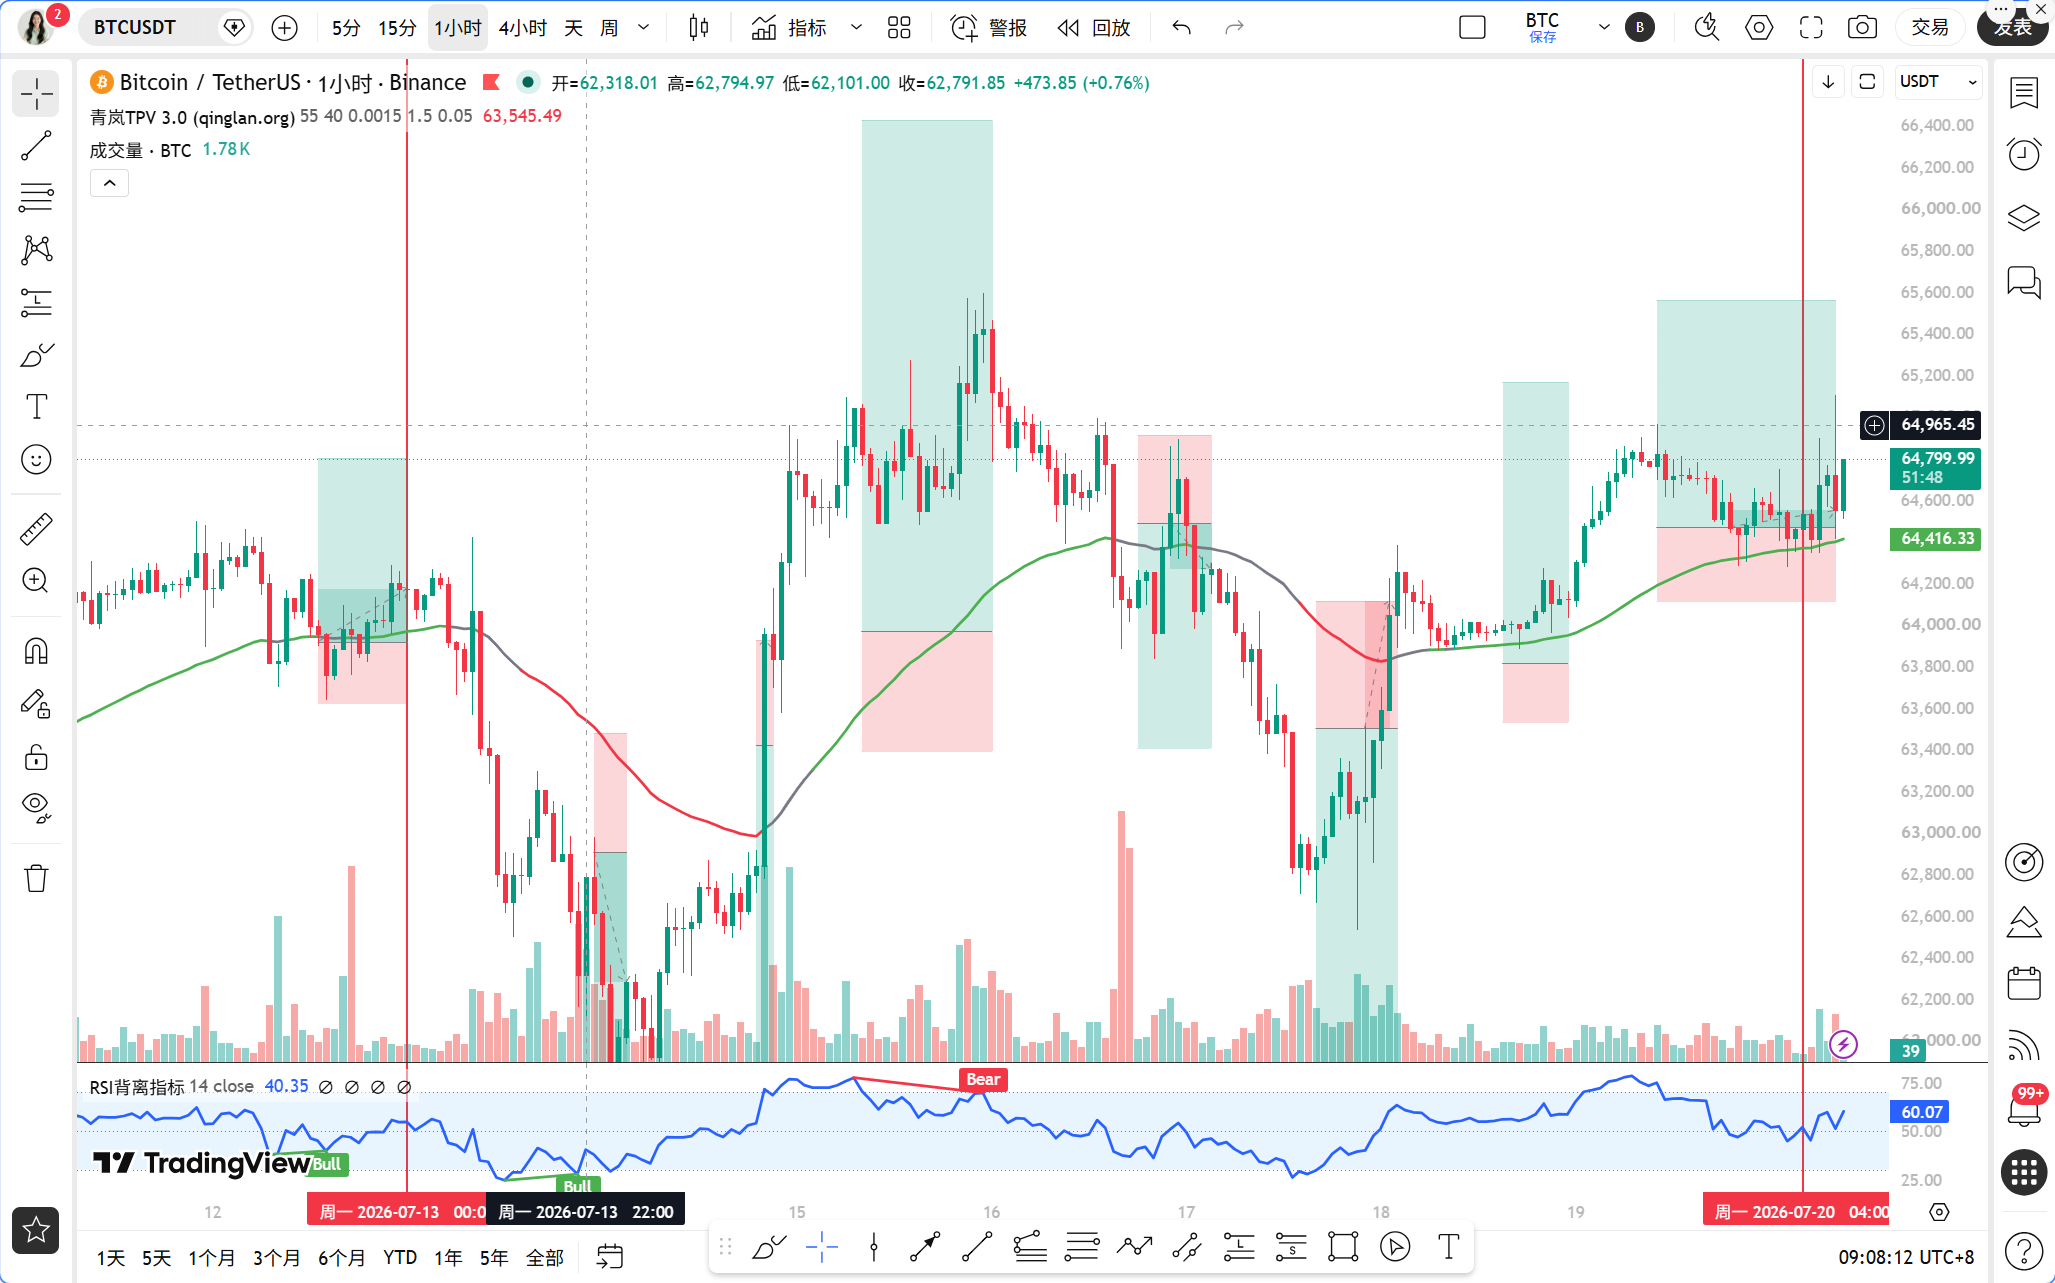
The current time is July 20th, 09:10, with Bitcoin priced at 64989 USDT. The 24-hour decline is 0.53%, and the Fear and Greed Index is at 29, indicating a fear zone. In this position, the battle between bulls and bears is fierce, and we need to find clear signals from the technical perspective.
Multi-Cycle Status Overview
First, let's look at the daily chart. The daily MA5 is 64461.44, MA10 is 64204.10, and MA30 is 62653.89, indicating a bullish arrangement in the moving averages. The MACD's DIF is 301.46, DEA is -14.43, and the histogram value is 315.89. Although the DIF is still above the DEA, the histogram value is expanding, showing that bullish momentum is still present. The RSI is at 54.40, which is in a neutral and slightly strong area, with no overbought or oversold conditions. Overall, the daily chart leans bullish, but the momentum is not particularly strong.
Looking at the 4-hour level. The 4-hour MA5 is 64645.33, MA10 is 64615.40, and MA30 is 64328.30, also indicating a bullish arrangement in the moving averages. The MACD's DIF is 209.46, DEA is 149.31, and the histogram value is 60.15, currently in a golden cross state, but the histogram value is not significantly expanding, indicating moderate bullish momentum. The RSI is at 67.96, close to overbought but not yet there. The 4-hour trend leans bullish, but we need to be wary of waning momentum.
Looking at the 1-hour level. The 1-hour MA5 is 64671.07, MA10 is 64586.05, and MA30 is 64642.16, with the moving average system intertwined. The MACD's DIF is 64.61, DEA is 45.92, and the histogram value is 18.69, in a golden cross state, but the histogram is shrinking, indicating weakening bullish momentum. The RSI is at 67.18, also approaching overbought. The 1-hour EMA55 is 64415.85, and the current price is 64989, which is above EMA55, suggesting a short-term bullish trend.
Looking at the 15-minute level. The 15-minute MA5 is 64852.13, MA10 is 64777.60, and MA30 is 64595.23, with the moving averages indicating a bullish arrangement. The MACD's DIF is 84.11, DEA is 65.86, and the histogram value is 18.25, in a golden cross state, but the histogram value is shrinking. The RSI is at 66.48, neutral and slightly strong. The 15-minute chart indicates short-term momentum for upward movement, but the strength is diminishing.
TPV Signal Verification
Now let's verify using the Qinglan TPV system. We use the 1-hour EMA55 = 64415.85 as the boundary between long and short positions. The current price of 64989 is obviously above EMA55, so the trend is positioned in the bullish area.
Next, let's look at the conditions for going long. First, the price stabilizes above the 1-hour EMA55. In the last 8 1-hour candlesticks, the closing price was greater than EMA55 7 out of 8 times, with it crossing 2 times. The current price's absolute distance from EMA55 is 0.89%, not meeting the volatility threshold, possibly indicating a one-sided trend. The condition of having 2 consecutive 1-hour closing prices greater than EMA55 has been met, as the last two closing prices are 64850 and 64989, both well above 64415.85. Thus, condition one is satisfied.
Second, support stabilization. We need to see long lower shadows, bottom formations, or successful rebounds from effective low points. From the 1-hour chart, the recent low was around 64400, after which the price rebounded to 64989, forming a candlestick with a long lower shadow, which meets the support stabilization condition.
Third, declining downward momentum. The MACD histogram has shrunk for 2 consecutive periods, or the RSI has risen from below 30. Currently, the 1-hour MACD histogram has shortened from 20.5 to 18.69, satisfying the condition. The RSI has risen from 62 to 67, although it hasn't fallen below 30, the shrinking of the MACD histogram is sufficient. Therefore, all conditions for going long are met.
However, it is important to note that the 15-minute MACD histogram is also shrinking, indicating weakening short-term momentum. Additionally, the 4-hour RSI is nearing overbought territory, and the daily RSI is neutral and slightly strong, suggesting that bullish momentum may face short-term pullback pressure. Thus, while the TPV system gives a bullish signal, caution is needed for entry points, and chasing highs should be avoided.
On-chain/Funding Aspects
In terms of on-chain data, the Fear and Greed Index at 29 is in the fear zone, which usually indicates pessimistic market sentiment, but is often characteristic of bottom areas. Whales are increasing their long positions in BTC, with a holding value of 108 million USD, which is a clear bullish signal. However, institutional shorts are also increasing, with Abraxas Capital adding to short positions in Hyperliquid, and the scale of BTC and ETH shorts expanding. Meanwhile, U.S. Treasury yields have soared to 5.06%, forming structural pressure on risk assets. The funding situation is mixed, but whale actions are more worth watching because large funds often have foresight.
Key Attack and Defense Levels
The current price is 64989, with a key resistance level at 65500 above, which is a previous high and a psychological barrier. If broken, the next target is 66200. The key support below is at 64400, which is the position of the 1-hour EMA55 and also a recent low. If broken, it may test the round number of 64000.
Trading Ideas
According to the TPV system, the current trend leans bullish, but short-term momentum is weakening, so the trading idea should be to go long on pullbacks instead of chasing highs.
Direction: Go long.
Entry Conditions: Wait for the price to pull back to near the 1-hour EMA55, in the 64400-64500 range, while meeting the following conditions: 1) A long lower shadow or bottom formation appears near 64400; 2) The MACD histogram begins to shrink on the 1-hour level; 3) The RSI rises from around 50. If these conditions are satisfied, you can enter long.
Stop Loss Level: Set below 64000, at 63950. If the price drops below 64000, it indicates that the bullish structure has been broken, and you may need to exit.
Target Level: The first target is 65500, and the second target is 66200. If the price breaks above 65500 and stabilizes, you can continue holding for 66200.
If the price directly breaks above 65500, it is not recommended to chase long positions, as the momentum may be insufficient; it is safer to wait for a pullback before entering.
If the price drops below 64400, then switch to a wait-and-see approach, waiting for the test of the next support level at 64000.
Risk Warning
The current market has mixed long and short positions, and caution is needed regarding the risk of liquidation under high leverage. Please strictly control position sizes and set stop losses.
Follow Qinglan's Crypto Classroom to grasp more trading opportunities! Welcome to visit the official website www.qinglan.org
📊 Qinglan TPV Trading Strategy Backtest Reference
🕒 Last Backtest Time 07-20 07:00:01
Total Analysis: 3072 Backtests: 2338 Accuracy: 76.5% (1788/2338)
免责声明:本文章仅代表作者个人观点,不代表本平台的立场和观点。本文章仅供信息分享,不构成对任何人的任何投资建议。用户与作者之间的任何争议,与本平台无关。如网页中刊载的文章或图片涉及侵权,请提供相关的权利证明和身份证明发送邮件到support@aicoin.com,本平台相关工作人员将会进行核查。