Dear friends, I am Sister Qinglan. Today we will talk about the market situation on July 19. In the highlight news, two pieces of information are worth noting. Firstly, the cryptocurrency fear index has risen to 28. Although it still remains in the fear zone, it has moved away from extreme fear, indicating that market sentiment is improving, which may support a short-term rebound for BTC and ETH. Secondly, the weekly net inflow for the U.S. Bitcoin spot ETF is 75.5 million USD, while the ETH ETF sees a net inflow of 105.5 million USD. Institutional funds continue to flow in, providing bottom support for the market. However, funding rate data shows that the market is broadly bearish, with intense long-short battles, and we need to use data to find direction.
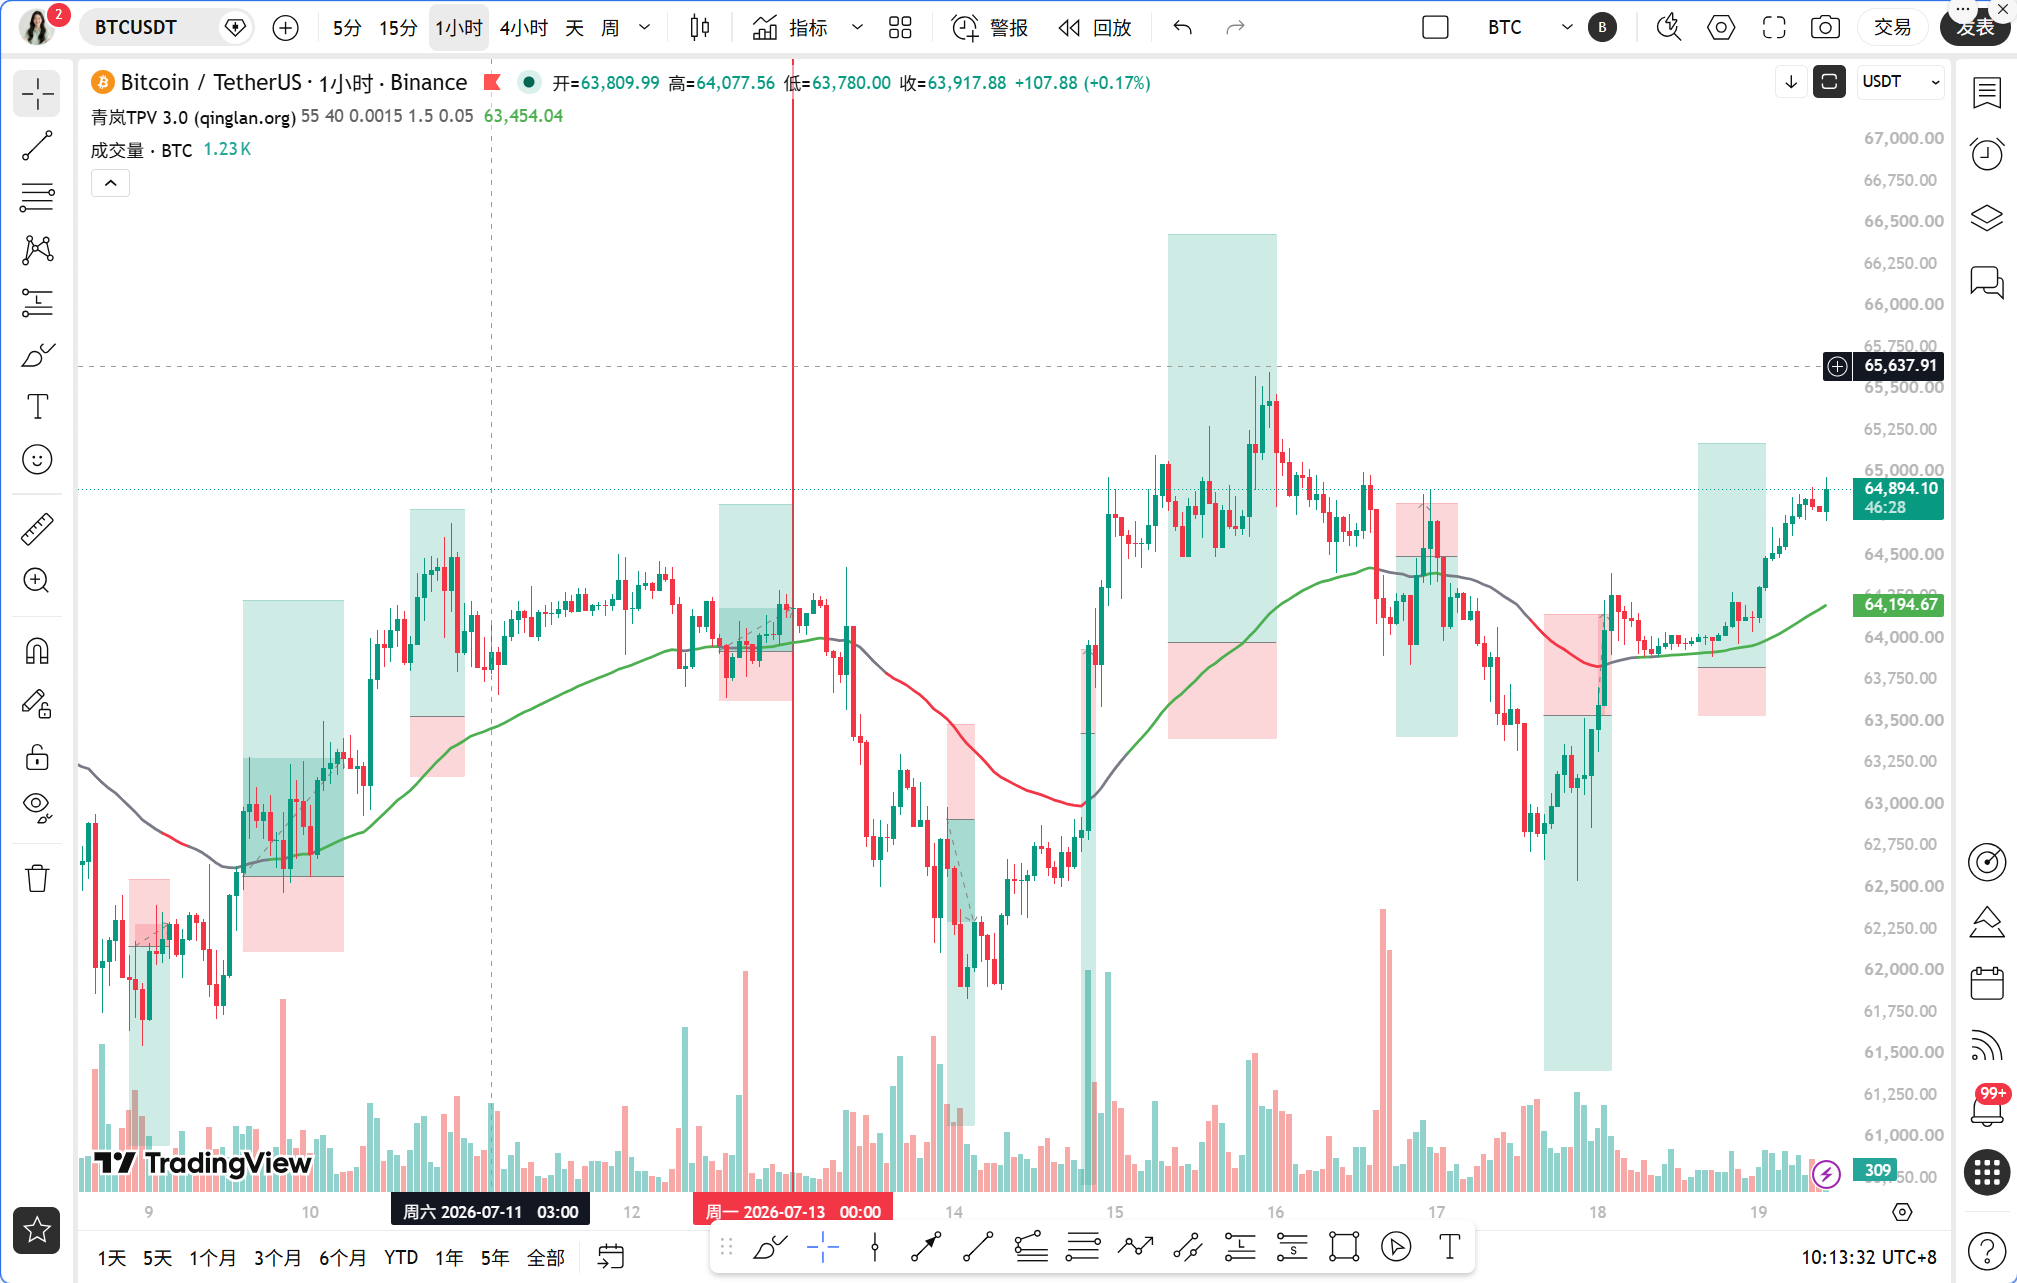
Current Price and Time
The current time is July 19, 10:37, and the BTC price is reported at 64,932 USDT. The 24-hour increase is 1.41%, with the price rebounding from a low point, but still overall in a consolidation and correction phase. The fear and greed index is at 28, indicating cautious market sentiment.
Multi-Cycle Status Overview
First, let's look at the daily chart. Daily MA5=64,456.88, MA10=64,142.36, MA30=62,637.86, with the moving average system in a bullish arrangement, and the price above all moving averages. The MACD's DIF=252.82, DEA=-88.53, with a pillar value of 341.35, where the DIF crosses above the DEA forming a golden cross, indicating that bullish momentum continues to strengthen. RSI=55.90, in the neutral to stronger area, showing no overheated signals. Overall, the daily chart leans bullish, but the RSI has not reached above 70, indicating that there is still room for upward movement.
4-hour cycle. MA5=64,502.41, MA10=64,207.71, MA30=64,223.09, with the price running above the moving averages, diverging upward. The MACD's DIF=162.64, DEA=63.36, with a pillar value of 99.28, where the DIF is above the DEA, the pillar value is positive and continues to amplify, indicating strong bullish momentum. RSI=58.18, in the neutral area, without overbuying. The 4-hour chart shows that there is sufficient momentum for a short-term increase.
1-hour cycle. MA5=64,825.87, MA10=64,709.96, MA30=64,261.69, the price is above the moving averages. The MACD's DIF=248.25, DEA=207.57, with a pillar value of 40.68, the DIF is above the DEA, and the pillar value is positive, but has shortened compared to before, indicating a slight decrease in bullish momentum. RSI=83.05, entering the overbought area, with short-term pullback pressure. EMA55=64,236.69, the current price of 64,932 is far above EMA55, by 1.08%, which belongs to a strong bullish area.
15-minute cycle. MA5=64,836.46, MA10=64,809.78, MA30=64,742.35, with the moving averages arranged in a bullish manner. The MACD's DIF=77.21, DEA=84.26, with a pillar value of -7.05, where the DIF is below the DEA, forming a death cross, and the pillar value is negative, indicating short-term pullback needs. RSI=68.84, in the neutral to stronger region but not overbought. The 15-minute chart shows short-term adjustment pressure.
Summary of Multi-Cycle: The daily and 4-hour charts are bullish, the 1-hour is bullish but with waning momentum, and the 15-minute shows pullback signals. The overall trend is upward, but short-term pullbacks may be faced.
TPV Signal Verification
According to the Qinglan TPV system, we take the 1-hour EMA55=64,236.69 as the boundary for bullish and bearish positions. The current price of 64,932 is above EMA55, and in the past 8 1-hour K-lines, the closing price was greater than EMA55 8 times, crossing 0 times, with a price deviation from EMA55 of 1.08%, not meeting the oscillation threshold, indicating a one-sided bullish trend.
Bullish Condition Verification. First, the price stabilizes above 1H EMA55, with two consecutive 1-hour K-lines closing above EMA55, condition satisfied. Second, support stabilizes, bouncing from around 64,236 to form an effective low point, condition satisfied. Third, the downtrend momentum is exhausted; although the 1-hour MACD pillar value has shortened, it has been amplifying continuously before, with RSI recovering from a low to 83, but no obvious exhaustion signal appears, condition partially satisfied. Overall, the bullish trend is established, but short-term momentum wanes, requiring caution for pullbacks.
Bearish Condition Verification. First, the price is under pressure below 1H EMA55, with the current price above EMA55, condition not satisfied. Second, pressure meets resistance, with the price not reaching any effective high point and falling back, condition not satisfied. Third, the rebound is weak; the MACD pillar value shrinks but does not turn negative, RSI is overbought but has not fallen back, condition not satisfied. Thus, the bearish signal has not been triggered.
Oscillation Condition Verification. In the past 8 1-hour K-lines, the closing price was greater than EMA55 8 times, crossing 0 times, with a deviation of 1.08%, not meeting the oscillation threshold. Currently in a one-sided trend, oscillation processing is not applicable.
On-chain/Funding Situation
On-chain data shows that the fear and greed index is at 28, and market sentiment is still leaning towards fear, but has moved away from extreme panic. BTC market share is 56.59%, showing Bitcoin's dominant position is solid. In terms of funding rates, mainstream CEX and DEX are broadly bearish, indicating market skepticism towards short-term rises, which may suppress the height of the rebound. As for institutional funds, BTC ETF weekly net inflow is 75.5 million USD, and ETH ETF inflow is 105.5 million USD, which is a positive signal. However, geopolitical risks are heating up, as Iranian missiles hit a base in Jordan, which may trigger risk aversion and suppress risk assets. Overall, the funding situation is mixed, but institutional inflows provide bottom support.
Key Defensive and Offensive Levels
Upper Resistance Levels. First resistance level at 65,000, which is an integer key point and psychological resistance. Second resistance level at 65,500, the area of previous highs. Third resistance level at 66,000, near the upper band of the daily Bollinger band.
Lower Support Levels. First support level at 64,500, near the 4-hour MA5. Second support level at 64,200, near the 1-hour EMA55, this is the bullish and bearish boundary. Third support level at 64,000, an integer key point and previous low.
Trading Strategy
Direction: Bullish trend, but with short-term pullback risks, it is recommended to buy on pullbacks and not to chase higher.
Entry Conditions: Wait for the price to pull back to the 64,200-64,500 range, showing support stabilization signals, such as the 15-minute K-line forming long lower shadows or bottom formations, while the MACD pillar value shortens or the RSI falls back from the overbought area to around 50. If the price directly breaks above 65,000 and stabilizes, one can cautiously enter long positions but must set stop-loss orders.
Stop-Loss Level: After entering long, set the stop-loss below 64,000; if it breaks, the trend weakens. If chasing long, set the stop-loss at 64,800.
Target Levels: First target at 65,500, second target at 66,000. If the price breaks above 66,000, it can look to 66,500.
Risk Warning
The current 1-hour RSI is overbought, funding rates are bearish, and short-term pullback risks are high; pay attention to position control and strict stop-losses.
Follow Qinglan Crypto Classroom to seize more trading opportunities! Welcome to visit the official website www.qinglan.org
📊 Qinglan TPV Trading Strategy Backtest Reference
🕒 Last Backtest Time 07-19 07:00:02
Total Analysis: 3049 Backtest: 2335 Accuracy: 76.4% (1785/2335)
免责声明:本文章仅代表作者个人观点,不代表本平台的立场和观点。本文章仅供信息分享,不构成对任何人的任何投资建议。用户与作者之间的任何争议,与本平台无关。如网页中刊载的文章或图片涉及侵权,请提供相关的权利证明和身份证明发送邮件到support@aicoin.com,本平台相关工作人员将会进行核查。