Good morning, friends, I am Sister Qinglan. Early this morning, Federal Reserve's Logan issued another hawkish signal, calling for interest rate hikes to tackle high inflation, which directly put pressure on risk assets. The US stock market and semiconductor index fell into a technical bear market, and Bitcoin also retreated to around 63,900 US dollars. At the same time, a report from JPMorgan stated that the Strategy cash reserves have reached 3 billion US dollars, Bitcoin futures demand is rebounding, and institutional funds are still actively allocating. With one force betting short and another betting long, market sentiment has fallen into fear, with the greed index dropping to 27. At such a juncture, we need to examine the market more calmly and let the data speak.
Current Price and Time
The current time is July 17, 2026, 09:26, with the Bitcoin quote at 63,900 USDT, down 0.88% in 24 hours. The price has retreated from yesterday’s high of around 64,500 US dollars and is currently in a short-term key support area.
Multi-Timeframe Status Overview
First, let’s look at the daily chart. The daily MA5 is at 63,973, MA10 is at 63,714, MA30 is at 62,527, indicating that the short-term moving averages are still in a bullish arrangement. The MACD histogram is positive, with DIF above the zero line, and RSI is at 56.04, in a neutral to strong area. The overall structure of the daily chart has not been broken, but the upward momentum has weakened.
On the 4-hour chart, MA5 and MA10 have formed a death cross; prices have fallen below these two moving averages. The MACD histogram has been negative and continues to expand, with both DIF and DEA above the zero line but opening downward. RSI is at 42.47, indicating that short-term bearish strength is dominant. However, the price remains above MA30, which is at 63,913, forming short-term support.
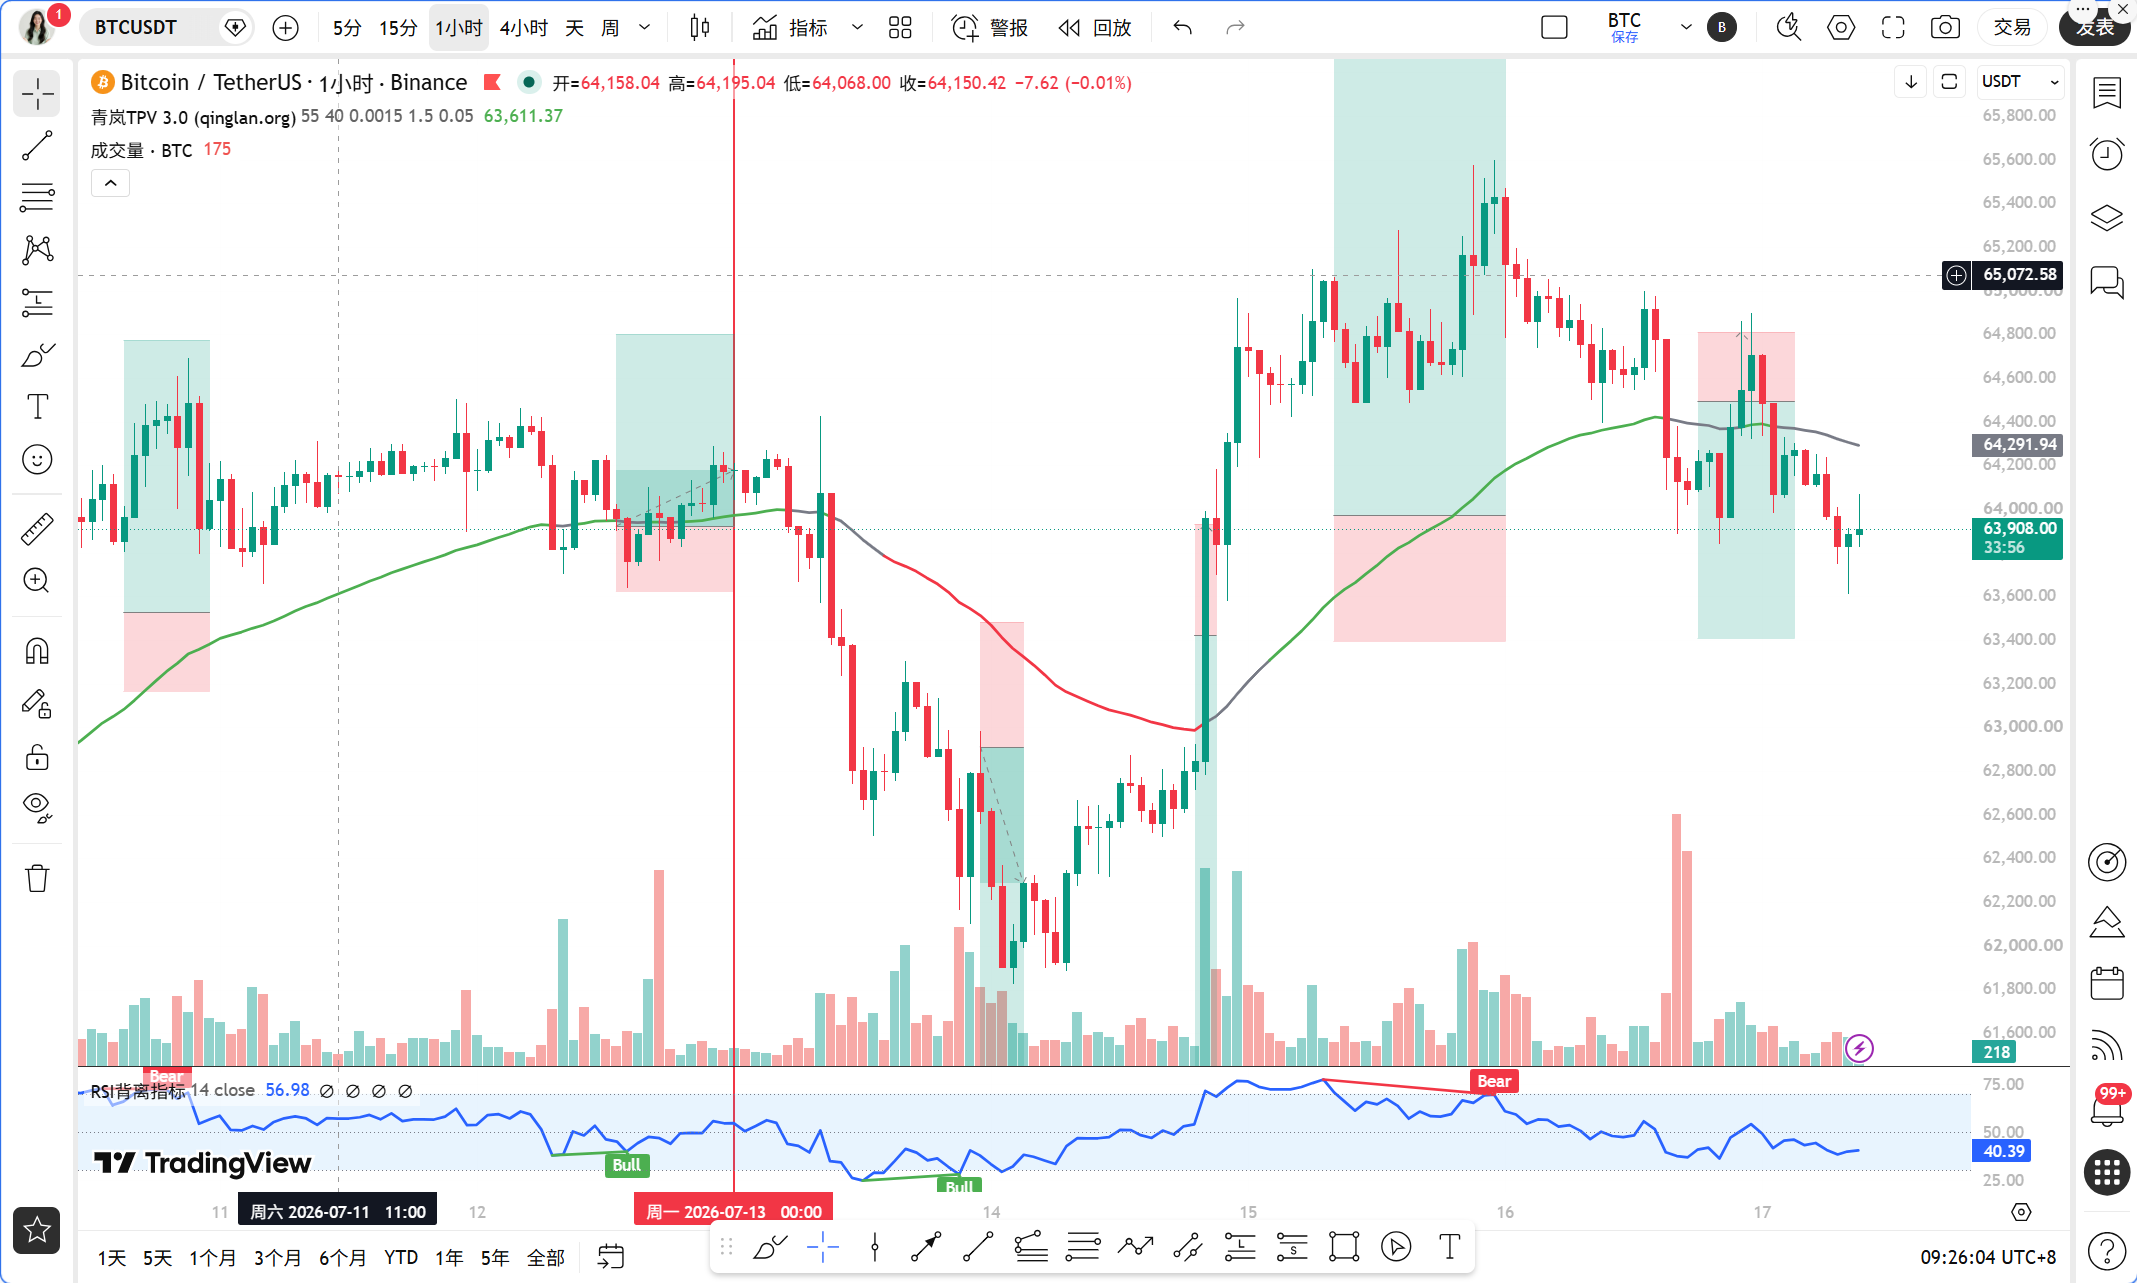
On the 1-hour chart, EMA55 is at 64,215.76, and the current price of 63,900 is significantly below this line. The MACD histogram is negative, with both DIF and DEA below the zero line, and RSI is at 42.80, indicating a clear bearish pattern. In the past 8 1-hour candlesticks, there were only 2 instances where the closing price was above EMA55, and it crossed once. The absolute distance from EMA55 is 0.49%, not meeting the fluctuation threshold, indicating that the current trend is in a one-sided bearish trend.
On the 15-minute chart, prices are fluctuating narrowly around 63,872. Although the MACD histogram has turned positive, DIF is still below the zero line, with RSI at 36.39, indicating a weak rebound after overselling, with limited strength.
TPV Signal Validation
According to the Qinglan TPV system, the current 1-hour EMA55 = 64,215.76, and the price of 63,900 is below this line, with 2 consecutive 1-hour candlestick closing prices below EMA55, satisfying the first condition for shorting: price pressures below the 1H EMA55.
Next, looking at the shape. On the 1-hour chart, after forming a clear high point near 64,500, the price retreated, testing the 63,900-64,100 area repeatedly, but each rebound failed to stabilize above EMA55 and showed long upper shadows, which matches the characteristics of encountering resistance.
In terms of momentum, the MACD histogram has shortened for 2 consecutive periods. Note that this shortening is from a more negative value toward a less negative value and not turning positive, indicating that although the downward momentum is fading, the bears still dominate. RSI has fallen from around 42.80, not exceeding 70, so the conditions for a weak rebound are partially met but are not typical. Overall, it is currently closer to a weak fluctuation within a bearish trend rather than a standard shorting signal trigger point.
On-Chain Fund Flow
On-chain data shows that the fear and greed index has dropped to 27, falling into the extreme fear zone. Historically, such sentiment often corresponds to a stage bottom area. BlackRock withdrew 87.29 million US dollars of BTC and ETH from Coinbase Prime, and institutions are still increasing positions. Crypto.com has secured 400 million US dollars in financing, and E*TRADE has launched cryptocurrency spot trading. These positive factors are hedging against the hawkish signals from the Federal Reserve. The current market is in a phase of "institutions buying, retail investors fearing," and the fund flow is not pessimistic, but short-term sentiment dominates prices.
Key Resistance and Support Levels
The first resistance level above is the 1-hour EMA55, which is 64,215 US dollars, a boundary line between bulls and bears. If the price can stabilize above this line again, the bearish pattern may shift to fluctuation or rebound. The second resistance level is 64,500 US dollars, which is yesterday's high and near the 4-hour MA10. The first support level below is 63,500 US dollars, which is the previous low area and near the daily MA10. The second support level is 62,500 US dollars, corresponding to the daily MA30, which is an important defensive line for the medium-term bulls.
Trading Strategy
Based on the current data, Sister Qinglan suggests the following strategy.
Direction: Currently below the 1-hour EMA55, a clear bearish trend is established. However, considering the extremely low fear index and institutional fund inflow, the risk of chasing shorts is relatively high. It is suggested to primarily short on rebounds and not actively chase shorts.
Entry Conditions: Wait for the price to rebound to near the 1-hour EMA55, that is, in the area of 64,150-64,250. If a long upper shadow appears or the 15-minute MACD histogram turns negative, you may try to short with a light position. If the price directly breaks below 63,500 and increases in volume, you can consider shorting, but with an even lighter position.
Stop-Loss Level: The stop-loss for shorts should be set above 64,550 US dollars, that is, above yesterday's high. If the price breaks through this level, the bearish logic will fail.
Target Levels: The first target is 63,500 US dollars, and the second target is 62,500 US dollars. If there is a bottom formation or increased volume near 63,500, you may consider taking some profits.
Risk Warning
The current market is greatly affected by macro sentiment, with expectations for a shift in Federal Reserve policy conflicting with institutional buying, and short-term volatility may intensify. Please strictly control your position, and the risk for each trade should not exceed 2% of your total funds.
Follow Qinglan's cryptocurrency classes to seize more trading opportunities! Welcome to visit the official website www.qinglan.org
📊 Qinglan TPV Trading Strategy Backtesting Reference
🕒 Last backtest time 07-17 07:00:01
Total analysis: 3001 Backtests: 2315 Accuracy: 76.3% (1767/2315)
免责声明:本文章仅代表作者个人观点,不代表本平台的立场和观点。本文章仅供信息分享,不构成对任何人的任何投资建议。用户与作者之间的任何争议,与本平台无关。如网页中刊载的文章或图片涉及侵权,请提供相关的权利证明和身份证明发送邮件到support@aicoin.com,本平台相关工作人员将会进行核查。