Cryptocurrency Circle Academic: Double Verification of 7.15 Bitcoin (BTC) Cycle Indicators, Grasp New Round of Wealth Opportunities? Latest Market Analysis and Operational Recommendations Explained
Currently, Bitcoin is at 64500, the bull market is crazy, the bear market is desperate, and the volatility is the most exhausting. This is a typical volatile market right now, with back-and-forth tugging, 64500 isn’t particularly high or low, making it most exhausting. Raise a bit and you want to chase, drop a bit and you panic, that’s human nature, no one can escape it. But remember: the cryptocurrency world is not short of opportunities, but lacks capital. Don’t envy other people's short-term profits; that’s all playing with danger.
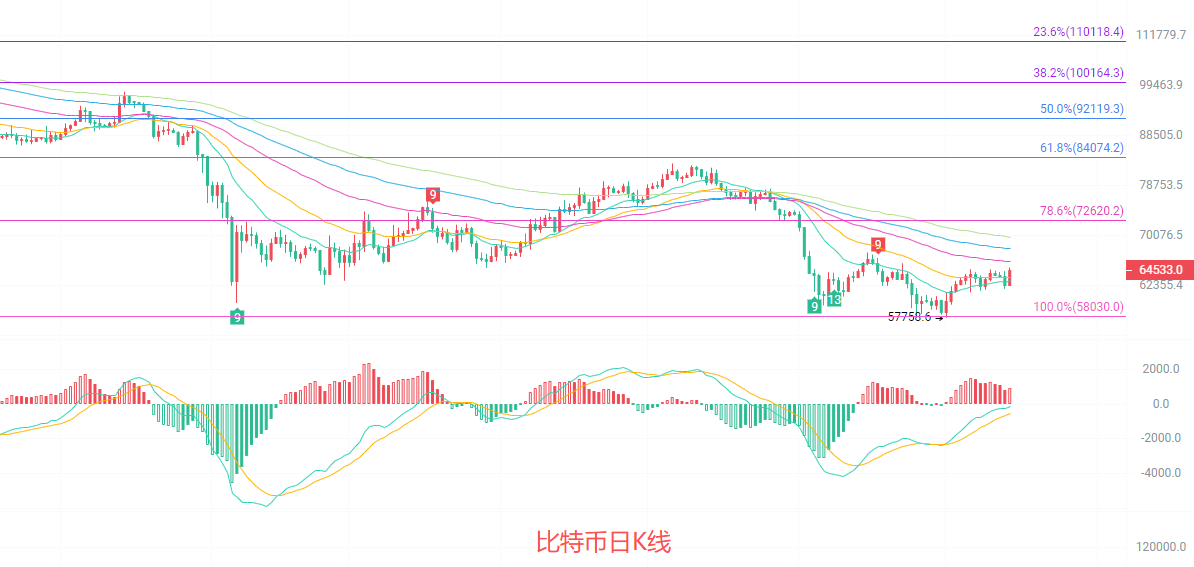
The daily K-line is in the rebound repair stage after a previous decline. The price is still under pressure from the EMA15, EMA30, and EMA60 moving averages, and has not yet fully stood above the mid-term moving average system. The middle line of the Bollinger Bands is 62017, the upper line is 65656, and the current price is approaching the upper line, facing some short-term pressure. The MACD indicator’s DIF has crossed DEA from below, indicating a southward momentum decay, with forces from both sides somewhat recovering. Overall, it is still in a phase of consolidation following a decline, and attention should be paid to whether the pressure around 65600-65800 can be effectively breached.
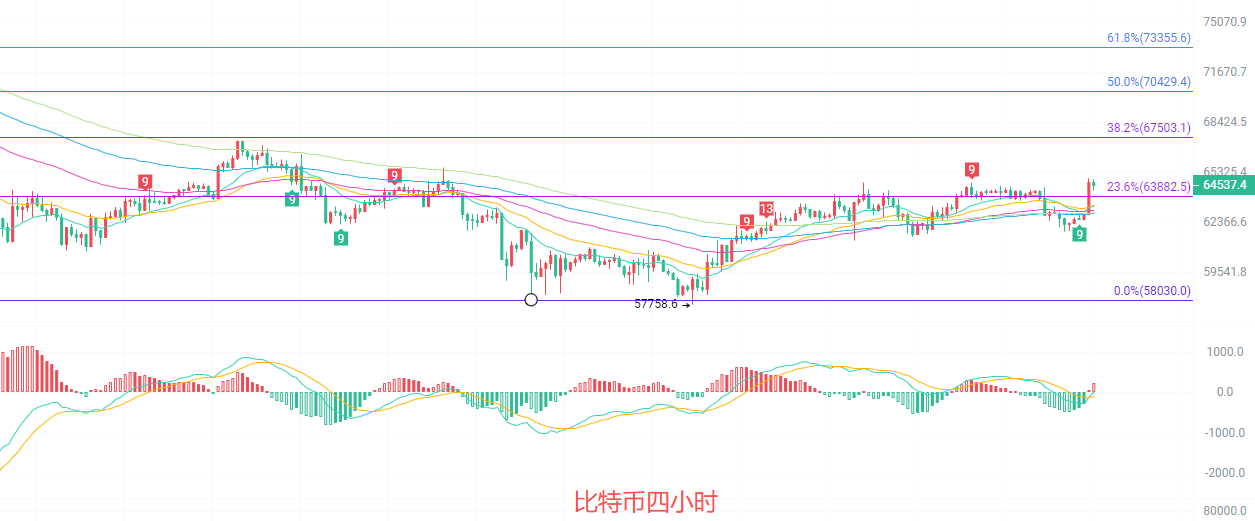
The four-hour K-line has stabilized above the moving averages, with short-term moving averages arranged in a northward alignment, providing strong support. The middle line of the Bollinger Bands is 63460, the upper line is 65054, and the lower line is 61866. The price has run towards the upper line after breaking through the middle line, with a short-term bullish bias. The MACD indicator’s DIF and DEA remain above the zero axis, with the red bars slightly expanding, indicating sustained upward momentum. The key resistance above is slightly broken near the Fibonacci 23.6% level at 63882, with the next resistance looking towards the 67503 area; support below lies at the integer level of 63000, keeping the short-term structure intact and moving upward.
Short-term Reference:
If the price does not break below 64000 to 63500, it goes upward, stop loss at 63000, target looking at 65500 to 66000.
If the price does not break below 65500 to 66000, it goes downward, stop loss at 66500, target looking at 64500 to 64000.
The specific operations should be mainly based on real-time market data. For more information details, please consult the author. This article is published with some delay, recommendations are for reference only and risks are borne by the reader.

Warm Reminder: The above content is solely created by the author of the public account. Advertisements at the end of the article and in the comments section are not related to the author. Please discern carefully, thank you for reading.
免责声明:本文章仅代表作者个人观点,不代表本平台的立场和观点。本文章仅供信息分享,不构成对任何人的任何投资建议。用户与作者之间的任何争议,与本平台无关。如网页中刊载的文章或图片涉及侵权,请提供相关的权利证明和身份证明发送邮件到support@aicoin.com,本平台相关工作人员将会进行核查。